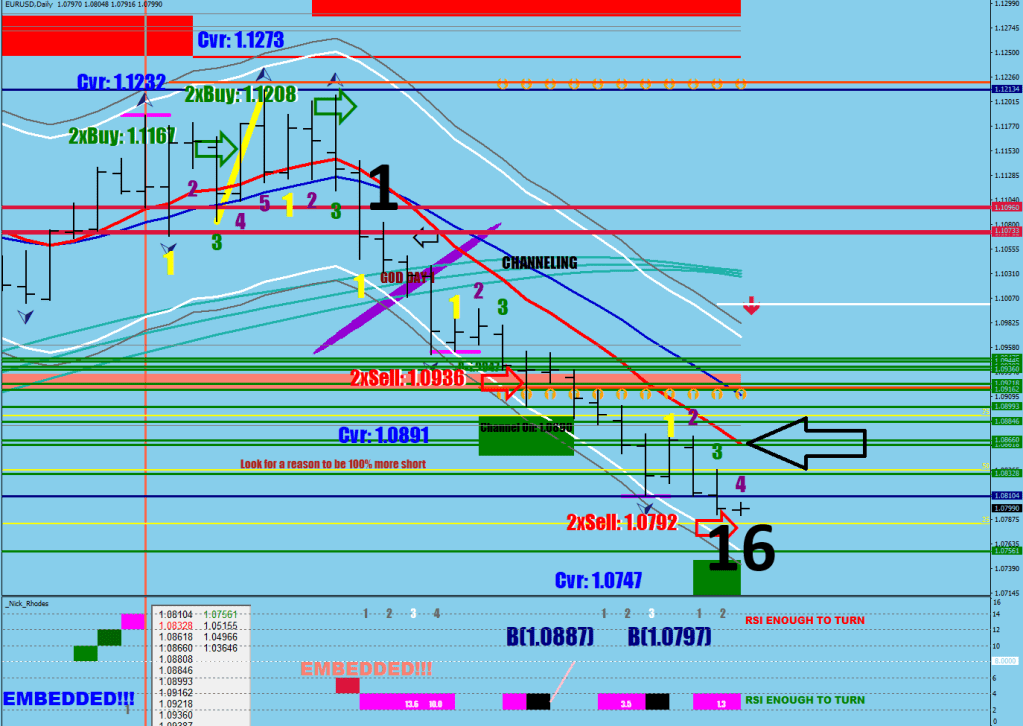
Didn’t I just say that this move-up could be Wave 1 (from the orange-shaded root)?
First of all, we have not had a Wave 4 yet. Apparently, every C wave is made up of 5 waves.
A 5 wave up move not a correction. An ABC with a 5-3-5 structure qualifies.
This was a mean reversion to the S-20. The stochastic embedding is now lost. The daily RSI2 has reached a level that registers as excessive, and so this could be all that she wrote for a counter move before Wave 5 down.
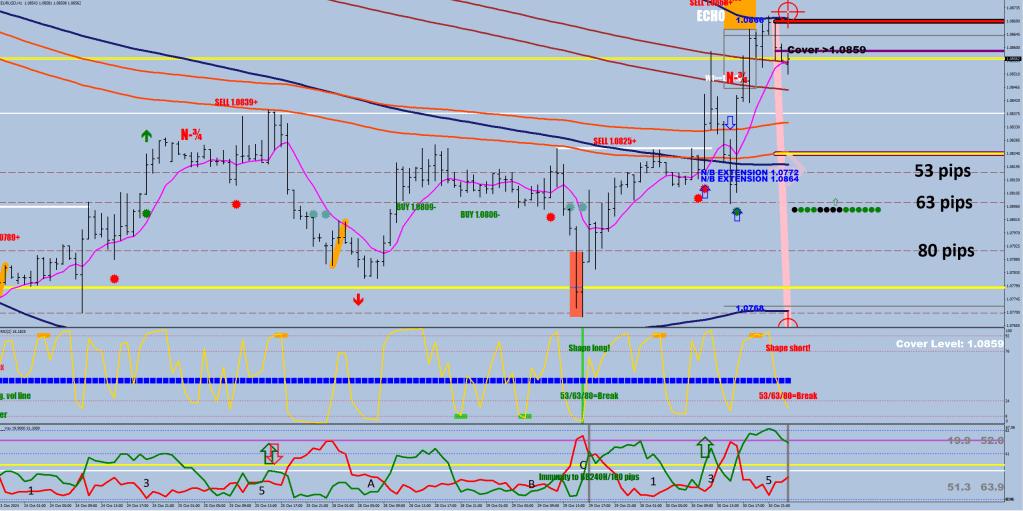
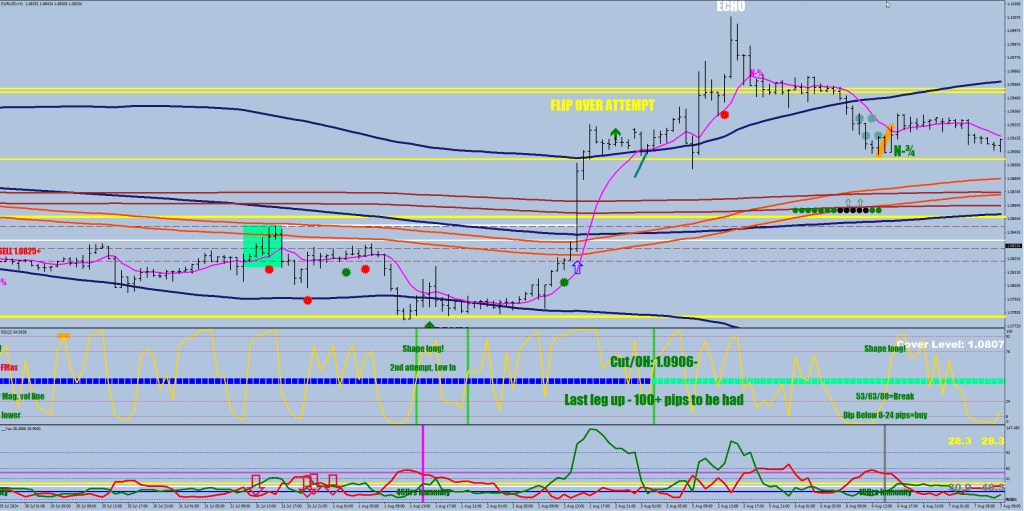
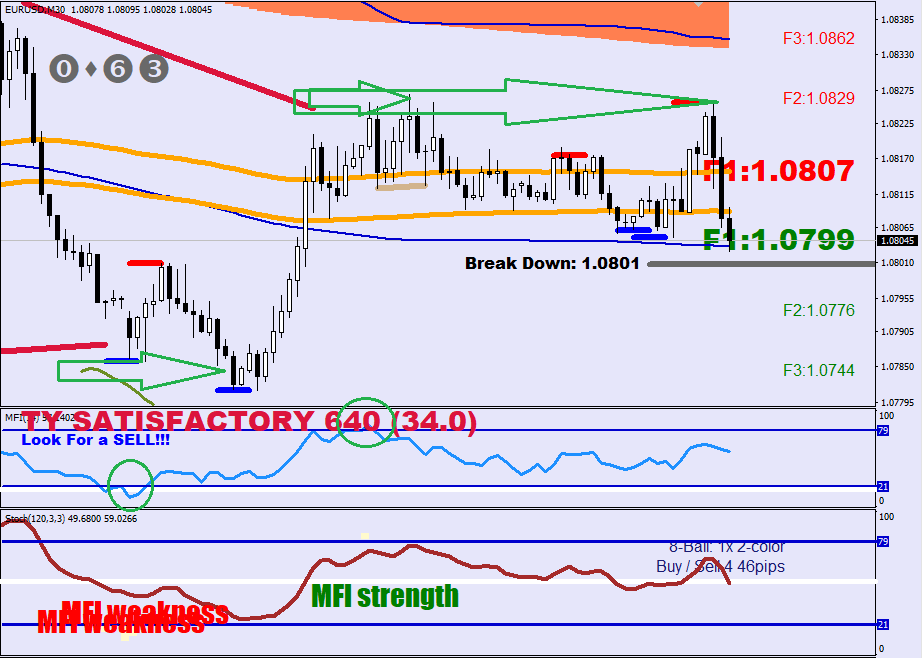
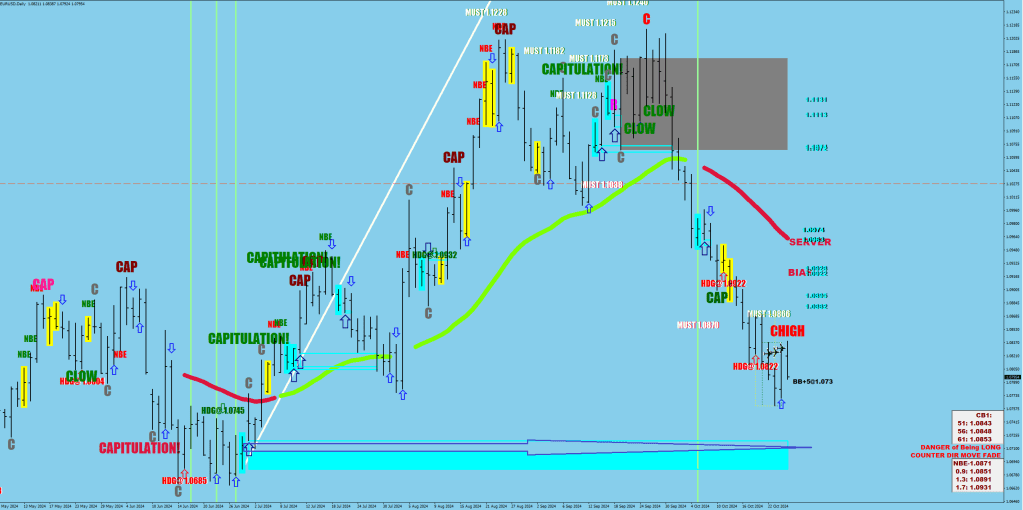
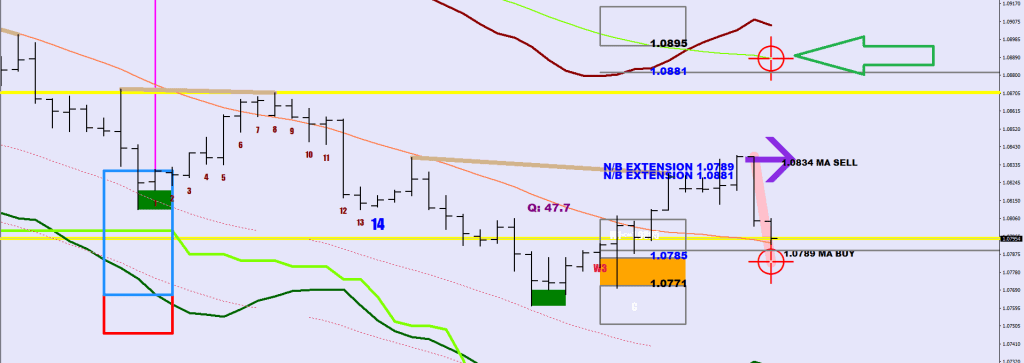
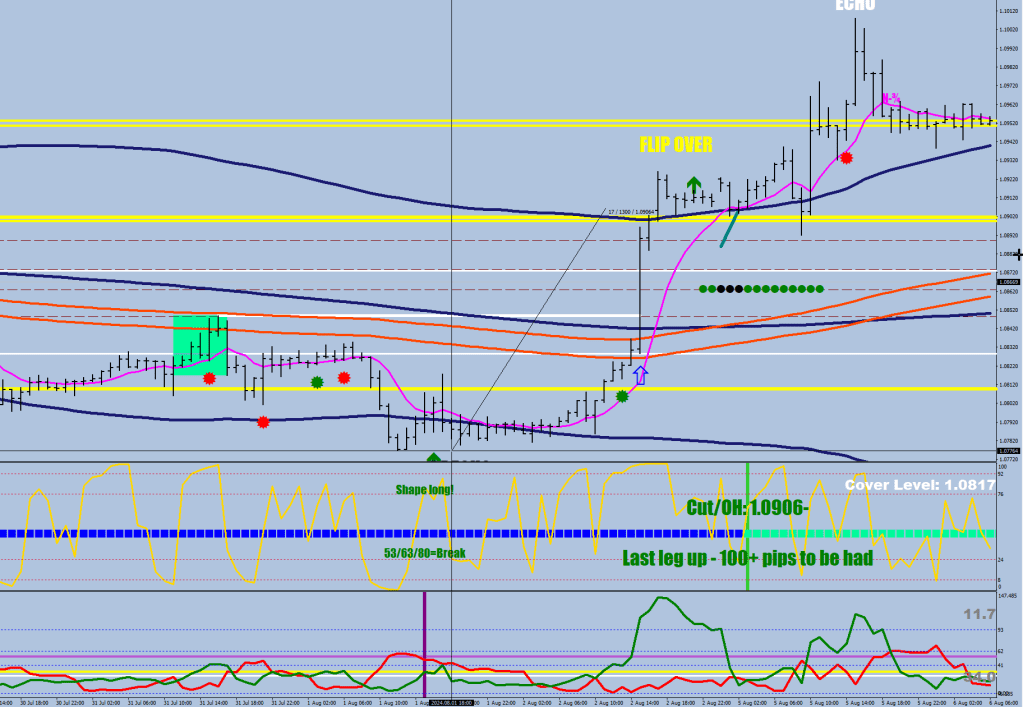
In the first image, you can see the 80-pip checkpoint, at 1.0791. Breaking that would clarify the intention of making that missing lower low. A typical beat would be 16 pips beyond the previous low, so around 1.0745.
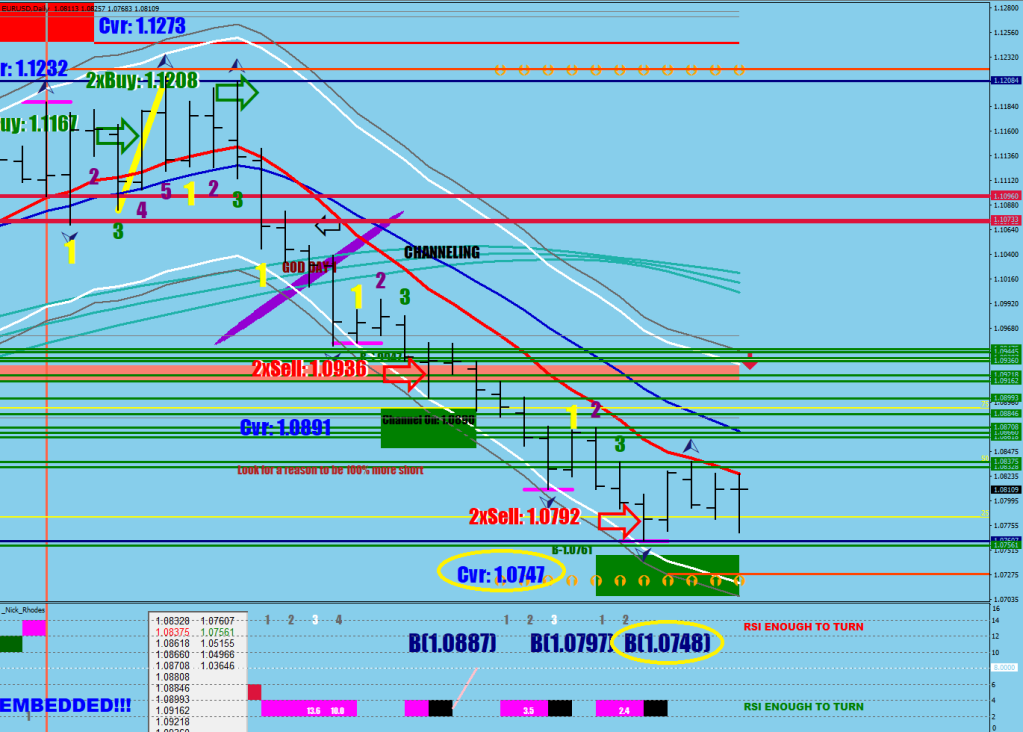
If things really get rolling, the 1.0708 target would be the second important beat a Wave 5 could be making.
Once you have the E-9 Daily Band in place and you plot the guard rails 1-fluctuation maximum out, you may start to ponder if the breach of the E-9 is a must for a Wave 1 print, and perhaps something else may be required before a Wave 3 can commence.
Such a system makes sense to me, even if some of the first waves would later be renamed as an A.
The 4H RSI2 HL2 has to print an overbought/oversold value (70+, 30-) at the end of Wave 2 before the rest of the structure can commence.
At times the pullback may be so shallow, that it would become a target for a beat.
These “Expansions” are suggestive of a corrective structure.
All in all, Wave 2 seems to always end in a Lower High / Higher Low.
Like I said before, my proxy on the 4H for the E-9 is E-52. The FMax value is 38.4 pips measured from the E-52 Lows and the E-52 highs.
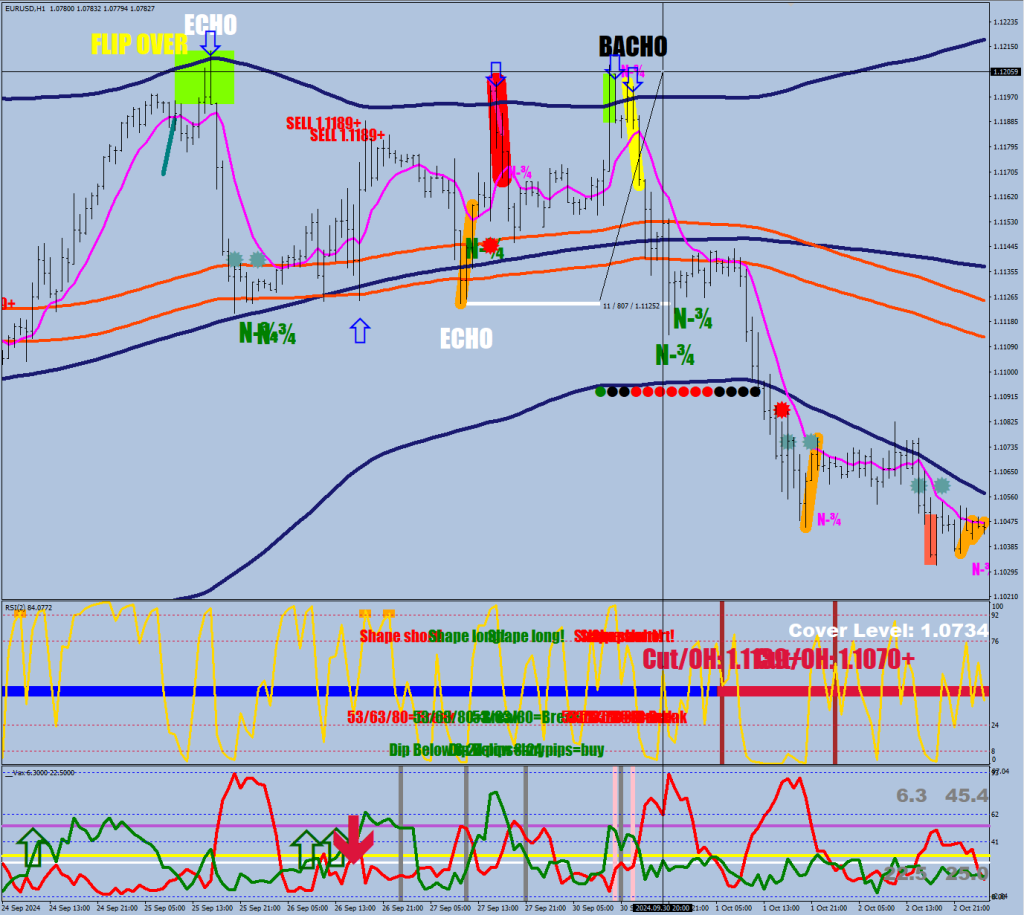
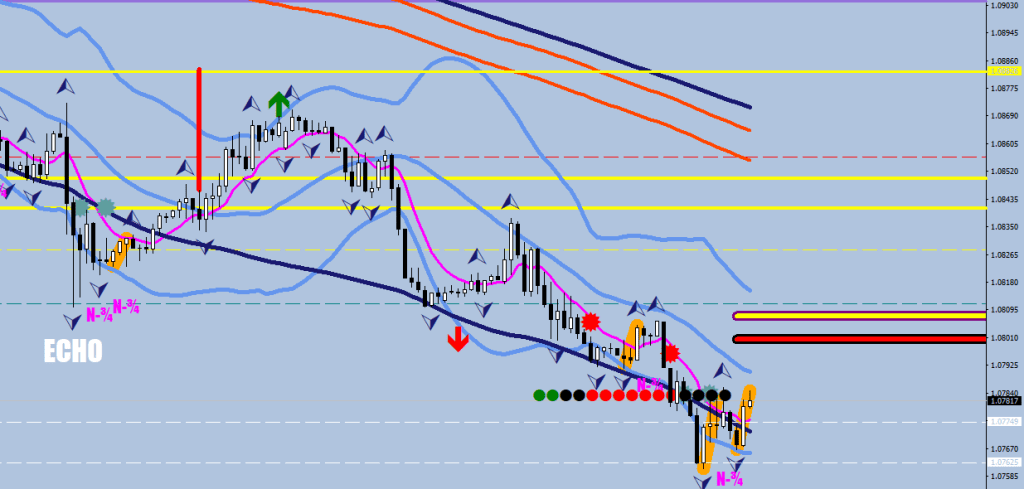
There is an Echo printing on the upside. The upside would have failed at the S-356 band if the next hour would not be able to take out the fractal high.
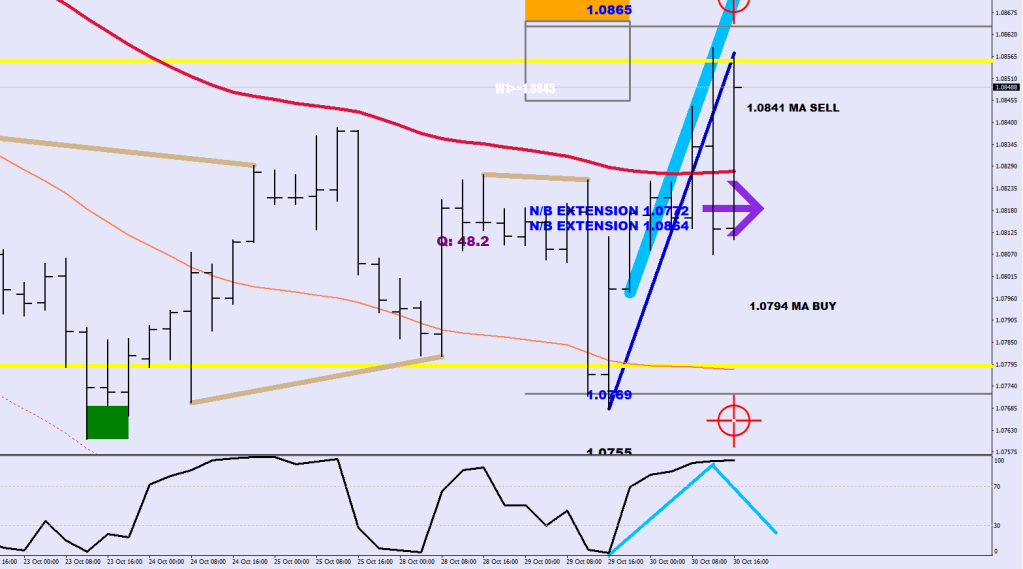
The bigger picture is dipping into the imbalance left by the pro buying. That’s below 1.0708.
With that said, the 25% line is at 1.0729 and a small fake-out could be all you would see from the Wave3.
A Wave 4 would likely pull back to the upper guard rail; picture a mirror image of the following.
Now, on the way down the base case is still a 25-50 pips beat. Which in theory could mean a near miss of the 1.0708 level this time around. There may be a shallow dip below or a halfway mark, but then you would see a 125-175 pips correction back up.
The second magenta strip is missing.
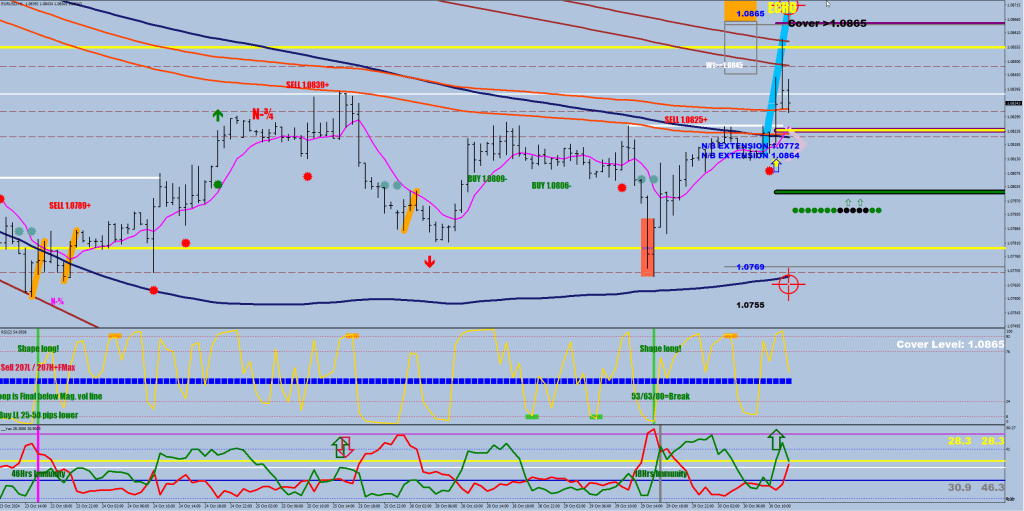
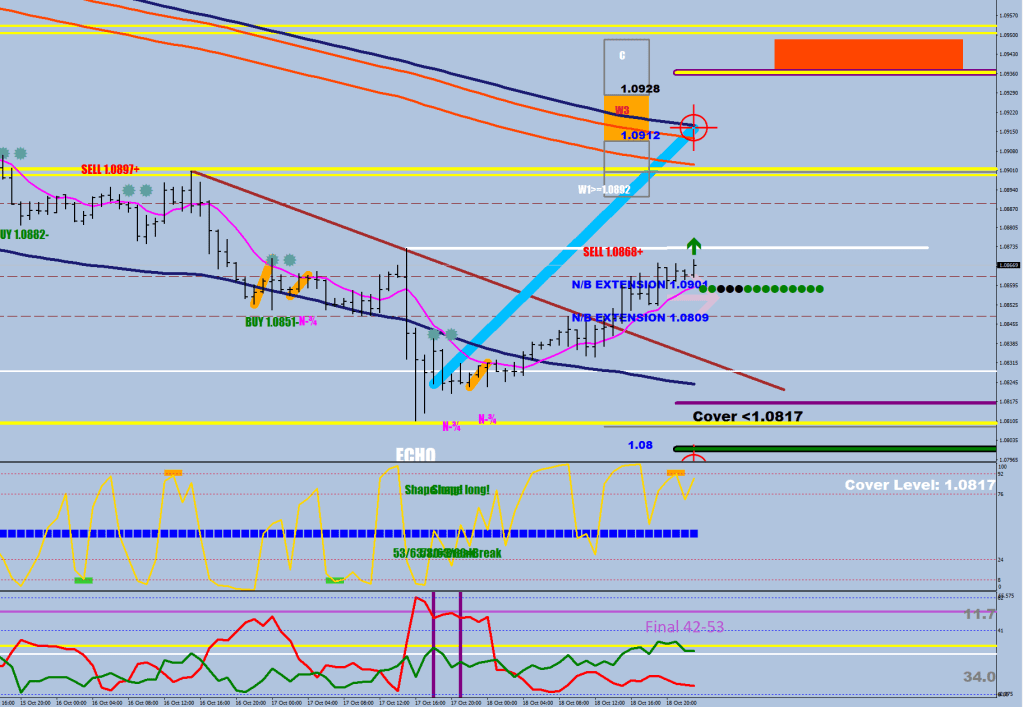
The upper guard rail is around 1.0890 currently. An ABC pullback beyond that would keep the wave structure going, and the Wave5 would finish what the Wave3 could not muster.
The guard rails are 1 fluctuation maximum away from the E-9 band. On the 4H this is the 52-EMA high to low plus minus 38.4 pips.
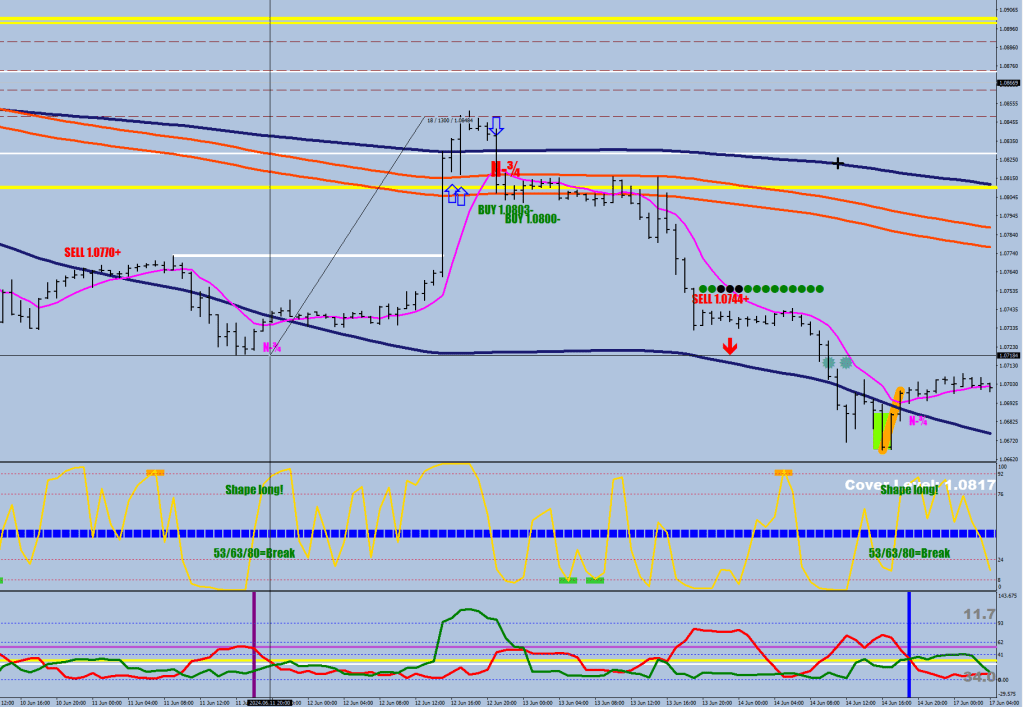
So I wasn’t allowing for a shape plot when the crossback is happening whilst the price is still below the band. I have to include these from now on, since this one took out yesterday’s high, but with a different color. Magenta would stand for a lower low / 2nd attempt is still coming.
On this image, there were 2 more lows, the last one 25 pips out.
The following was also in a pair, but the second low was 51 pips lower.
So yeah, a shot over the bow, but think lower still.
This one would require a lot of patience. I am going against things like the fractal nature of the market.
A Wave 5 isn’t a big riddle.
A colored shape can call the right shoulder, you get the breaks, the previous swing high and the 80 pips (the two more or less coincided at the top), and you are on your way.
2.6x stretch from the E-9 is achieved on the last leg? Ok.
The white band is at 2.8x Stretch.
   int FSize=32;
   double FMax = FSize*6/5;
   E9P[i]=iMA(symbol,0,9,0,MODE_EMA, PRICE_MEDIAN,i)+FMax*2.8*10*Point;
   E9M[i]=iMA(symbol,0,9,0,MODE_EMA, PRICE_MEDIAN,i)-FMax*2.8*10*Point;
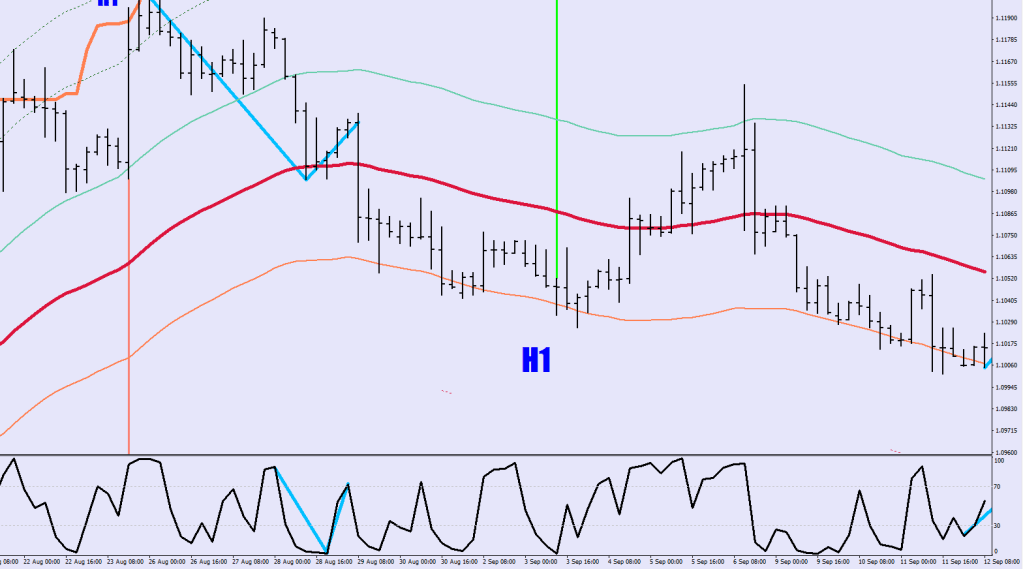
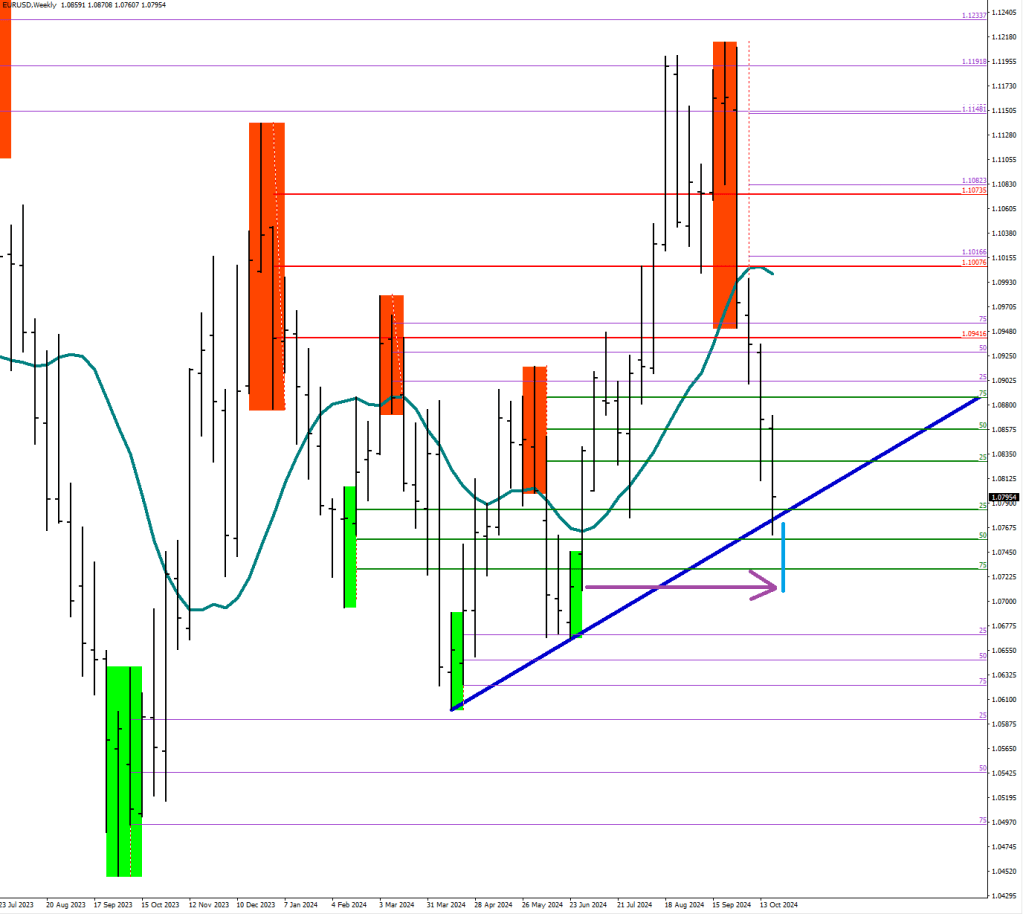
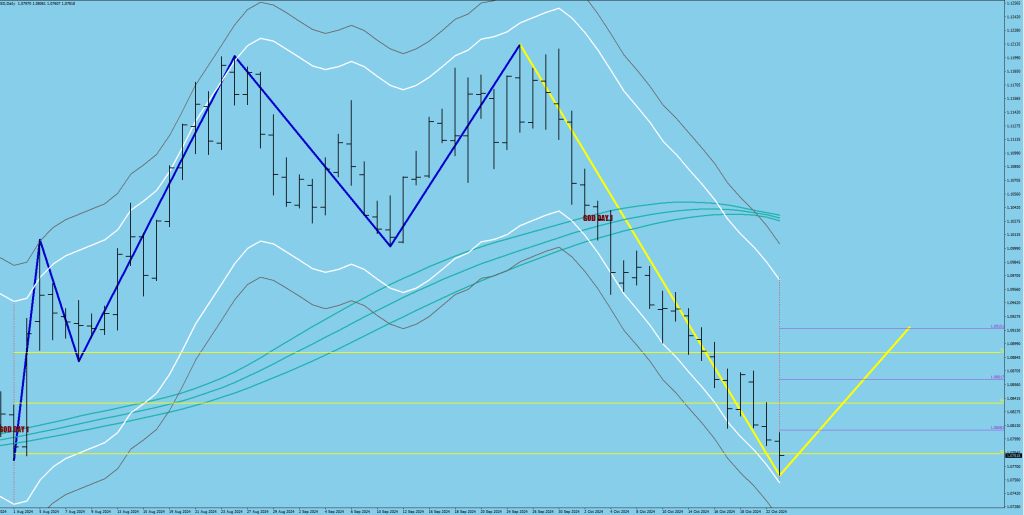
The wave isn’t over until the price violates the 14-sample Weekly window envelope? If it is so, that would make for a major advantage: 4 weeks ago you already could have known that the W3 would get below 1.0764. Perfect aiming device for options.
Let’s use the last end of W3 as a template. Vertical flip.
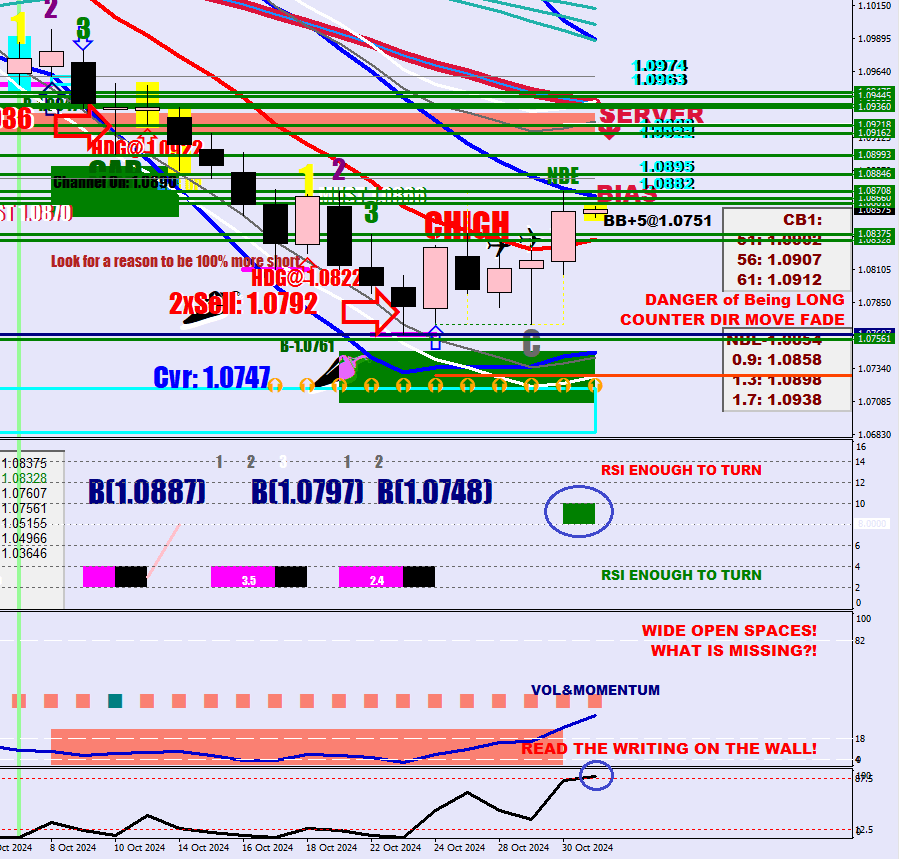
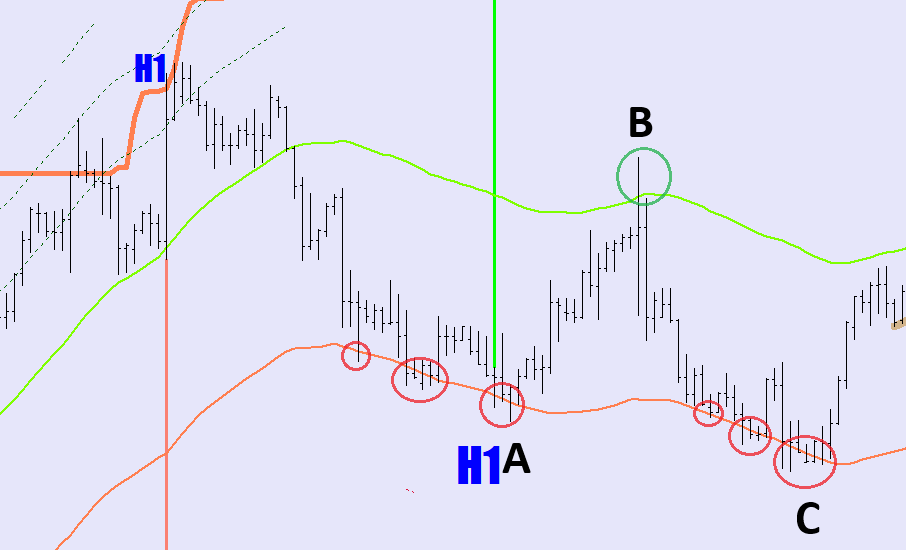
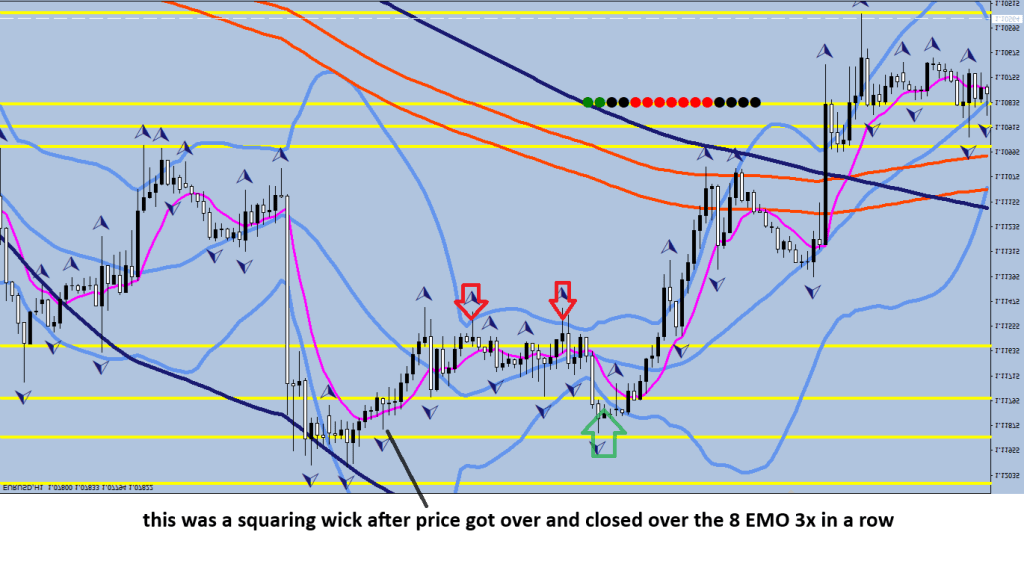
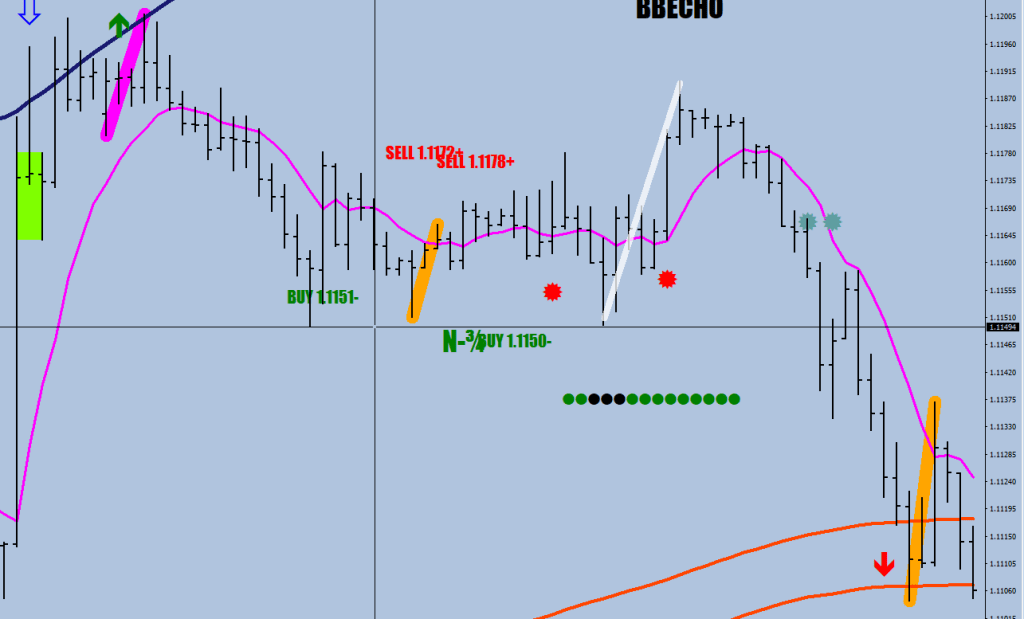
I am most interested about the play with the 8 EMO (Magenta) and the 30-sample BB. The two spike outs on the top, the one backtest leg into the row of dojis.
The first two fractals are made, the second close above the 8 EMO is pending.
EMO = EMA of Opens
iMA(symbol,0,8,0,MODE_EMA,PRICE_OPEN,i)
On the upside, the backtest leg was a BBECHO plot. Hoping to get the same.
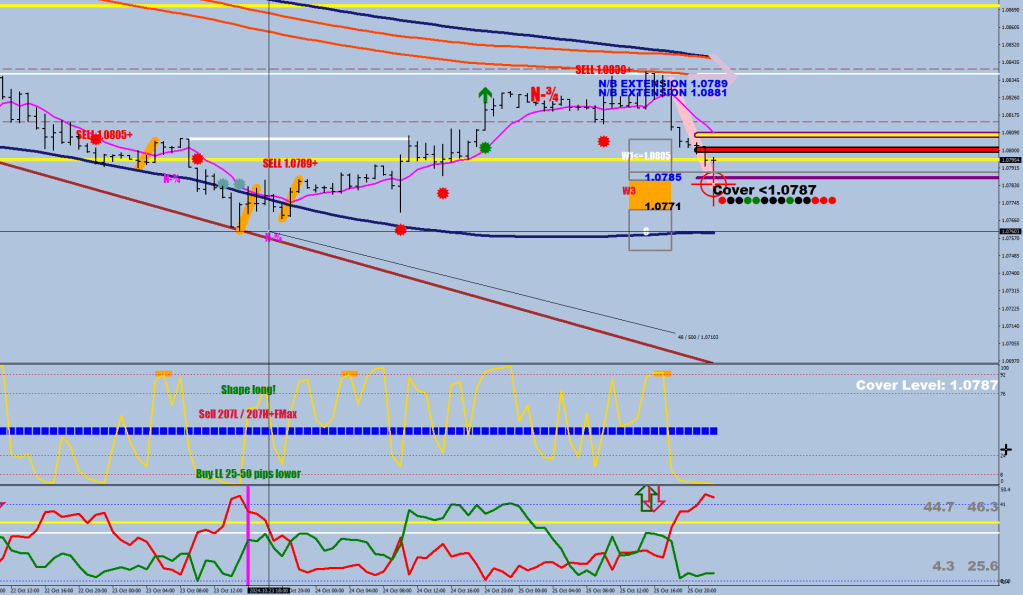
The cover function currently is pretty clear, a D print (1.5 hr volatility on the decline).
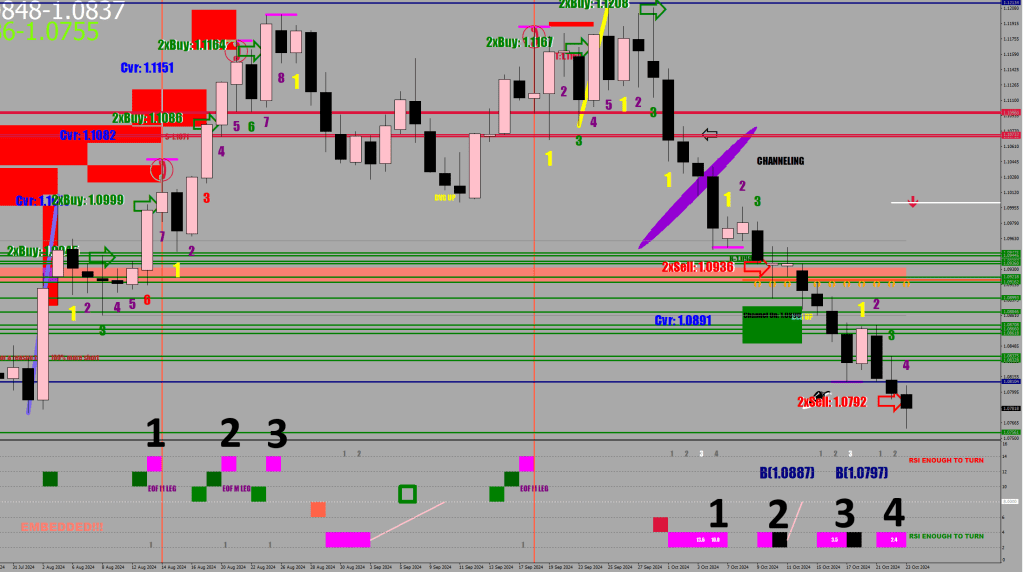
Now, why was the “?” a sell?
The volatility check zone of 24-32 pips in a senior trend requires the market to show strength. All buy-side volatility expansions (10-sample) are suspect My chosen proxy would be lows above the 8 EMO. Less than 3 consec. is a no-go.
In every example I have there are at least 130 pips to be had from the swing low.
Only one example for the price pulling back to the breakout, so drawdown if any, would be limited.
The thick white line is the level to clear.
If you get a drop first, that’s a head start for a discount initial position. Add the rest on the break.
History:
New release:
The one example of a 40-pip pullback from the breakout line happened on the upside. I would go with 4 pips out not to be picked up for this kind of choking. The line was not hit (on a bid chart) but this does not mean that the broker does not slip you into the sucker trade.