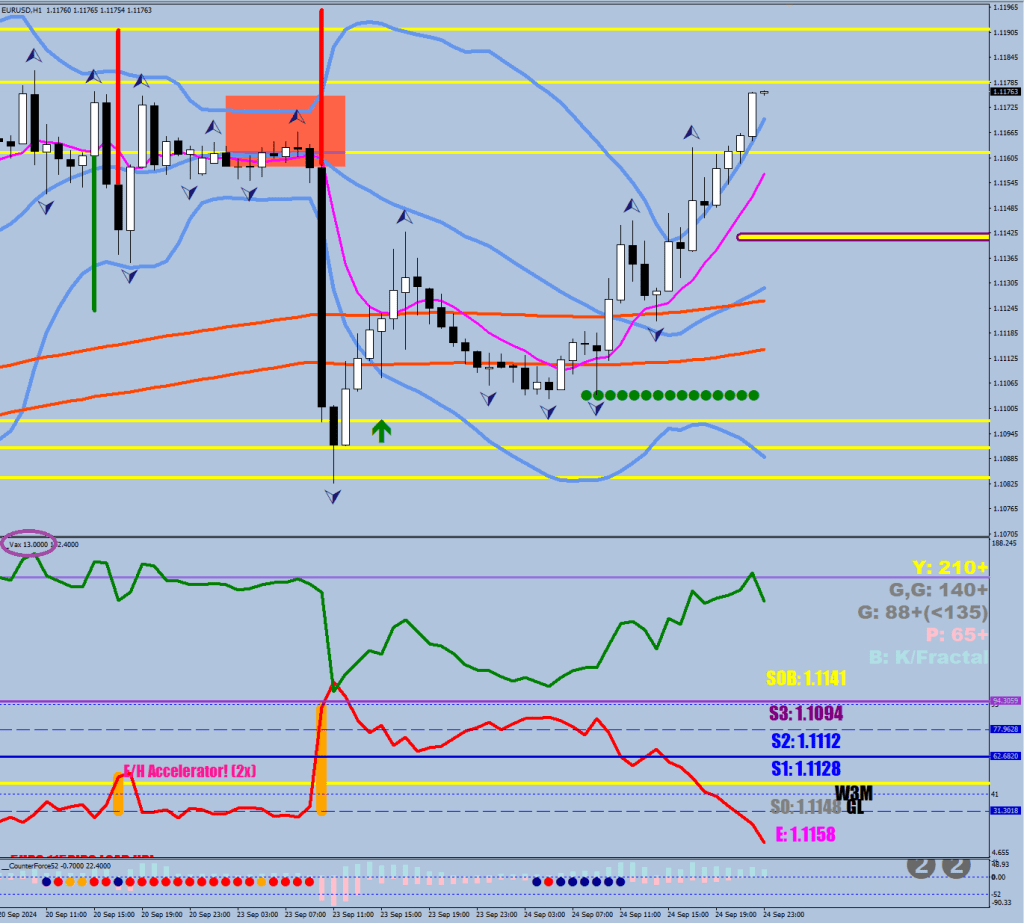
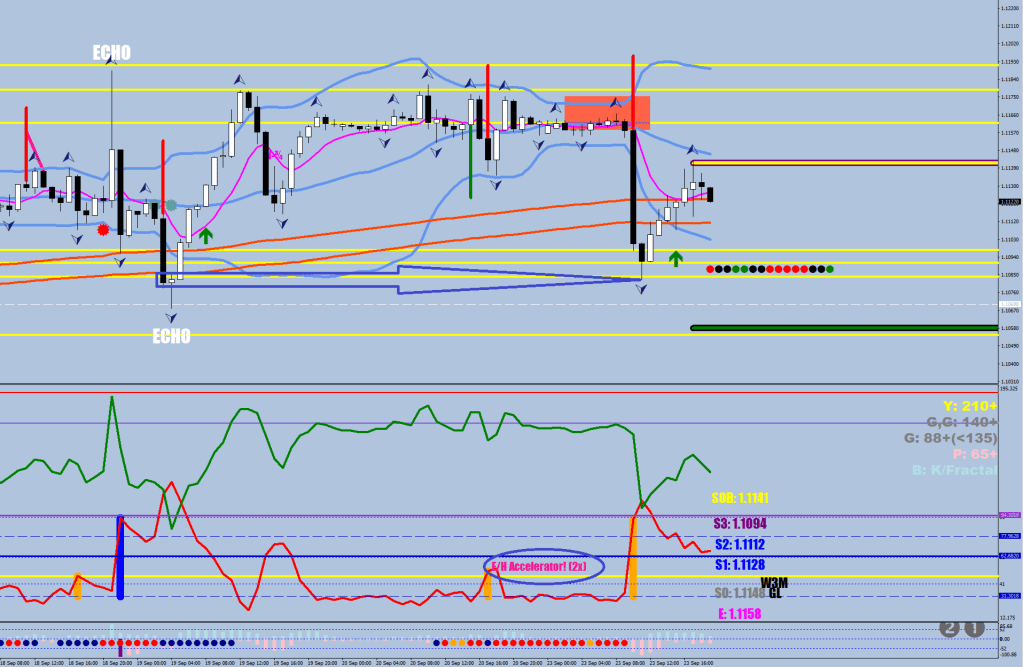
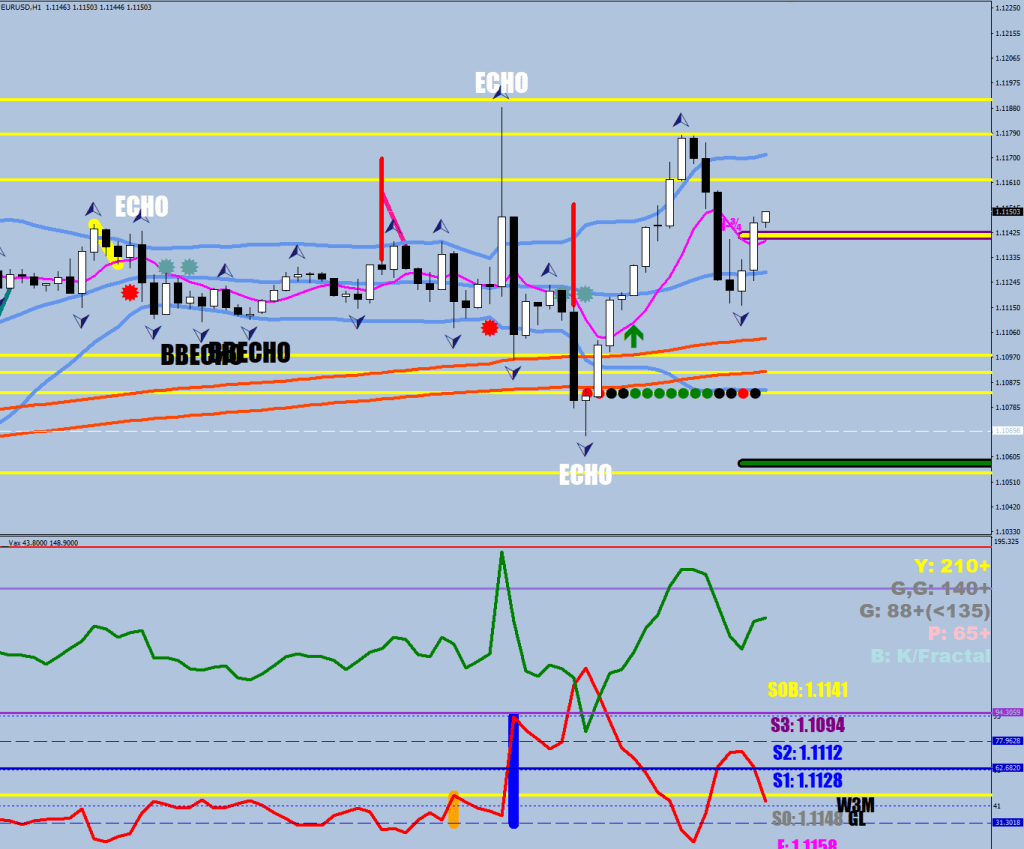
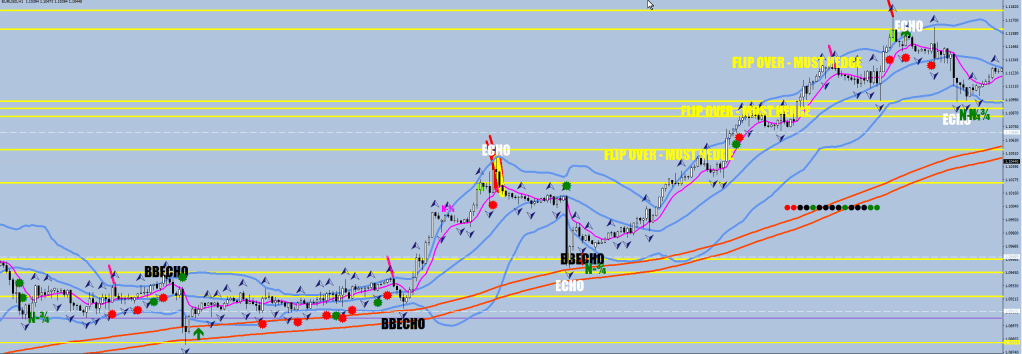
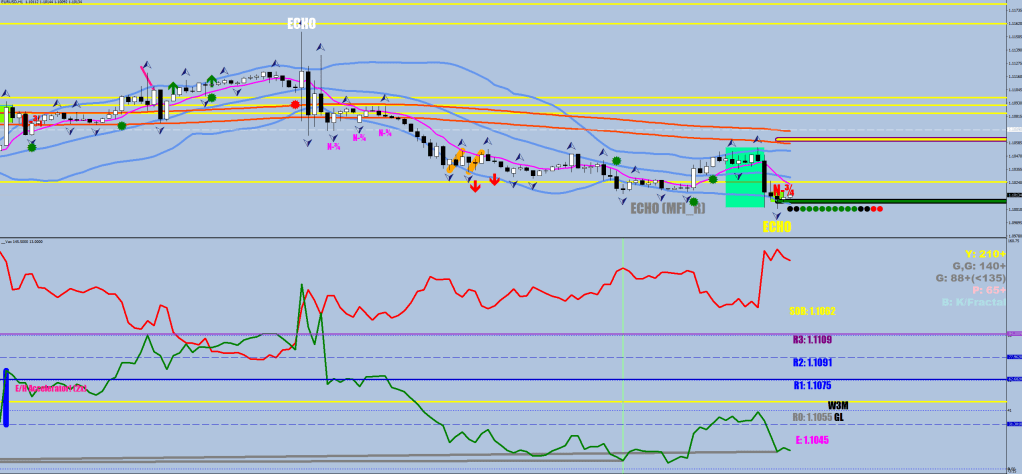
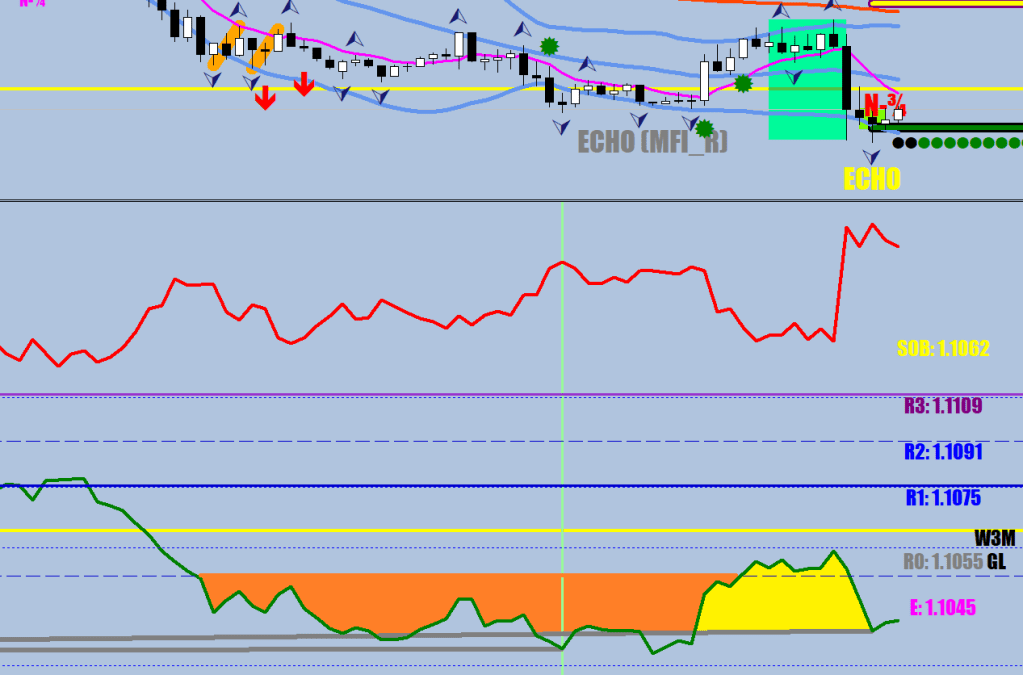
First about volatility whips.

When they turn off the buy/sell program, the market – for once – gets a free, balancing move.
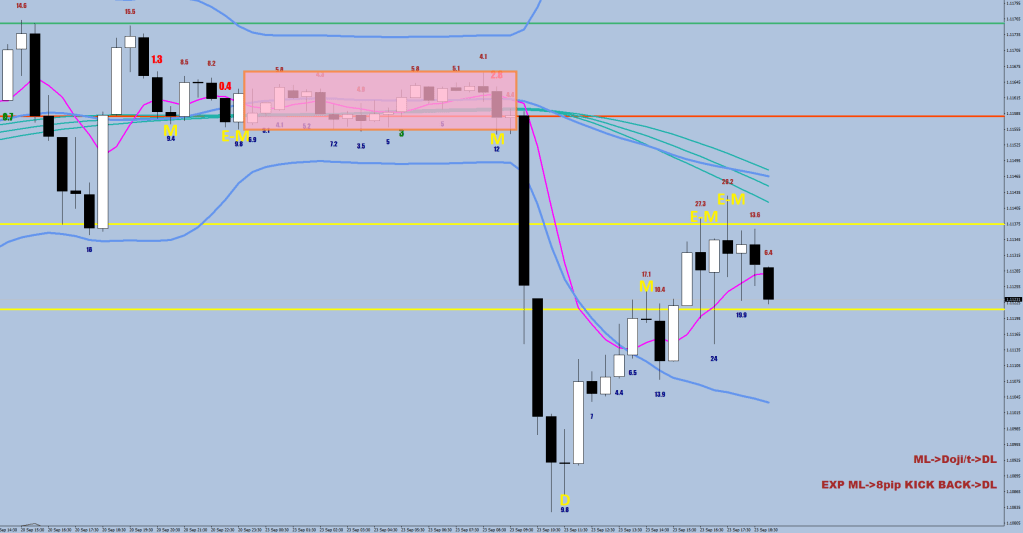
It is highlighted by my pitstop dots here. The 3rd close below the 8 EMO gets a red dot and happens to be the end of the first leg of the V, then the counter move does the same thing on the other side with the 3rd hour’s green dot being the end of the V. Of course, there is a larger version of this in the daily chart. A true market clash, a calibration and possibly figuring the right volume/distance for the next compression act.
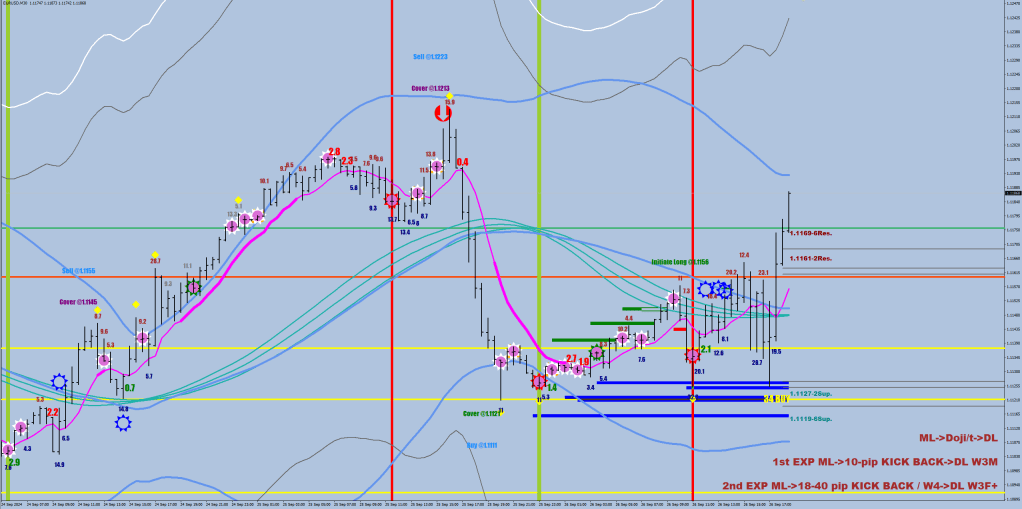
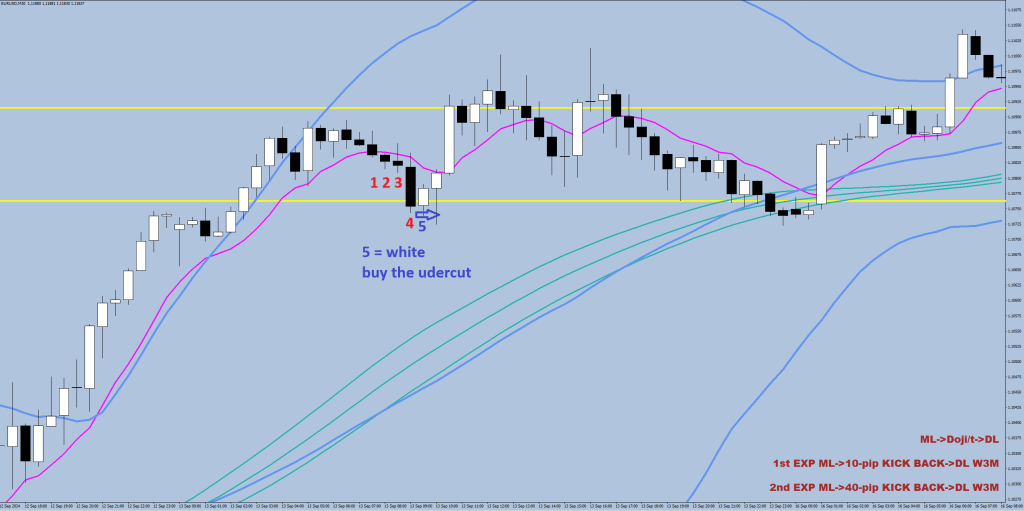
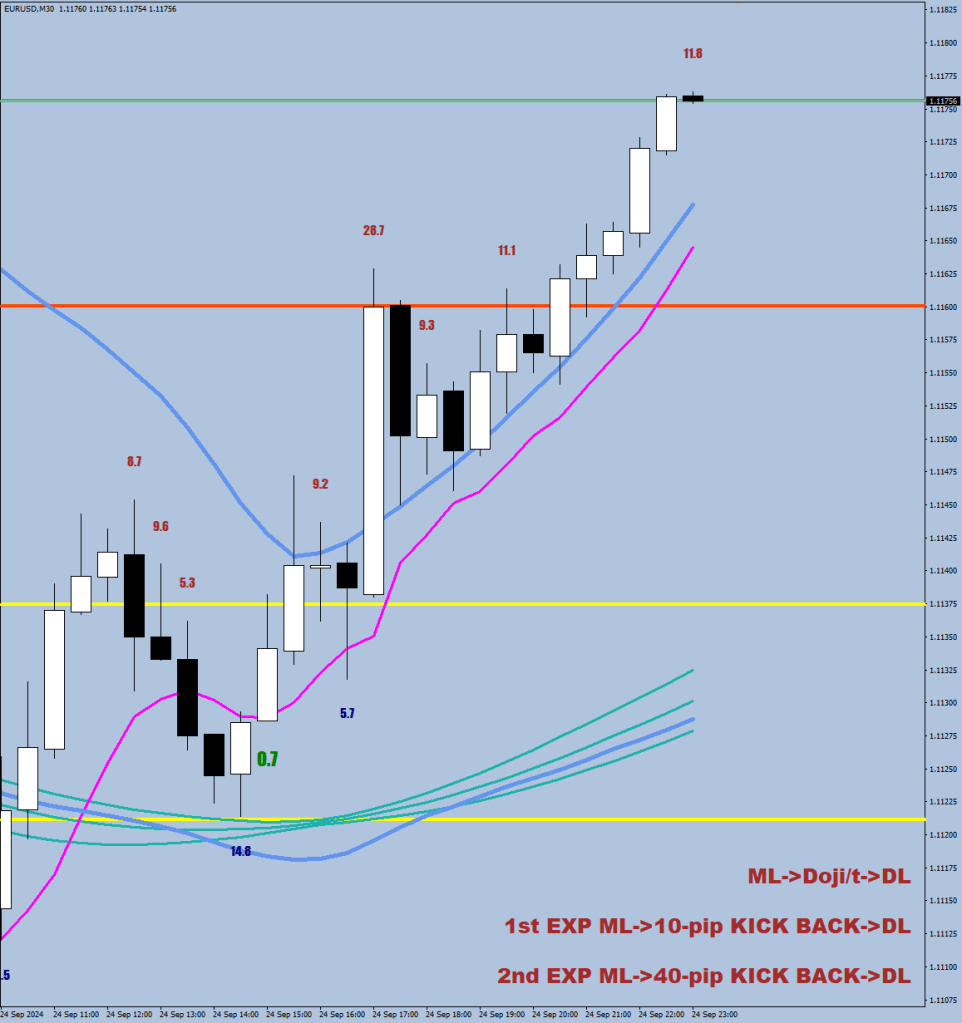
I currently only have a pimped-out Doji version here, sorry for that. The idea of 2 and 6 dojis back provides some context for plausible support/resistance starting where. Just comment out whatever you don’t want to be plotted.
//+------------------------------------------------------------------+
//|                                                Dojis By_Macdulio |
//+------------------------------------------------------------------+
#property copyright "Copyright © 2017, Macdulio"
#property link      "https://forexfore.blog"


#property description "Change the parameters for"
#property description "desired results if in need to."

extern int lookback = 300;
//---- input parameters for regular doji
extern int       MinLengthOfUpTail=5; //candle with upper tail equal or more than this will show up
extern int       MinLengthOfLoTail=6; //candle with lower tail equal or more than this will show up
extern int    MaxLengthOfBody=16; //candle with body less or equal with this will show up

//---- input parameters for dragonfly doji
extern int       MaxLengthOfUpTail1=10; //candle with upper tail equal or more than this will show up
extern int       MinLengthOfLoTail1=13; //candle with lower tail equal or more than this will show up
extern int    MaxLengthOfBody1=11; //candle with body less or equal with this will show up

//---- input parameters for gravestone doji
extern int       MinLengthOfUpTail2=13; //candle with upper tail equal or more than this will show up
extern int       MaxLengthOfLoTail2=10; //candle with lower tail equal or more than this will show up
extern int    MaxLengthOfBody2=20; //candle with body less or equal with this will show up
double pt=0.00001;

#property indicator_chart_window
#property indicator_buffers 9


double doji[];
double doji2[];
double EU[],ED[], exit[], e8h[];
double EU2[],ED2[];
double dojir[],dojig[], dojib[];
double RSI2[];

//---- indicator buffers

  double xLo[];
//+------------------------------------------------------------------+
int init()  {
//+------------------------------------------------------------------+
  string short_name;

   SetIndexStyle(0,DRAW_ARROW,EMPTY,13,Orange);
   SetIndexBuffer(0,exit);

 SetIndexStyle(1,DRAW_ARROW,EMPTY,8,Orchid);
   SetIndexBuffer(1,doji);
  SetIndexArrow(1,108);
  SetIndexStyle(2,DRAW_ARROW,EMPTY,10,White);
     SetIndexBuffer(2,doji2);
  SetIndexArrow(2,82);

  SetIndexStyle(3,DRAW_ARROW,EMPTY,10,Red);
     SetIndexBuffer(3,dojir);
  SetIndexArrow(3,82);

    SetIndexStyle(4,DRAW_ARROW,EMPTY,10,Green);
     SetIndexBuffer(4,dojig);
  SetIndexArrow(4,82);

      SetIndexStyle(5,DRAW_ARROW,EMPTY,10,Blue);
     SetIndexBuffer(5,dojib);
  SetIndexArrow(5,82);

     SetIndexStyle(6,DRAW_LINE,EMPTY,7,Magenta);
   SetIndexBuffer(6,e8h);

      SetIndexBuffer(7,EU);
    SetIndexBuffer(8,ED);
//---- drawing settings
    SetIndexStyle(7,DRAW_ARROW,EMPTY,7,Yellow);
    SetIndexArrow(7,119);
    SetIndexStyle(8,DRAW_ARROW,EMPTY,7,Yellow);
    SetIndexArrow(8,119);

    SetIndexBuffer(9,EU2);
    SetIndexBuffer(10,ED2);
//---- drawing settings
    SetIndexStyle(9,DRAW_ARROW,EMPTY,13,OrangeRed);
    SetIndexArrow(9,119);
    SetIndexStyle(10,DRAW_ARROW,EMPTY,13,OrangeRed);
    SetIndexArrow(10,119);


    ArrayResize(dojir, lookback);
  ArrayInitialize(dojir, EMPTY_VALUE);
      ArrayResize(dojig, lookback);
  ArrayInitialize(dojig, EMPTY_VALUE);
         ArrayResize(dojib, lookback);
  ArrayInitialize(dojib, EMPTY_VALUE);
   ArrayResize(doji, lookback);
     ArrayInitialize(dojib, EMPTY_VALUE);
   ArrayResize(exit, lookback);
  ArrayInitialize(exit, EMPTY_VALUE);
     ArrayResize(doji2, lookback);
  ArrayInitialize(doji2, 0);
       ArrayResize(RSI2, lookback);
 ArrayInitialize(RSI2, EMPTY_VALUE);
ArrayResize(EU, lookback+30);
 ArrayInitialize(EU, EMPTY_VALUE);
ArrayResize(ED, lookback+30);
 ArrayInitialize(ED, EMPTY_VALUE);
ArrayResize(EU2, lookback+30);
 ArrayInitialize(EU2, EMPTY_VALUE);
ArrayResize(ED2, lookback+30);
 ArrayInitialize(ED2, EMPTY_VALUE);
 ArrayResize(e8h, Bars);
 ArrayInitialize(e8h, EMPTY_VALUE);
  short_name="Dojis";
  IndicatorShortName(short_name);
  IndicatorDigits(5);

  return(0);
}

//+------------------------------------------------------------------+
int start()   {
//+------------------------------------------------------------------+

  int j;
 string symbol = Symbol();

if (Period()==1440){
//---- input parameters for regular doji
MinLengthOfUpTail=5; //candle with upper tail equal or more than this will show up
MinLengthOfLoTail=5; //candle with lower tail equal or more than this will show up
MaxLengthOfBody=150; //candle with body less or equal with this will show up

//---- input parameters for dragonfly doji
MaxLengthOfUpTail1=700; //candle with upper tail equal or more than this will show up
MinLengthOfLoTail1=13; //candle with lower tail equal or more than this will show up
MaxLengthOfBody1=150; //candle with body less or equal with this will show up

//---- input parameters for gravestone doji
MinLengthOfUpTail2=10; //candle with upper tail equal or more than this will show up
MaxLengthOfLoTail2=1400; //candle with lower tail equal or more than this will show up
MaxLengthOfBody2=20; //candle with body less or equal with this will show up

}

deletetxt1("Bacardi");

 for (int i=lookback-1; i>=0; i--)
    {

         if ((High[i]<iMA(NULL,0,8,0,MODE_EMA, PRICE_OPEN,i) && High[i+1]<iMA(NULL,0,8,0,MODE_EMA, PRICE_OPEN,i+1) && High[i+2]<iMA(NULL,0,8,0,MODE_EMA, PRICE_OPEN,i+2) && High[i+3]<iMA(NULL,0,8,0,MODE_EMA, PRICE_OPEN,i+3) && High[i+4]<iMA(NULL,0,8,0,MODE_EMA, PRICE_OPEN,i+4) )  || (Low[i]>iMA(NULL,0,8,0,MODE_EMA, PRICE_OPEN,i) && Low[i+1]>iMA(NULL,0,8,0,MODE_EMA, PRICE_OPEN,i+1) && Low[i+2]>iMA(NULL,0,8,0,MODE_EMA, PRICE_OPEN,i+2) && Low[i+3]>iMA(NULL,0,8,0,MODE_EMA, PRICE_OPEN,i+3)&& Low[i+4]>iMA(NULL,0,8,0,MODE_EMA, PRICE_OPEN,i+4) )) e8h[i]=iMA(NULL,0,8,0,MODE_EMA, PRICE_OPEN,i);

           doji[i]=EMPTY_VALUE;

         RSI2[i]=iRSI(symbol,0,2,PRICE_MEDIAN,i);

        if (Period()==1440 || (Period()<1440 && i>0)){
       if(High[i]-Close[i]>=MinLengthOfUpTail*pt && Close[i]-Low[i]>=MinLengthOfLoTail*pt  && MathAbs(Close[i]-Open[i])<=MaxLengthOfBody*pt && doji[i+1]==EMPTY_VALUE) doji[i]=Close[i];
       //(Open[i]+Close[i])/2+.000042;
       if(High[i]-Close[i]<=MaxLengthOfUpTail1*pt && Close[i]-Low[i]>=MinLengthOfLoTail1*pt  && MathAbs(Close[i]-Open[i])<=MaxLengthOfBody1*pt && doji[i+1]==EMPTY_VALUE)  doji[i]=Close[i];
       //doji[i]=(Open[i]+Close[i])/2+.000042;
       if(High[i]-Close[i]>=MinLengthOfUpTail2*pt && Close[i]-Low[i]<=MaxLengthOfLoTail2*pt  && MathAbs(Close[i]-Open[i])<=MaxLengthOfBody2*pt && doji[i+1]==EMPTY_VALUE) doji[i]= doji[i]=Close[i];
       }

       //(Open[i]+Close[i])/2+.000042;
           doji2[i]=doji[i];
           ///reds
           if (RSI2[i]<12.5 && RSI2[i]>2.4) dojir[i]=doji[i];
           if (RSI2[i]>97 && RSI2[i+2]>90 && Close[i]>iMA(NULL,0,44,0,MODE_EMA, PRICE_MEDIAN,i) && Close[i]<iMA(NULL,0,8,0,MODE_EMA, PRICE_OPEN,i)) dojir[i]=doji[i];
           ///greens
           if (RSI2[i]>2.5 && RSI2[i+1]<4.5 && dojir[i+2]==EMPTY_VALUE) dojig[i]=doji[i];
           if (RSI2[i]<94 && RSI2[i]>90 && RSI2[i+3]>14 && RSI2[i+4]>16) dojig[i]=doji[i];

           //blue


           if (High[i]>iMA(NULL,0,44,0,MODE_EMA, PRICE_MEDIAN,i)&& Open[i]<iMA(NULL,0,44,0,MODE_EMA, PRICE_MEDIAN,i) && Close[i]<iMA(NULL,0,44,0,MODE_EMA, PRICE_MEDIAN,i)
           && iMA(NULL,0,8,0,MODE_EMA, PRICE_OPEN,i+1)-Low[i+1]<250*Point
           && RSI2[i]>22
           && doji[i]==EMPTY_VALUE
           && !(doji[i+1]!=EMPTY_VALUE && dojig[i+1]==EMPTY_VALUE)
           && dojig[i+1]==EMPTY_VALUE
           )
           {dojib[i]=High[i]+80*Point;
                if(i<80){
           j=i-1;
      while (j>0){
         if (High[j]>High[i]+80*Point) break;
         j--;
      }
        if (j<0) j=0;

             }
         if (j>0){
            ObjectCreate("Bacardi"+IntegerToString(i), OBJ_RECTANGLE, 0,  Time[i], High[i]+80*Point, Time[j], High[i]+85*Point);
          ObjectSetInteger(0,"Bacardi"+IntegerToString(i),OBJPROP_COLOR,clrGreen);
          ObjectSet("Bacardi"+IntegerToString(i),OBJPROP_BACK,1);
          ObjectSet("Bacardi"+IntegerToString(i),OBJPROP_WIDTH,3);
             ObjectCreate("Bacardix"+DoubleToStr(j), OBJ_TEXT, 0, Time[j+8], High[i]+180*Point);
          ObjectSetText("Bacardix"+DoubleToStr(j), "Initiate Long @"+DoubleToStr(NormalizeDouble(High[i]+80*Point,4),4), 13, "Impact", Green);

         }


           }

              if (i>0 && Low[i]<iMA(NULL,0,44,0,MODE_EMA, PRICE_MEDIAN,i) && Open[i]>iMA(NULL,0,44,0,MODE_EMA, PRICE_MEDIAN,i) && Close[i]>iMA(NULL,0,44,0,MODE_EMA, PRICE_MEDIAN,i)
              && Low[i-1]<iMA(NULL,0,8,0,MODE_EMA, PRICE_OPEN,i-1)
              && High[i+3]-iMA(NULL,0,8,0,MODE_EMA, PRICE_OPEN,i+3)<130*Point
              && High[i+2]-iMA(NULL,0,8,0,MODE_EMA, PRICE_OPEN,i+2)<130*Point
              && High[i+1]-iMA(NULL,0,8,0,MODE_EMA, PRICE_OPEN,i+1)<130*Point
              && RSI2[i]<87.5
              && RSI2[i]>2.5
              //&& MathAbs(iMA(NULL,0,44,0,MODE_EMA, PRICE_MEDIAN,i)-iMA(NULL,0,8,0,MODE_EMA, PRICE_OPEN,i)>30*Point)
              )
           {dojib[i]=Low[i]-80*Point;

                if(i<80){
           j=i-1;
      while (j>0){
         if (Low[j]<Low[i]-80*Point) break;
         j--;
      }
        if (j<0) j=0;

    }
         if (j>0){
         ObjectCreate("Bacardi"+IntegerToString(i), OBJ_RECTANGLE, 0,  Time[i], Low[i]-80*Point, Time[j], Low[i]-85*Point);
          ObjectSetInteger(0,"Bacardi"+IntegerToString(i),OBJPROP_COLOR,clrRed);
          ObjectSet("Bacardi"+IntegerToString(i),OBJPROP_BACK,1);
          ObjectSet("Bacardi"+IntegerToString(i),OBJPROP_WIDTH,3);
               ObjectCreate("Bacardix"+DoubleToStr(j), OBJ_TEXT, 0, Time[j+8], Low[i]-180*Point);
          ObjectSetText("Bacardix"+DoubleToStr(j), "Initiate Short @"+DoubleToStr(NormalizeDouble(Low[i]-80*Point,4),4), 13, "Impact", Crimson);

         }
       }

}

double fibecup=0;
double fibecdn=1000;

deletetxt1("Fibec");
i=1;
j=0;
while (i<lookback) {
  if (doji[i]!=EMPTY_VALUE){
      j++;
    if (Close[i]+160*Point>fibecup) fibecup=Close[i]+160*Point;
    if (Close[i]-160*Point<fibecdn) fibecdn=Close[i]-160*Point;
  }
  if (j>4) break;
  i++;
}

ObjectCreate( "Fibeca", OBJ_TREND, 0, Time[1], fibecup, Time[0], fibecup );
ObjectSet("Fibeca", OBJPROP_COLOR, clrDimGray );
ObjectSet("Fibeca", OBJPROP_WIDTH, 2 );
ObjectSet("Fibeca", OBJPROP_STYLE, 2 );

ObjectCreate( "Fibecb", OBJ_TREND, 0, Time[1], fibecdn, Time[0], fibecdn  );
ObjectSet("Fibecb", OBJPROP_COLOR, clrDimGray );
ObjectSet("Fibecb", OBJPROP_WIDTH, 2 );
ObjectSet("Fibecb", OBJPROP_STYLE, 2 );

ObjectCreate("Fibec8", OBJ_TEXT, 0, Time[0], fibecup+65*Point);
      ObjectSetText("Fibec8", "                      "+DoubleToStr(NormalizeDouble(fibecup,4),4)+"-6Res.", 11, "Arial Black", Maroon);
       ObjectCreate("Fibec7", OBJ_TEXT, 0, Time[0], fibecdn-25*Point);
      ObjectSetText("Fibec7", "                      "+DoubleToStr(NormalizeDouble(fibecdn,4),4)+"-6Sup.", 11, "Arial Black", Teal);


double libecup=0;
double libecdn=1000;

deletetxt1("Libec");
i=1;
j=0;
while (i<lookback) {
  if (doji[i]!=EMPTY_VALUE){
      j++;
    if (Close[i]+100*Point>libecup) libecup=Close[i]+100*Point;
    if (Close[i]-100*Point<libecdn) libecdn=Close[i]-100*Point;
  }
  if (j>3) break;
  i++;
}

ObjectCreate( "Libeca", OBJ_TREND, 0, Time[1], libecup, Time[0], libecup );
ObjectSet("Libeca", OBJPROP_COLOR, clrDimGray );
ObjectSet("Libeca", OBJPROP_WIDTH, 2 );
ObjectSet("Libeca", OBJPROP_STYLE, 3 );

ObjectCreate( "Libecb", OBJ_TREND, 0, Time[1], libecdn, Time[0], libecdn );
ObjectSet("Libecb", OBJPROP_COLOR, clrDimGray );
ObjectSet("Libecb", OBJPROP_WIDTH, 2 );
ObjectSet("Libecb", OBJPROP_STYLE, 3 );

//ObjectCreate("Libec8", OBJ_TEXT, 0, Time[0], libecup+65*Point);
//      ObjectSetText("Libec8", "                      "+DoubleToStr(NormalizeDouble(libecup,4),4)+"-3Res.", 11, "Arial Black", Maroon);
//      ObjectCreate("Libec7", OBJ_TEXT, 0, Time[0], libecdn-25*Point);
//      ObjectSetText("Libec7", "                      "+DoubleToStr(NormalizeDouble(libecdn,4),4)+"-3Sup.", 11, "Arial Black", Teal);

// ObjectCreate("Libec16", OBJ_TEXT, 1, Time[0], 75);
//      ObjectSetText("Libec16", "                      VOL", 11, "Arial Black", DarkViolet);


// ObjectCreate("Libec6", OBJ_TEXT, 1, Time[0], 65);
//     ObjectSetText("Libec6", "                      0M / MMM", 11, "Arial Black", DarkViolet);

//  ObjectCreate("Libec5", OBJ_TEXT, 1, Time[0], 55);
//     ObjectSetText("Libec5", "                      ABC / SSS", 11, "Arial Black", DarkViolet);


//  ObjectCreate("Libec3", OBJ_TEXT, 1, Time[0], 45);
//     ObjectSetText("Libec3", "                      DEEP M EVAL", 11, "Arial Black", DarkViolet);


// ObjectCreate("Libec2", OBJ_TEXT, 1, Time[0], 35);
//     ObjectSetText("Libec2", "                      9PM CLOSE", 11, "Arial Black", DarkViolet);

// ObjectCreate("Libec4", OBJ_TEXT, 2, Time[0], 65);
//     ObjectSetText("Libec4", "                            #6 For M (25pips)", 11, "Arial Black", Blue);


// ObjectCreate("Libec1", OBJ_TEXT, 2, Time[0], 45);
//       ObjectSetText("Libec1", "                          PARA REVR>E44", 11, "Arial Black", Navy);
// if ((High[5]<iMA(NULL,0,8,0,MODE_EMA, PRICE_OPEN,5) && High[4]<iMA(NULL,0,8,0,MODE_EMA, PRICE_OPEN,4) && High[3]<iMA(NULL,0,8,0,MODE_EMA, PRICE_OPEN,3) && High[2]<iMA(NULL,0,8,0,MODE_EMA, PRICE_OPEN,2) && High[1]<iMA(NULL,0,8,0,MODE_EMA, PRICE_OPEN,1) && High[0]<iMA(NULL,0,8,0,MODE_EMA, PRICE_OPEN,0)) ||
//      (Low[5]>iMA(NULL,0,8,0,MODE_EMA, PRICE_OPEN,5) && Low[4]>iMA(NULL,0,8,0,MODE_EMA, PRICE_OPEN,4) && Low[3]>iMA(NULL,0,8,0,MODE_EMA, PRICE_OPEN,3) && Low[2]>iMA(NULL,0,8,0,MODE_EMA, PRICE_OPEN,2) && Low[1]>iMA(NULL,0,8,0,MODE_EMA, PRICE_OPEN,1) && Low[0]>iMA(NULL,0,8,0,MODE_EMA, PRICE_OPEN,0))
//   && MathAbs(Close[0]-iMA(NULL,0,8,0,MODE_EMA, PRICE_OPEN,0))>180*Point)
//   ObjectSetText("Libec1", "                          PARA REVR>E44", 16, "Arial Black", Magenta);

// if (High[0]>iMA(NULL,0,8,0,MODE_EMA, PRICE_OPEN,0) && Low[0]<iMA(NULL,0,8,0,MODE_EMA, PRICE_OPEN,0)) deletetxt1("PARALINE");


///parabolic reversal back up
if (Low[5]>iMA(NULL,0,8,0,MODE_EMA, PRICE_OPEN,5) && Low[4]>iMA(NULL,0,8,0,MODE_EMA, PRICE_OPEN,4) && Low[3]>iMA(NULL,0,8,0,MODE_EMA, PRICE_OPEN,3) && Low[2]>iMA(NULL,0,8,0,MODE_EMA, PRICE_OPEN,2) && Low[1]>iMA(NULL,0,8,0,MODE_EMA, PRICE_OPEN,1) && Low[0]>iMA(NULL,0,8,0,MODE_EMA, PRICE_OPEN,0)
   && MathAbs(Close[0]-iMA(NULL,0,8,0,MODE_EMA, PRICE_OPEN,0))>180*Point && High[1]-Close[1]>38*Point && High[1]-Open[1]>38*Point
   && Close[0]<iMA(NULL,0,44,0,MODE_EMA, PRICE_MEDIAN,0)
   ){

ObjectCreate(0,"PARALINE",OBJ_TREND,0,Time[1],High[1],Time[0],High[1]);
                          ObjectSetInteger(0,"PARALINE",OBJPROP_RAY_RIGHT,true);
                          ObjectSet("PARALINE",OBJPROP_COLOR,Black);
                          ObjectSet("PARALINE",OBJPROP_WIDTH, 3);

                          ObjectCreate("PARALINE2", OBJ_TEXT, 0, Time[0], High[1]);
      ObjectSetText("PARALINE2", "                      "+DoubleToStr(NormalizeDouble(High[1],4),4)+"->"+DoubleToStr(NormalizeDouble(iMA(NULL,0,44,0,MODE_EMA, PRICE_MEDIAN,1),4),4), 11, "Arial Black", DarkGreen);
  }

///parabolic reversal back down
if (High[5]<iMA(NULL,0,8,0,MODE_EMA, PRICE_OPEN,5) && High[4]<iMA(NULL,0,8,0,MODE_EMA, PRICE_OPEN,4) && High[3]<iMA(NULL,0,8,0,MODE_EMA, PRICE_OPEN,3) && High[2]<iMA(NULL,0,8,0,MODE_EMA, PRICE_OPEN,2) && High[1]<iMA(NULL,0,8,0,MODE_EMA, PRICE_OPEN,1) && High[0]<iMA(NULL,0,8,0,MODE_EMA, PRICE_OPEN,0)
   && MathAbs(Close[0]-iMA(NULL,0,8,0,MODE_EMA, PRICE_OPEN,0))>180*Point && Close[1]-Low[1]>38*Point && Open[1]-Low[1]>38*Point
      && Close[0]>iMA(NULL,0,44,0,MODE_EMA, PRICE_MEDIAN,0)
   ){

ObjectCreate(0,"PARALINE",OBJ_TREND,0,Time[1],Low[1],Time[0],Low[1]);
                          ObjectSetInteger(0,"PARALINE",OBJPROP_RAY_RIGHT,true);
                          ObjectSet("PARALINE",OBJPROP_COLOR,Black);
                          ObjectSet("PARALINE",OBJPROP_WIDTH, 3);

                          ObjectCreate("PARALINE2", OBJ_TEXT, 0, Time[0], Low[1]);
      ObjectSetText("PARALINE2", "                      "+DoubleToStr(NormalizeDouble(Low[1],4),4)+"->"+DoubleToStr(NormalizeDouble(iMA(NULL,0,44,0,MODE_EMA, PRICE_MEDIAN,1),4),4), 11, "Arial Black", DarkGreen);
  }


ObjectCreate("Libec11", OBJ_TEXT, 2, Time[0], 85);
      ObjectSetText("Libec11", "                          PARA BRK>CONSM", 11, "Arial Black", Navy);


ObjectCreate("Libec12", OBJ_TEXT, 3, Time[0], 105);
      ObjectSetText("Libec12", "                             MSR, DVGNT", 11, "Arial Black", Crimson);

ObjectCreate("Libec0", OBJ_TEXT, 3, Time[0], 65);
      ObjectSetText("Libec0", "                            MUST>FDF/0M", 11, "Arial Black", Navy);
      ObjectCreate("Libec9", OBJ_TEXT, 3, Time[0], 45);
      ObjectSetText("Libec9", "                            MUST>E8/RES", 11, "Arial Black", Navy);
       ObjectCreate("Libec10", OBJ_TEXT, 3, Time[0], 85);
      ObjectSetText("Libec10", "                          E44 PROMO", 11, "Arial Black", Navy);

double kibecup=0;
double kibecdn=1000;

deletetxt1("Kibec");
i=1;
j=0;
while (i<lookback) {
  if (doji[i]!=EMPTY_VALUE){
      j++;
    if (Close[i]+100*Point>kibecup) kibecup=Close[i]+80*Point;
    if (Close[i]-100*Point<kibecdn) kibecdn=Close[i]-80*Point;
  }
  if (j>1) break;
  i++;
}

ObjectCreate( "Kibeca", OBJ_TREND, 0, Time[1], kibecup, Time[0], kibecup );
ObjectSet("Kibeca", OBJPROP_COLOR, clrDimGray );
ObjectSet("Kibeca", OBJPROP_WIDTH, 2 );
ObjectSet("Kibeca", OBJPROP_STYLE, 4 );

ObjectCreate( "Kibecb", OBJ_TREND, 0, Time[1], kibecdn, Time[0], kibecdn  );
ObjectSet("Kibecb", OBJPROP_COLOR, clrDimGray );
ObjectSet("Kibecb", OBJPROP_WIDTH, 2 );
ObjectSet("Kibecb", OBJPROP_STYLE, 3 );

ObjectCreate("Kibec8", OBJ_TEXT, 0, Time[0], kibecup+65*Point);
      ObjectSetText("Kibec8", "                      "+DoubleToStr(NormalizeDouble(kibecup,4),4)+"-2Res.", 11, "Arial Black", Maroon);
       ObjectCreate("Kibec7", OBJ_TEXT, 0, Time[0], kibecdn-25*Point);
      ObjectSetText("Kibec7", "                      "+DoubleToStr(NormalizeDouble(kibecdn,4),4)+"-2Sup.", 11, "Arial Black", Teal);


deletetxt1("Ricky");


  for (i=lookback-1; i>=0; i--){


  ///exit dojis
  if (Period()!=1440 && RSI2[ArrayMinimum(RSI2,9,i)]<2.5 && doji[i]!=EMPTY_VALUE && RSI2[i]>10) exit[i]=doji[i];
  if (Period()!=1440 && RSI2[ArrayMaximum(RSI2,9,i)]>97.5 && doji[i]!=EMPTY_VALUE && RSI2[i]<90 && High[i]>High[i+1]) exit[i]=doji[i];

  ///downside fractal highlight
  if (i>2 && iFractals(symbol,0,MODE_LOWER,i) && iMA(NULL,0,44,0,MODE_EMA, PRICE_MEDIAN,i)-Low[i]>220*Point && iMA(NULL,0,44,0,MODE_EMA, PRICE_MEDIAN,i)-Low[i]<1000*Point && iMA(NULL,0,8,0,MODE_EMA, PRICE_OPEN,i)-Low[i]>110*Point && High[i]<iMA(NULL,0,44,0,MODE_EMA, PRICE_MEDIAN,i) ) {ED[i]=Low[i]-40*Point;

   if (ED[i+1]==EMPTY_VALUE && ED[i+2]==EMPTY_VALUE && ED[i+3]==EMPTY_VALUE && ED[i+4]==EMPTY_VALUE && ED[i+5]==EMPTY_VALUE && ED[i+6]==EMPTY_VALUE && ED[i+7]==EMPTY_VALUE && ED[i+8]==EMPTY_VALUE && ED[i+9]==EMPTY_VALUE && ED[i+10]==EMPTY_VALUE &&
        ED[i+11]==EMPTY_VALUE && ED[i+12]==EMPTY_VALUE && ED[i+13]==EMPTY_VALUE && ED[i+14]==EMPTY_VALUE && ED[i+15]==EMPTY_VALUE && ED[i+16]==EMPTY_VALUE && ED[i+17]==EMPTY_VALUE && ED[i+18]==EMPTY_VALUE && ED[i+19]==EMPTY_VALUE && ED[i+20]==EMPTY_VALUE &&
        ED[i+21]==EMPTY_VALUE && ED[i+22]==EMPTY_VALUE && ED[i+23]==EMPTY_VALUE && ED[i+24]==EMPTY_VALUE && ED[i+25]==EMPTY_VALUE){
            ObjectCreate("Bacardiy"+DoubleToStr(i), OBJ_TEXT, 0, Time[i+3], Low[i]-30*Point);
          ObjectSetText("Bacardiy"+DoubleToStr(i), "Cover @"+DoubleToStr(NormalizeDouble(Low[i],4),4), 13, "Impact", Green);
           ObjectCreate("Bacardiyy"+DoubleToStr(i), OBJ_TEXT, 0, Time[i+3], Low[i]-130*Point);
          ObjectSetText("Bacardiyy"+DoubleToStr(i), "Buy @"+DoubleToStr(NormalizeDouble(Low[i]-100*Point,4),4), 13, "Impact", DodgerBlue);
         ED2[i]=Low[i]-45*Point;
       }
  }
  ///upnside fractal highlight
  if (i>2 && iFractals(symbol,0,MODE_UPPER,i) && High[i]-iMA(NULL,0,44,0,MODE_EMA, PRICE_MEDIAN,i)>220*Point && High[i]-iMA(NULL,0,44,0,MODE_EMA, PRICE_MEDIAN,i)<1000*Point  && High[i]-iMA(NULL,0,8,0,MODE_EMA, PRICE_OPEN,i)>110*Point && Low[i]>iMA(NULL,0,44,0,MODE_EMA, PRICE_MEDIAN,i)) {EU[i]=High[i]+40*Point;
   if (EU[i+1]==EMPTY_VALUE && EU[i+2]==EMPTY_VALUE && EU[i+3]==EMPTY_VALUE && EU[i+4]==EMPTY_VALUE && EU[i+5]==EMPTY_VALUE && EU[i+6]==EMPTY_VALUE && EU[i+7]==EMPTY_VALUE && EU[i+8]==EMPTY_VALUE && EU[i+9]==EMPTY_VALUE && EU[i+10]==EMPTY_VALUE &&
        EU[i+11]==EMPTY_VALUE && EU[i+12]==EMPTY_VALUE && EU[i+13]==EMPTY_VALUE && EU[i+14]==EMPTY_VALUE && EU[i+15]==EMPTY_VALUE && EU[i+16]==EMPTY_VALUE && EU[i+17]==EMPTY_VALUE && EU[i+18]==EMPTY_VALUE && EU[i+19]==EMPTY_VALUE && EU[i+20]==EMPTY_VALUE &&
        EU[i+21]==EMPTY_VALUE && EU[i+22]==EMPTY_VALUE && EU[i+23]==EMPTY_VALUE && EU[i+24]==EMPTY_VALUE && EU[i+25]==EMPTY_VALUE){
            ObjectCreate("Bacardiy"+DoubleToStr(i), OBJ_TEXT, 0, Time[i+3], High[i]+80*Point);
          ObjectSetText("Bacardiy"+DoubleToStr(i), "Cover @"+DoubleToStr(NormalizeDouble(High[i],4),4), 13, "Impact", Purple);
           ObjectCreate("Bacardiyy"+DoubleToStr(i), OBJ_TEXT, 0, Time[i+3], High[i]+180*Point);
          ObjectSetText("Bacardiyy"+DoubleToStr(i), "Sell @"+DoubleToStr(NormalizeDouble(High[i]+100*Point,4),4), 13, "Impact", DodgerBlue);
         EU2[i]=High[i]+45*Point;
       }

  }

  ///must go short on red doji if no downside fractals in the prior 7 candles & below E-44 && E-44 declining
    if (dojir[i]!=EMPTY_VALUE && !iFractals(symbol,0,MODE_LOWER,i+1)&& !iFractals(symbol,0,MODE_LOWER,i+2) && !iFractals(symbol,0,MODE_LOWER,i+3)&& !iFractals(symbol,0,MODE_LOWER,i+4)&& !iFractals(symbol,0,MODE_LOWER,i+5)&& !iFractals(symbol,0,MODE_LOWER,i+6)&& !iFractals(symbol,0,MODE_LOWER,i+7)
   && Close[i]<iMA(NULL,0,44,0,MODE_EMA, PRICE_MEDIAN,i)
   &&  iMA(NULL,0,44,0,MODE_EMA, PRICE_MEDIAN,i)<iMA(NULL,0,44,0,MODE_EMA, PRICE_MEDIAN,i+6)
  ){

       ObjectCreate("Rickyt"+IntegerToString(i),OBJ_VLINE,0, Time[i], 0);
         ObjectSet("Rickyt"+IntegerToString(i),OBJPROP_COLOR,clrRed );
            ObjectSet("Rickyt"+IntegerToString(i),OBJPROP_WIDTH,6);
            ObjectSet("Rickyt"+IntegerToString(i),OBJPROP_STYLE,STYLE_DOT);
          ObjectSet("Rickyt"+IntegerToString(i),OBJPROP_BACK,1);
  }

  ///must go short on red doji if price is below 8EMA & above E-44
    if (dojir[i]!=EMPTY_VALUE && Close[i]>iMA(NULL,0,44,0,MODE_EMA, PRICE_MEDIAN,i) && Close[i]<iMA(NULL,0,8,0,MODE_EMA, PRICE_OPEN,i)

  ){

       ObjectCreate("Rickyt"+IntegerToString(i),OBJ_VLINE,0, Time[i], 0);
         ObjectSet("Rickyt"+IntegerToString(i),OBJPROP_COLOR,clrRed );
            ObjectSet("Rickyt"+IntegerToString(i),OBJPROP_WIDTH,6);
            ObjectSet("Rickyt"+IntegerToString(i),OBJPROP_STYLE,STYLE_DOT);
          ObjectSet("Rickyt"+IntegerToString(i),OBJPROP_BACK,1);
  }

  //low close doji

   if ((doji[i+1]!=EMPTY_VALUE  && Close[i]<=Open[i]) || dojir[i]!=EMPTY_VALUE   )
   {
          ObjectCreate("Ricky"+IntegerToString(i),OBJ_VLINE,1, Time[i], 0);
         ObjectSet("Ricky"+IntegerToString(i),OBJPROP_COLOR,clrRed );
            ObjectSet("Ricky"+IntegerToString(i),OBJPROP_WIDTH,4);
            ObjectSet("Ricky"+IntegerToString(i),OBJPROP_STYLE,STYLE_DOT);
          ObjectSet("Ricky"+IntegerToString(i),OBJPROP_BACK,1);

    if(i<40){
           j=i-1;
      while (j>0){
         if (Close[j]<Close[i+1]-100*Point) break;
         j--;
      }
        if (j<0) j=0;
            ObjectCreate("Bacardis"+IntegerToString(i), OBJ_RECTANGLE, 0,  Time[i+1], Close[i+1]-90*Point, Time[j], Close[i+1]-100*Point);
          if (j!=0) ObjectSetInteger(0,"Bacardis"+IntegerToString(i),OBJPROP_COLOR,clrRed);
          else ObjectSetInteger(0,"Bacardis"+IntegerToString(i),OBJPROP_COLOR,clrBlue);
          ObjectSet("Bacardis"+IntegerToString(i),OBJPROP_BACK,1);
          ObjectSet("Bacardis"+IntegerToString(i),OBJPROP_WIDTH,3);
    }
   }

   ///high close doji
   if ((doji[i+1]!=EMPTY_VALUE && dojir[i+1]==EMPTY_VALUE && Close[i]>Open[i]) || dojig[i]!=EMPTY_VALUE)
   {
          ObjectCreate("Ricky"+IntegerToString(i),OBJ_VLINE,1, Time[i], 0);
         ObjectSet("Ricky"+IntegerToString(i),OBJPROP_COLOR,clrGreen );
            ObjectSet("Ricky"+IntegerToString(i),OBJPROP_WIDTH,4);
            ObjectSet("Ricky"+IntegerToString(i),OBJPROP_STYLE,STYLE_DOT);
          ObjectSet("Ricky"+IntegerToString(i),OBJPROP_BACK,1);


          if(i<40){
           j=i-1;
      while (j>0){
         if (Close[j]>Close[i+1]+100*Point) break;
         j--;
      }
        if (j<0) j=0;
            ObjectCreate("Bacardis"+IntegerToString(i), OBJ_RECTANGLE, 0,  Time[i+1], Close[i+1]+90*Point, Time[j], Close[i+1]+100*Point);
          if (j!=0) ObjectSetInteger(0,"Bacardis"+IntegerToString(i),OBJPROP_COLOR,clrGreen);
          else ObjectSetInteger(0,"Bacardis"+IntegerToString(i),OBJPROP_COLOR,clrBlue);
          ObjectSet("Bacardis"+IntegerToString(i),OBJPROP_BACK,1);
          ObjectSet("Bacardis"+IntegerToString(i),OBJPROP_WIDTH,3);
    }


   }


   ///////////////Wyckoff doji demand dry up
   if (i>0 && High[i-1]<High[i] && doji[i]!=EMPTY_VALUE && iHigh(symbol,0,iHighest(symbol,0,MODE_HIGH,1,i))==iHigh(symbol,0,iHighest(symbol,0,MODE_HIGH,5,i)) && Volume[i]<Volume[i+1] && Volume[i]<Volume[i+2] && Volume[i]<Volume[i+3]){

         ObjectCreate("Rickyt"+IntegerToString(i),OBJ_VLINE,0, Time[i], 0);
         ObjectSet("Rickyt"+IntegerToString(i),OBJPROP_COLOR,clrPurple );
         if (Close[i]<iMA(symbol,0,8,0,MODE_EMA, PRICE_OPEN,i)) ObjectSet("Rickyt"+IntegerToString(i),OBJPROP_WIDTH,10);
            else ObjectSet("Rickyt"+IntegerToString(i),OBJPROP_WIDTH,5);
            ObjectSet("Rickyt"+IntegerToString(i),OBJPROP_STYLE,STYLE_DOT);
          ObjectSet("Rickyt"+IntegerToString(i),OBJPROP_BACK,1);
   }

   ///////////////Wyckoff doji supply dry up
   if (i>0 && Low[i-1]>Low[i] && doji[i]!=EMPTY_VALUE && iLow(symbol,0,iLowest(symbol,0,MODE_LOW,1,i))==iLow(symbol,0,iLowest(symbol,0,MODE_LOW,4,i)) && Volume[i]<Volume[i+1] && Volume[i]<Volume[i+2] && Volume[i]<Volume[i+3]  && Volume[i]<Volume[i+4]  && Volume[i]<Volume[i+5]){

         ObjectCreate("Rickyt"+IntegerToString(i),OBJ_VLINE,0, Time[i], 0);
         ObjectSet("Rickyt"+IntegerToString(i),OBJPROP_COLOR,clrYellowGreen );
            ObjectSet("Rickyt"+IntegerToString(i),OBJPROP_WIDTH,10);
            ObjectSet("Rickyt"+IntegerToString(i),OBJPROP_STYLE,STYLE_DOT);
          ObjectSet("Rickyt"+IntegerToString(i),OBJPROP_BACK,1);
   }

  if (Period()==1440){
   ///daily doji reversi up
   if (doji[i]!=EMPTY_VALUE && iLow(symbol,0,iLowest(symbol,0,MODE_LOW,2,i))==iLow(symbol,0,iLowest(symbol,0,MODE_LOW,4,i))
      && Close[i]-iLow(symbol,0,iLowest(symbol,0,MODE_LOW,2,i))>190*Point
      && (Volume[i]<Volume[i+1] || Volume[i+2]<Volume[i+4])

      && High[i+1]<High[i+2]

      ){
       ObjectCreate("Bacardit"+IntegerToString(i), OBJ_RECTANGLE, 0,  Time[i+3], Close[i+1]+50*Point, Time[i], iLow(symbol,0,iLowest(symbol,0,MODE_LOW,2,i))-200*Point);
          ObjectSetInteger(0,"Bacardit"+IntegerToString(i),OBJPROP_COLOR,clrChartreuse);
          ObjectSet("Bacardit"+IntegerToString(i),OBJPROP_BACK,1);
          ObjectSet("Bacardit"+IntegerToString(i),OBJPROP_WIDTH,3);
   }

    ///daily doji reversi dn
     if (doji[i]!=EMPTY_VALUE && iHigh(symbol,0,iHighest(symbol,0,MODE_HIGH,2,i))==iHigh(symbol,0,iHighest(symbol,0,MODE_HIGH,4,i))
      && iHigh(symbol,0,iHighest(symbol,0,MODE_HIGH,2,i))-Close[i]>190*Point
      && Volume[i]<Volume[i+1] && Low[i+1]>Low[i+2] && High[i]>High[i+1]-100*Point
      && iVolume(symbol,0,i+4)<iVolume(symbol,0,i+7)
        && iVolume(symbol,0,i+2)<iVolume(symbol,0,i+4)
      && iLow(symbol,0,iLowest(symbol,0,MODE_LOW,3,i))>iLow(symbol,0,iLowest(symbol,0,MODE_LOW,6,i))
      ){
       ObjectCreate("Bacardit"+IntegerToString(i), OBJ_RECTANGLE, 0,  Time[i+3], Close[i+1]-50*Point, Time[i], iHigh(symbol,0,iHighest(symbol,0,MODE_HIGH,2,i))+200*Point);
          ObjectSetInteger(0,"Bacardit"+IntegerToString(i),OBJPROP_COLOR,clrCrimson);
          ObjectSet("Bacardit"+IntegerToString(i),OBJPROP_BACK,1);
          ObjectSet("Bacardit"+IntegerToString(i),OBJPROP_WIDTH,3);
   }

   }

  }


  return(0);
}


   void deletetxt1(string text){
   for(int iObj=ObjectsTotal()-1; iObj >= 0; iObj--){
      string   on = ObjectName(iObj);
      if(StringFind(on, text) == 0)  ObjectDelete(on);
}  }
W3F+ without consolidation is cca 1.1243