Three Things

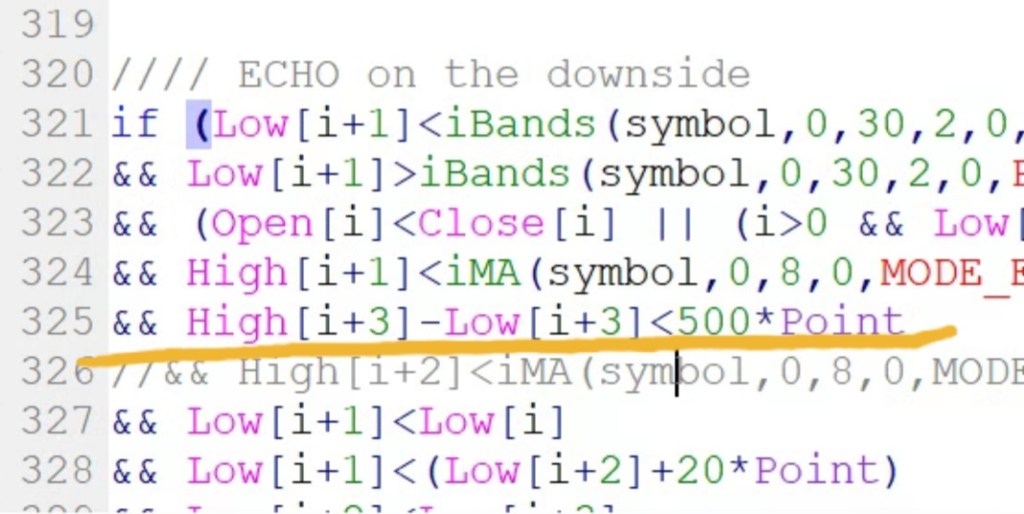
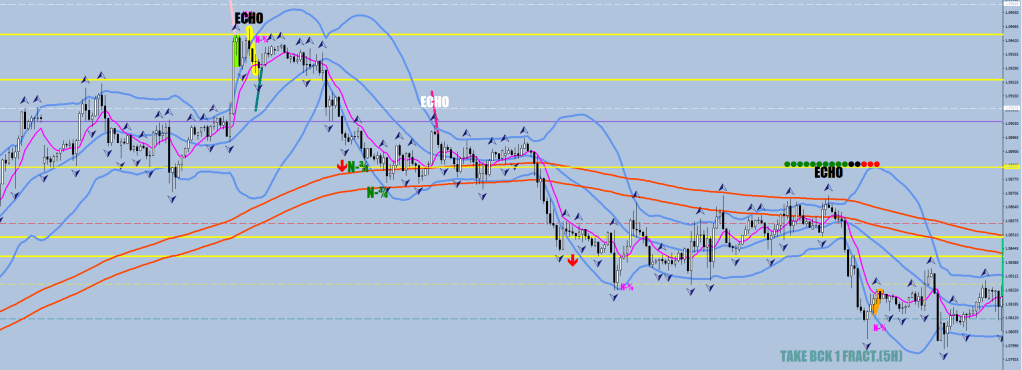
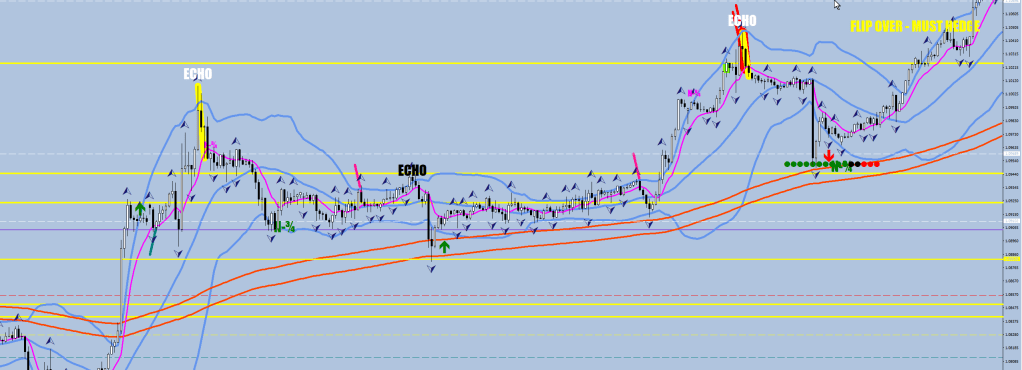
The first one is that one filter of the Echo is counterproductive, and thus should be eliminated.

The Low of the 2nd hour of selling does not have to be lower than the first hour’s.

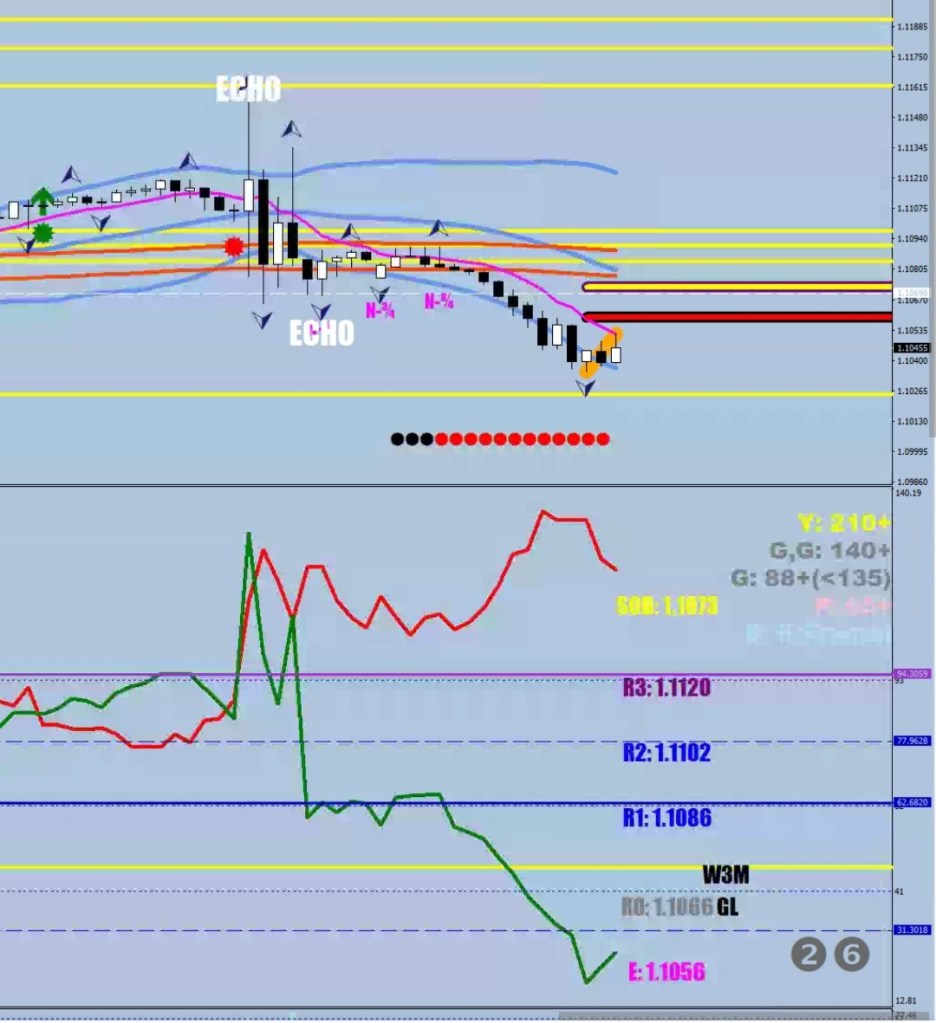
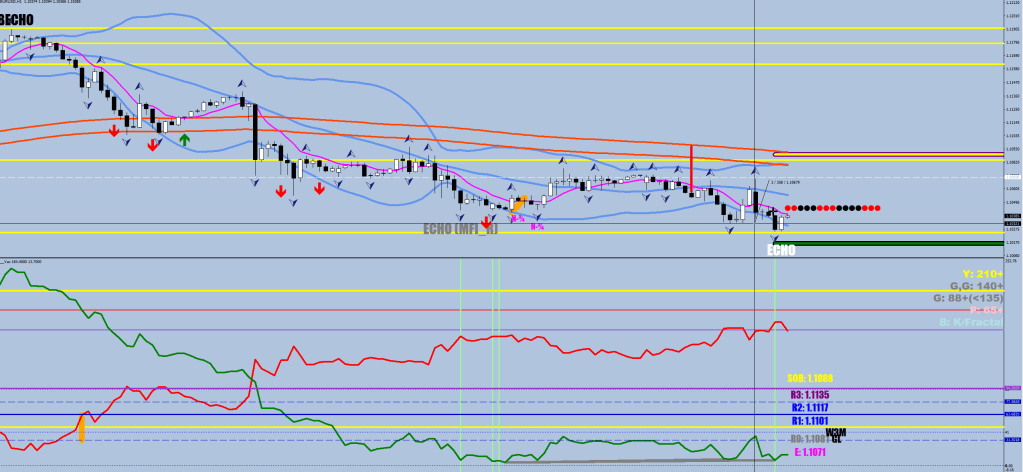
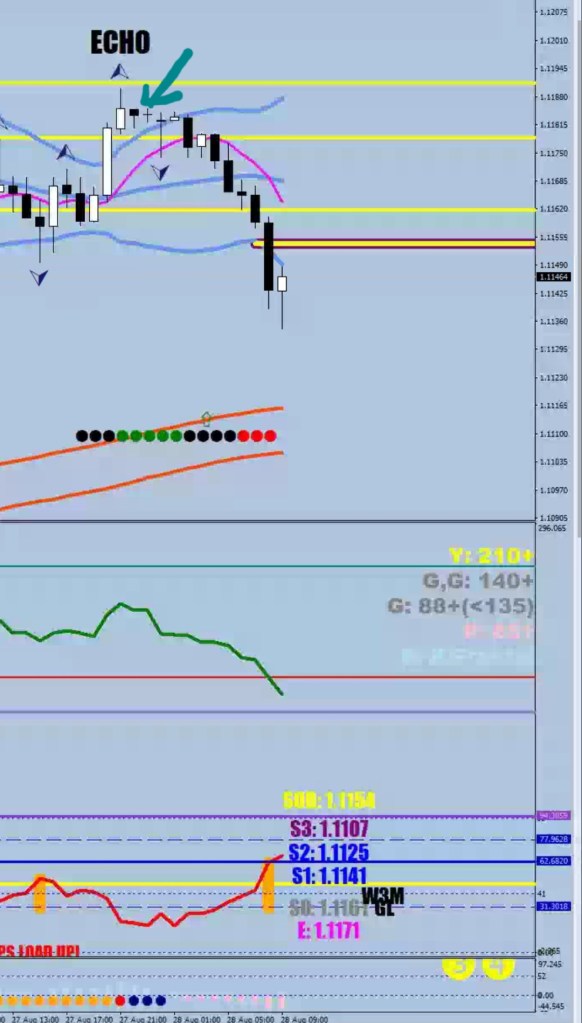
The Echo print is yellow at first, meaning pending – the next two candle prints can confirm it or eliminate it completely if the second hourly candle is to print a lower low stripping away the fractal status.

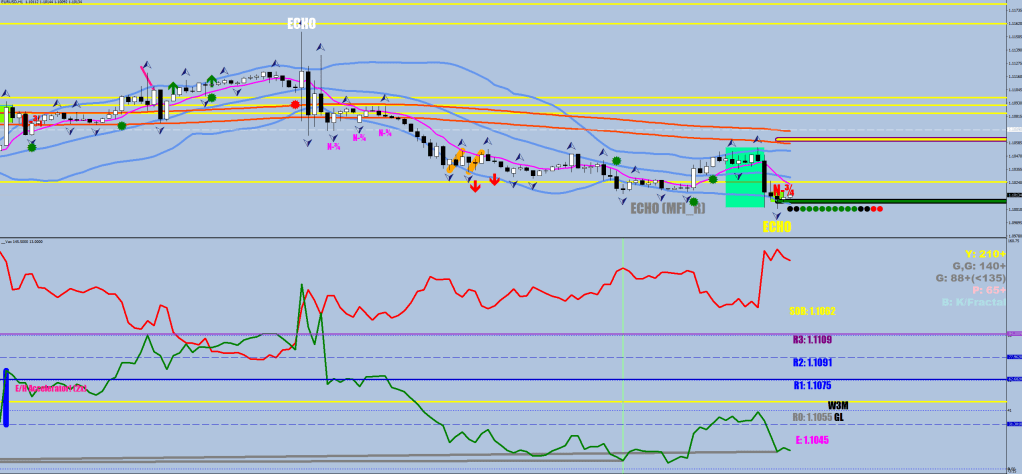
Counter to what everybody holds as a belief, that the market can do whatever it wants at any given moment, I am firmly in the camp that it can rarely do whatever it wants.

My proof is the volatility compression, which has different degrees.

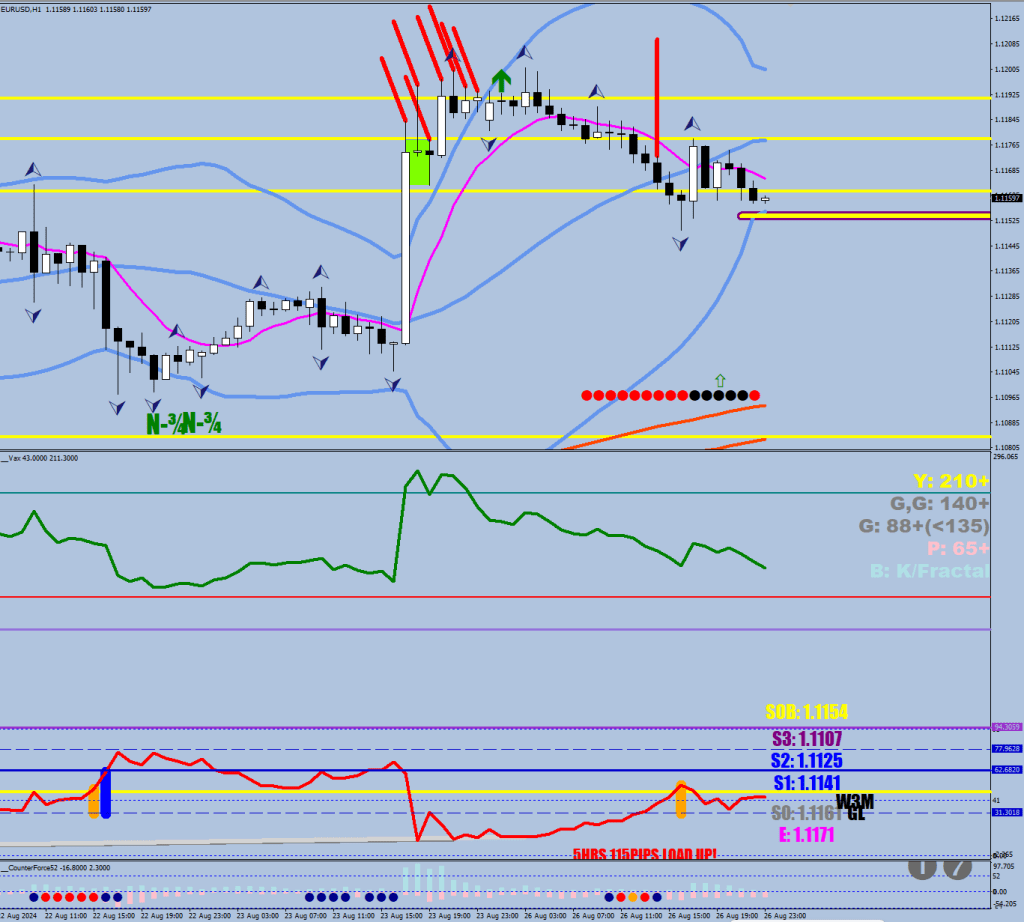
In the image below I made an Orange shaded field. This was an R minus 1 compression, the strongest there is. Meaning that they were shorting starting 20 pips out from the recent low not letting the market to reach the dashed line (I call it E). Who are they? Something that does not sleep. Programs. CTAs, bots algos, pick.

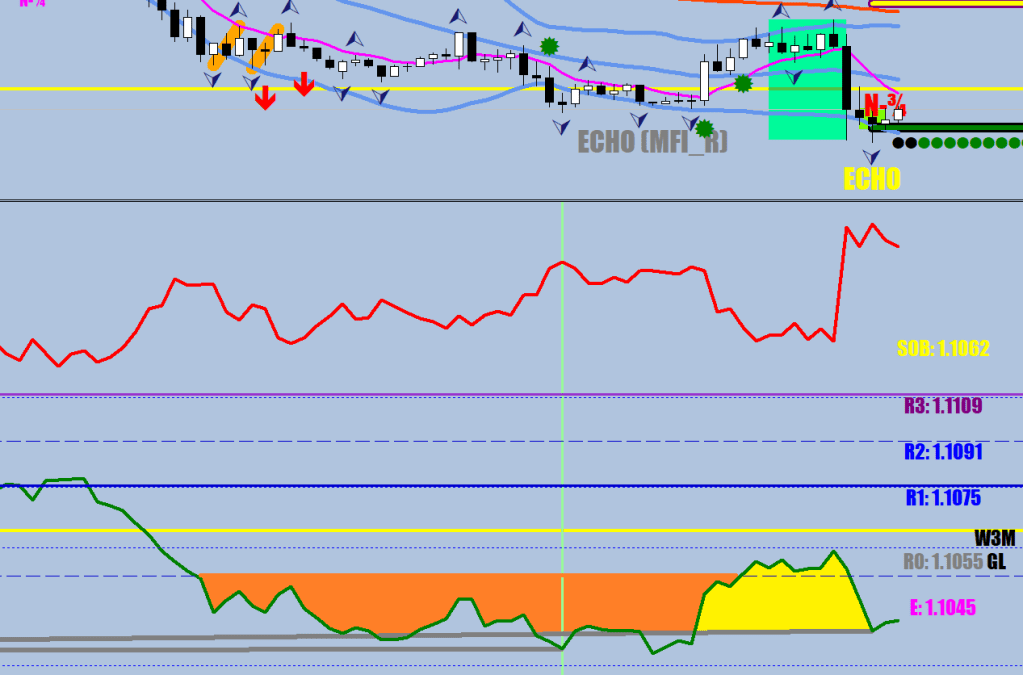
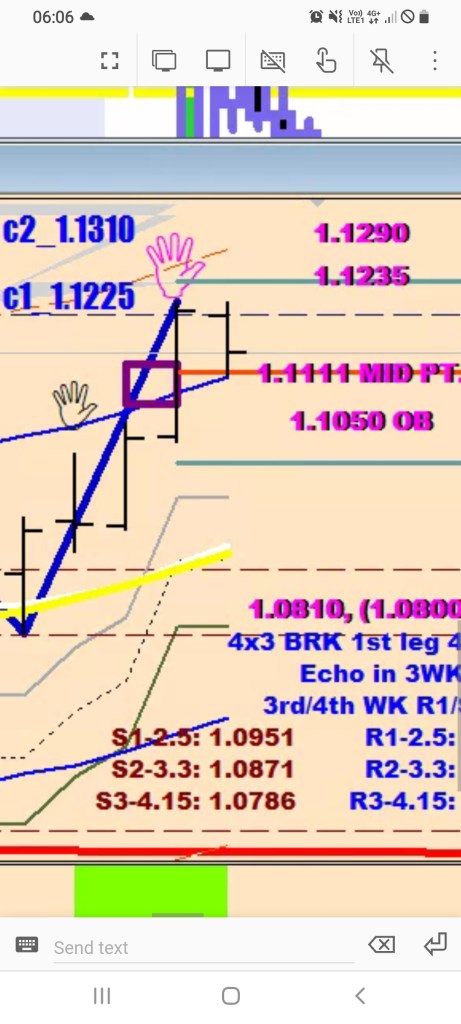
When you have 40 hours of R minus 1 compression, the Shot Over the Bow level is E. You can bet that with this strength of compression, the market cannot gap in the opposite direction.

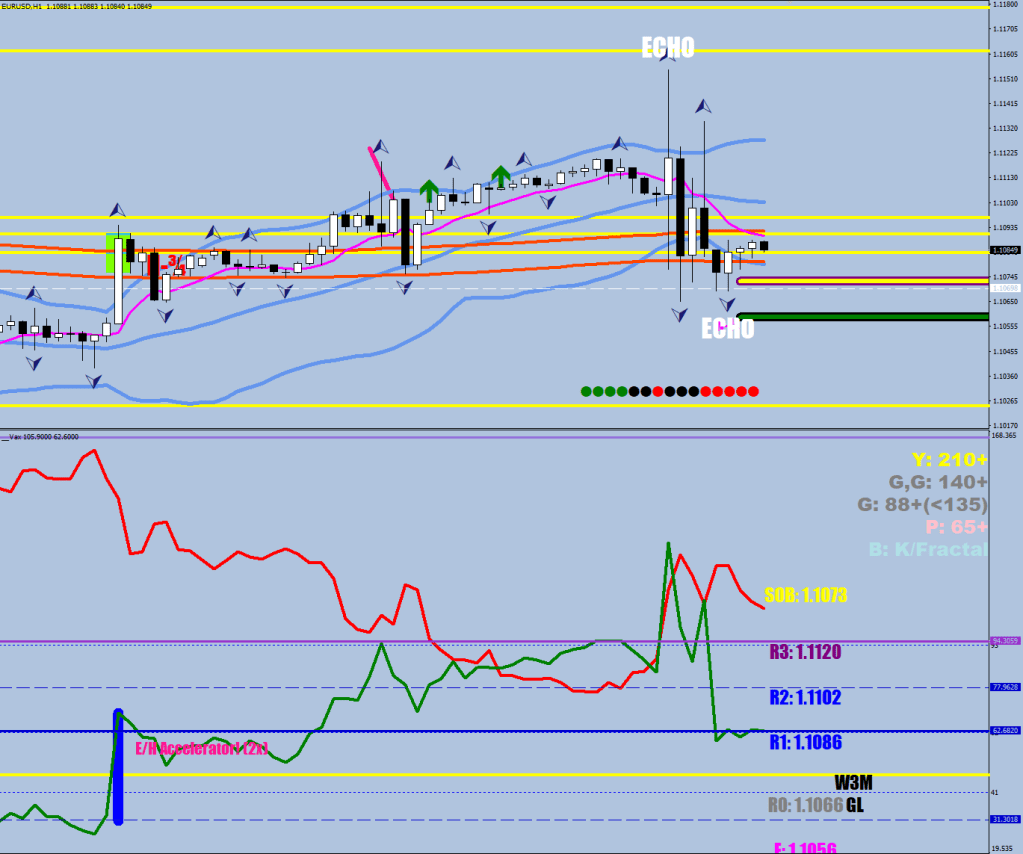
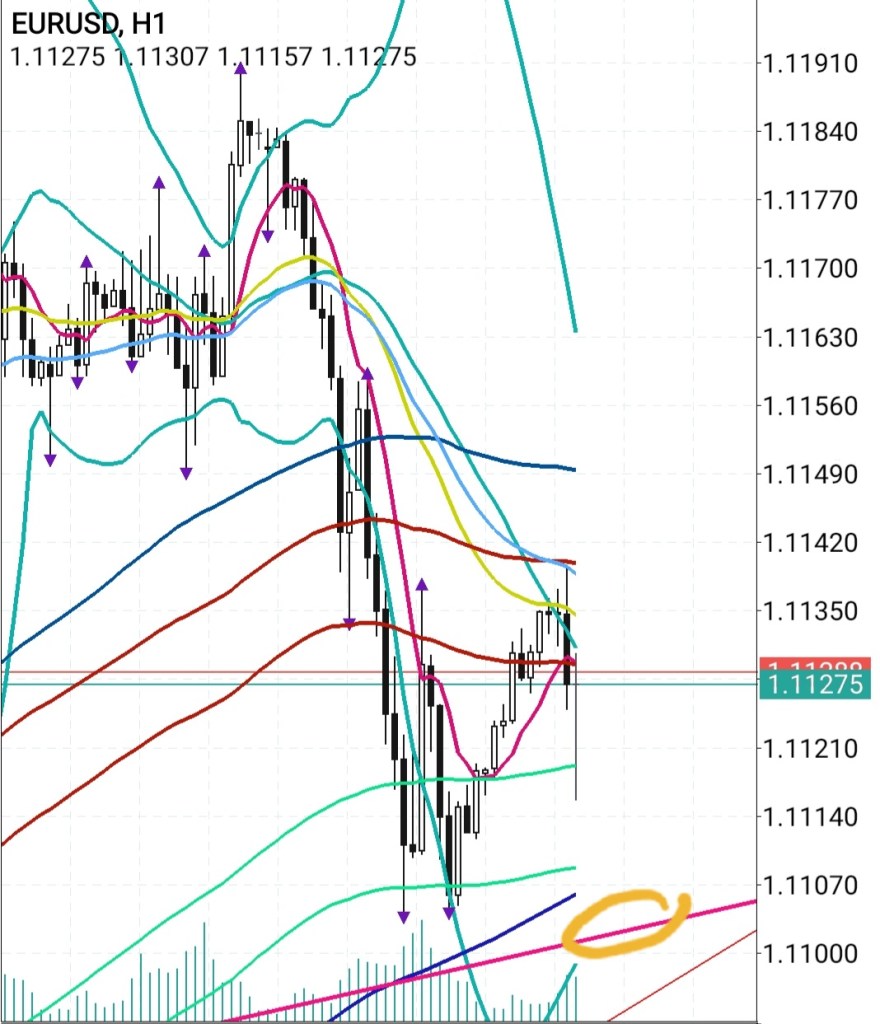
The last thing is paying attention to an hourly candle that exceeds 1 fluctuation maximum (here meaning 45 pips).

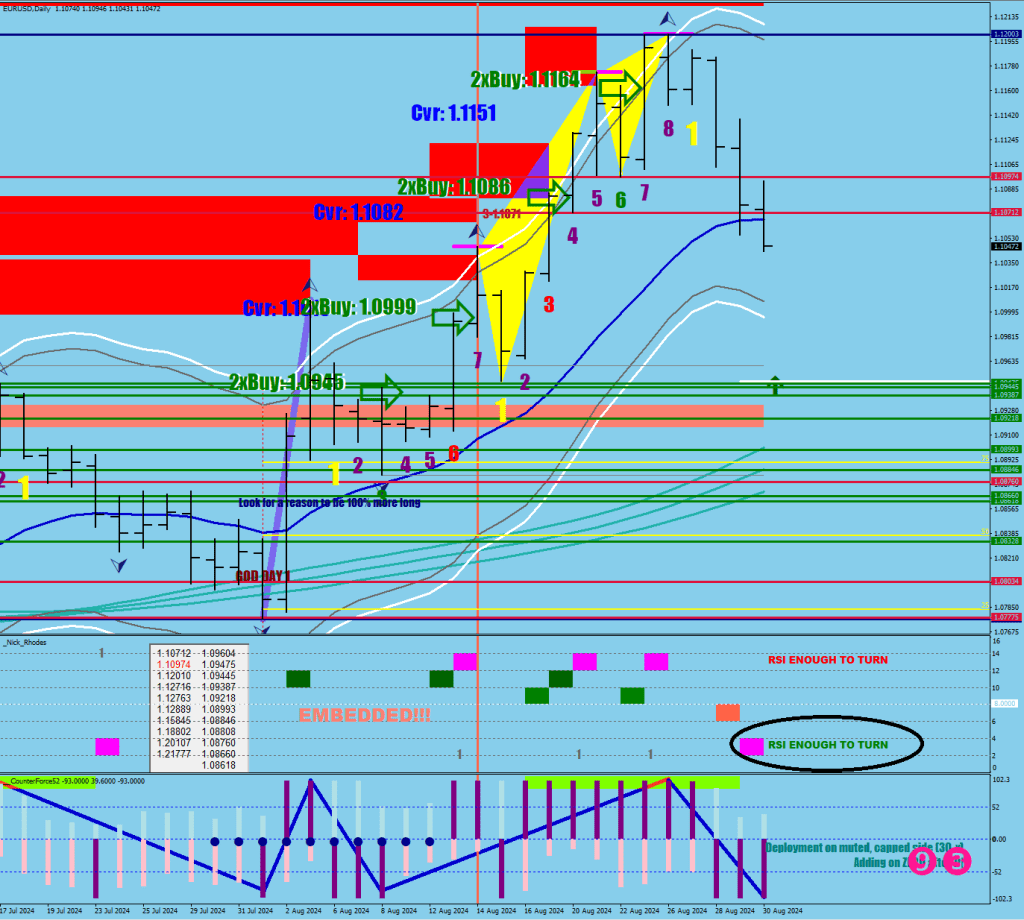
This size of free movement requires that the buy programs to be turned off.

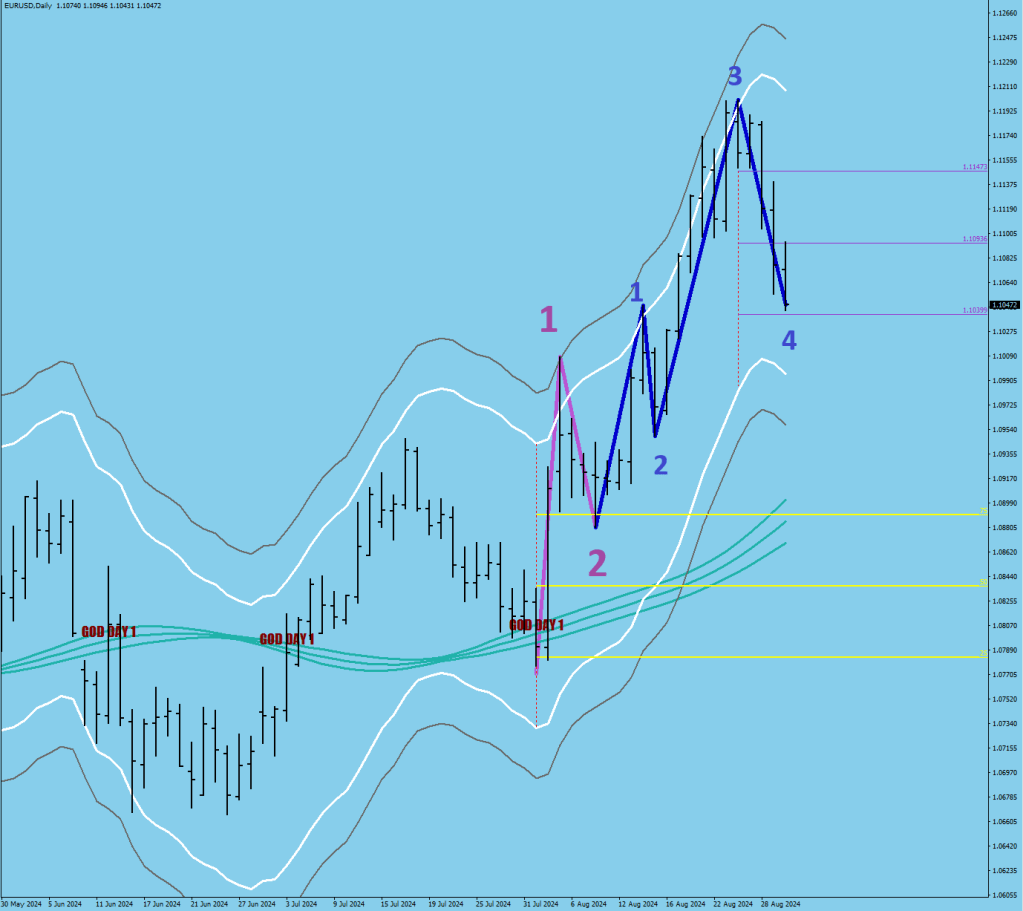
The last image shows 3 range candles. Their body becomes crucial. 3 consecutive closes outside are a confirmation of the new direction. The yellow arrows are where they turned the volatility compressor routines back on – this time on the opposite side.

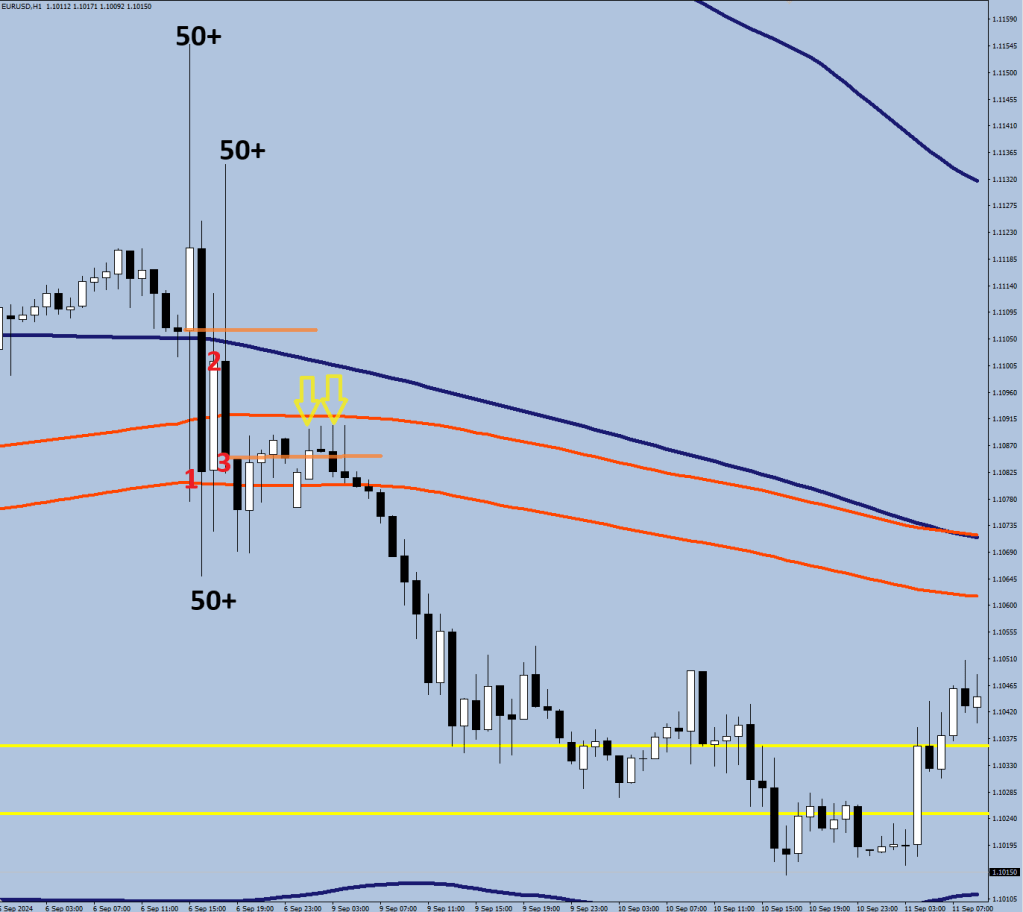
…confirmed in. The moratorium line pushed 10 pips down.

Curve Fitting

Curve fitting (here) is the abuse of filters. In general it is cherry picking data to prove a point.

This typically shows up when somebody wants to show better results on a re-run and would likely end up cutting a time period or even a full month out.

Curve fitting of course can become an issue with firward testing as well.

I had the ECHO prints have a perfect scoreboard for the last few months, but the last one was a dud. You can never be certain that you have all the necessary filters already in place.

You have to evaluate what was different on this occassion. Then comes the need experience when picking the right way of excluding this prompt.

For instance, the width of the Bollinger Bands could often help, but not here.

The two choices are: eliminate the fractal where the candle 2-hours prior spiked outside the upper BB or eliminate when the candle 2-hours prior had a range of 50+ pips. I went with the latter as the second case would happen way less often.

Zone To Fail

The dynamic zone to fail a direction is from 21 pips wide, it starts from inside the hourly 30 sample HL2 BB by 2 pips and extends 19 on the outside.

There are serious restrictions for the time window when this would be possible at all.

If my filter is correct, the market has already failed the downside. The fractal with the Echo print below has an additional moratorium zone of 10 pips marked with the green line, but no guarantees of how much more downside movement you shall get.

//// ECHO on the upside
if (((Close[i+1]>iBands(symbol,0,30,2,0,PRICE_MEDIAN,MODE_UPPER,i+1)-80*Point 
&& Close[i+1]<iBands(symbol,0,30,2,0,PRICE_MEDIAN,MODE_UPPER,i+1)+190*Point)
|| (High[i+1]>iBands(symbol,0,30,2,0,PRICE_MEDIAN,MODE_UPPER,i+1)-20*Point 
&& High[i+1]<iBands(symbol,0,30,2,0,PRICE_MEDIAN,MODE_UPPER,i+1)+190*Point))
&& Open[i]>Close[i]
&& ((Low[i+1]>iMA(symbol,0,8,0,MODE_EMA,PRICE_OPEN,i+1)
&& Low[i+2]>iMA(symbol,0,8,0,MODE_EMA,PRICE_OPEN,i+2))
|| (
 Low[i+1]<iMA(symbol,0,8,0,MODE_EMA,PRICE_OPEN,i+1)
&& Low[i+2]<iMA(symbol,0,8,0,MODE_EMA,PRICE_OPEN,i+2)
&& Low[i+2]>iBands(symbol,0,30,2,0,PRICE_MEDIAN,MODE_LOWER,i+2)))
&& High[i+1]>High[i] && High[i+1]>High[i+2] 
//&& High[i+2]>High[i+3]
&& Low[i+3]<iMA(symbol,0,8,0,MODE_EMA,PRICE_OPEN,i+3)
//|| Low[i+4]<iMA(symbol,0,8,0,MODE_EMA,PRICE_OPEN,i+4))
&& Close[i+1]<(High[i+1]-((High[i+1]-Low[i+1])/3)))
{
    ObjectCreate("HOTE"+i,OBJ_TEXT, 0, Time[i+1],High[i+1]+150*Point);
    ObjectSetText("HOTE"+i,"ECHO", 26, "Impact", clrYellow);     
    if (i>1) {ObjectSetText("HOTE"+i,"ECHO", 26, "Impact", clrWhite);     
    level = High[i+1]+100*Point;  }
}

There was a 75%+ pullback and then a move back above the 25% line before a drop and a close at near the halfway mark. The drop we saw could have been a wave 2 down of a Wave 5 up.


Album #23 is here.

Trading?

The first question to ask is where are they compressing volatility?

The answer currently is about 32 pips up from the last swing low. There are another 3 examples above.

The second question is what is my proof for price having turned around?

The answer is none, as there has not been a White or Black Echo print yet.

//// ECHO on the downside
if (Low[i+1]<iBands(symbol,0,30,2,0,PRICE_MEDIAN,MODE_LOWER,i+1)+20*Point 
&& Low[i+1]>iBands(symbol,0,30,2,0,PRICE_MEDIAN,MODE_LOWER,i+1)-370*Point
&& (Open[i]<Close[i] || (i>0 && Low[i-1]>Low[i+1]))
&& High[i+1]<iMA(symbol,0,8,0,MODE_EMA,PRICE_OPEN,i+1)
//&& High[i+2]<iMA(symbol,0,8,0,MODE_EMA,PRICE_OPEN,i+2)
&& Low[i+1]<Low[i] 
&& Low[i+1]<(Low[i+2]+20*Point)
&& Low[i+2]<Low[i+3]
&& High[i+3]>iMA(symbol,0,8,0,MODE_EMA,PRICE_OPEN,i+3)
&& Close[i+1]>(Low[i+1]+((High[i+1]-Low[i+1])/3))
&& ExtATRBuffer[i+1]>50
)
{
    ObjectCreate("HOTE"+i,OBJ_TEXT, 0, Time[i+1],Low[i+1]-80*Point);
    ObjectSetText("HOTE"+i,"ECHO", 26, "Impact", clrWhite);     
    if (ExtATRBuffer2[i+1]<50 && (iBands(symbol,0,30,2,0,PRICE_MEDIAN,MODE_UPPER,i+1)-iBands(symbol,0,30,2,0,PRICE_MEDIAN,MODE_LOWER,i+1))<320*Point) 
    ObjectSetText("HOTE"+i,"ECHO (MFI_R)", 26, "Impact", clrGray);  
  

The Gray Echo was a downgrade due to the BB width not reaching at least 32 pips (squeeze-release).

With that said, there is a 3rd hour of selling currently. If this candle closes back up 1/3, the confirmation could be either the following hour closing green or the second candle staying off the low. That would be a white Echo print, and the moratorium line would be re-plotted 10 pips below the new swing low.


Achilles Dent: Never, Never Land with the voice of Chester Bennington.

Open Mind

We had a severe reaction, but is this move up up yet?

I personally would give the benefit of the doubt of the move down being wave 4 of Wave 3. This would mean two more waves up coming, a wave 5 of Wave 3 and a Wave 5.


Album #22 is out now.

…in the meantime everyone’s selling bonds, mostly US bonds.

Equity Building Principles

We are toying around the Overbought Neckline at 1.1050.

If the swing high was made, come next week the price should make it 53+ pips higher before more selling. Use this leverage to hedge.

Currently, nothing is talking about an immediate downside, in fact, there’s an Echo print.

Principles then.

Step #1 Align holdings with the last settled Echo

Take on excess
– beyond S30
– add 3/4 ways
– add outside BB30 1H

Lighten excess into/past the level reached with 3 whole candles outside the BB

Alles Klar, Kommissar?


Achilles Dent: Rock Me Prometheus

Break Will Happen

exhibit a: stall & pullback in front of an important level that is to be taken out with force

exhibit b: the two volatility lines want to converge and they mean it this time

c: you are inside the block where the weekly echo could come from, but there is more room to retrace (purple square)

Mean Reventon

The market got overtly excited by its own prospects by staying outside the BB for 6 hours+, and is currently returning to the E-9 not seen in 11 days as a Wave 4.

There’s an untested trendline

The Last Stab

The last weekly rung, 86 pips up is totally doable.

There is a triple magenta line, but that is showing some slow down (the first magenta is the measuring leg), but what normally happens is that the 2nd peak would become the flagpole of the last bow back.

We are looking at a peak in the range of 1.1233-1.1249. Could the last move up master the swing high in image 1 (1.1275)?

The launch pad should be the SOB.

I know it does not feel like it, but the market is in a hurry here. The rally could be over in 5 hours. It does have 115 pips of potential based on history relative to the low made today (that’s like 1.1262 currently – 13 pips shy).


Album #21 is out now.

Ecco

A wave does not fail on a push, it fails on the Echo.

The Echo is normally making its way from the 8 EMO to the 30-sample BB from the inside. It is 3 hourly candles long. A 3rd candle close to the upper band closing 1/3 down is the Echo failing. At times it does not reach the BB as you can see on the last image. The wick back of the range candle was the “get me out, I missed the turn”.

//// ECHO
if (High[i+1]>iBands(symbol,0,30,2,0,PRICE_MEDIAN,MODE_UPPER,i+1)-20*Point 
&& High[i+1]<iBands(symbol,0,30,2,0,PRICE_MEDIAN,MODE_UPPER,i+1)+190*Point
&& Open[i]>Close[i]
&& Low[i+1]>iMA(symbol,0,8,0,MODE_EMA,PRICE_OPEN,i+1)
&& Low[i+2]>iMA(symbol,0,8,0,MODE_EMA,PRICE_OPEN,i+2)
&& High[i+1]>High[i] && High[i+1]>High[i+2] && High[i+2]>High[i+3]
&& Low[i+3]<iMA(symbol,0,8,0,MODE_EMA,PRICE_OPEN,i+3) && Close[i+1]<(High[i+1]-((High[i+1]-Low[i+1])/3)))
{
    ObjectCreate("HOTE"+i,OBJ_TEXT, 0, Time[i+1],High[i+1]+150*Point);
    ObjectSetText("HOTE"+i,"ECHO", 26, "Impact", clrWhite);     
}


//// BB ECHO
if (High[i+1]>iBands(symbol,0,30,2,0,PRICE_MEDIAN,MODE_UPPER,i+1)-20*Point 
&& High[i+1]<iBands(symbol,0,30,2,0,PRICE_MEDIAN,MODE_UPPER,i+1)+190*Point
&& Open[i]>Close[i]
&& Low[i]>iMA(symbol,0,8,0,MODE_EMA,PRICE_OPEN,i)
&& Close[i+2]>iBands(symbol,0,30,2,0,PRICE_MEDIAN,MODE_UPPER,i+2)
&& High[i+1]>High[i] && High[i+1]>High[i+2] && High[i+2]>High[i+3]
&& Open[i+3]<iBands(symbol,0,30,2,0,PRICE_MEDIAN,MODE_UPPER,i+3) && Close[i+1]<(High[i+1]-((High[i+1]-Low[i+1])/3)))
{
    ObjectCreate("HOTE"+i,OBJ_TEXT, 0, Time[i+1],High[i+1]+90*Point);
    ObjectSetText("HOTE"+i,"ECHO", 26, "Impact", clrBlack);     
}

Achilles Dent: Dodge The Caravan

Achilles Dent: King What May