Guns & Ammo

Dorime, Amme-mo.

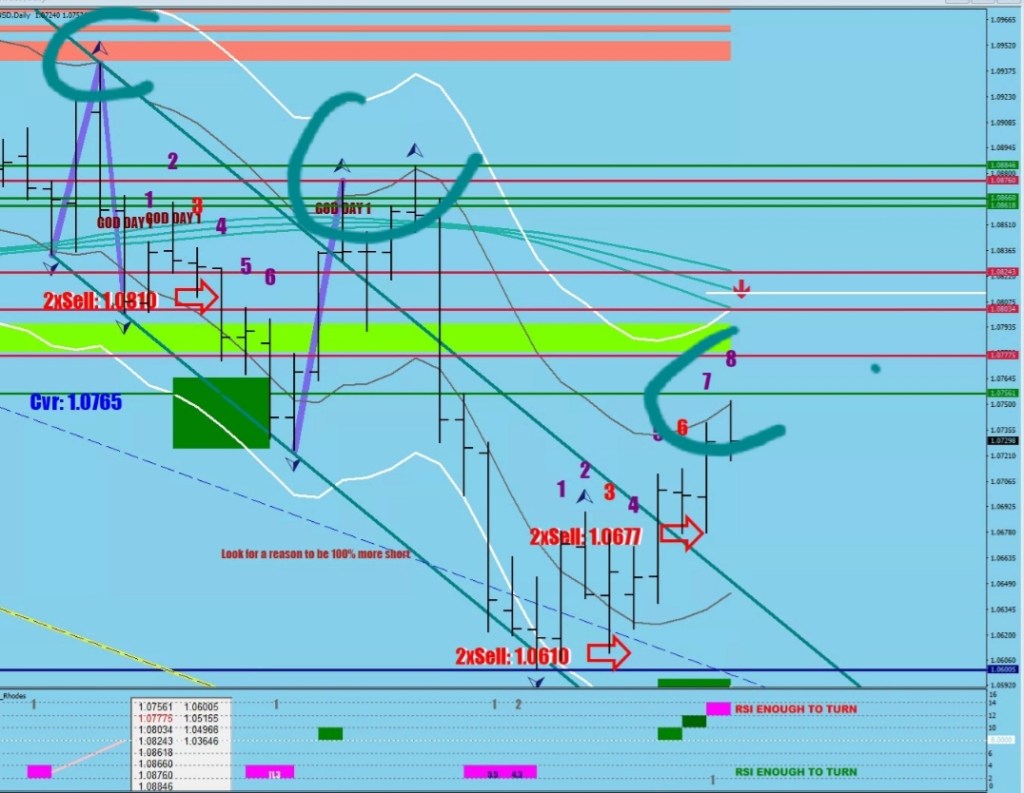
Nick Rhodes has a plot for daily embedding, that it prints into the 2nd indicator window.

if (Period()==1440 && iStochastic(symbol,1440,18,3,3,MODE_SMA,0,MODE_SIGNAL,i+2)<24 && iStochastic(symbol,1440,18,3,3,MODE_SMA,0,MODE_SIGNAL,i+1)<24 && iStochastic(symbol,1440,18,3,3,MODE_SMA,0,MODE_SIGNAL,i)<24 ){
 
                     ObjectCreate("Fracabbb"+IntegerToString(i), OBJ_RECTANGLE, 2,  Time[i+1], 24, Time[i], 0);
                     ObjectSetInteger(0,"Fracabbb"+IntegerToString(i),OBJPROP_COLOR,clrSalmon);
                     ObjectSet("Fracabbb"+IntegerToString(i),OBJPROP_BACK,1);
                     ObjectSet("Fracabbb"+IntegerToString(i),OBJPROP_WIDTH,5);   
               
}

if (Period()==1440 &&  iStochastic(symbol,1440,18,3,3,MODE_SMA,0,MODE_SIGNAL,i+2)>78 && iStochastic(symbol,1440,18,3,3,MODE_SMA,0,MODE_SIGNAL,i+1)>78 && iStochastic(symbol,1440,18,3,3,MODE_SMA,0,MODE_SIGNAL,i)>78){
                      ObjectCreate("Fracabbbb"+IntegerToString(i), OBJ_RECTANGLE, 2,  Time[i+1], 80, Time[i], 100);
                     ObjectSetInteger(0,"Fracabbbb"+IntegerToString(i),OBJPROP_COLOR,clrChartreuse);
                     ObjectSet("Fracabbbb"+IntegerToString(i),OBJPROP_BACK,1);
                     ObjectSet("Fracabbbb"+IntegerToString(i),OBJPROP_WIDTH,5);   
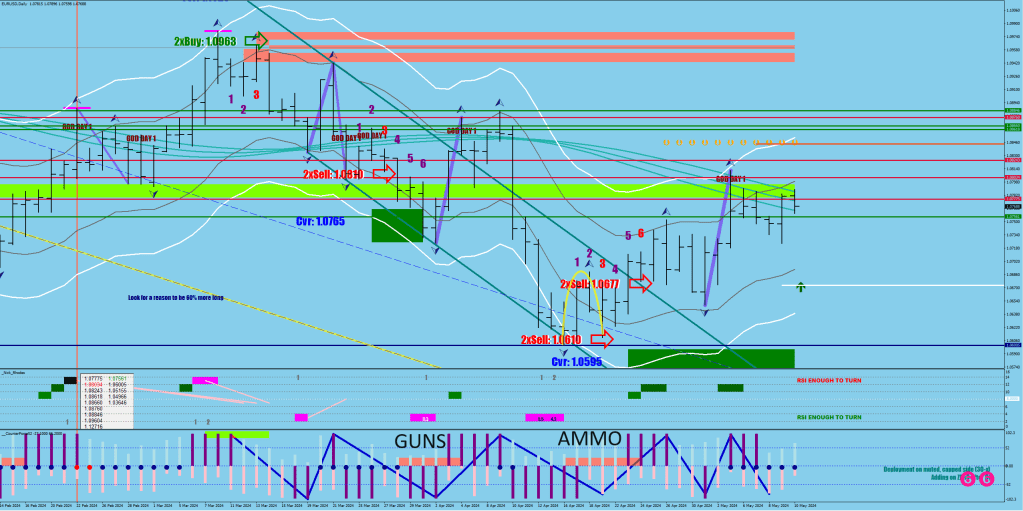
               
}

How this plot can be used to determine the age / current state of the swing?

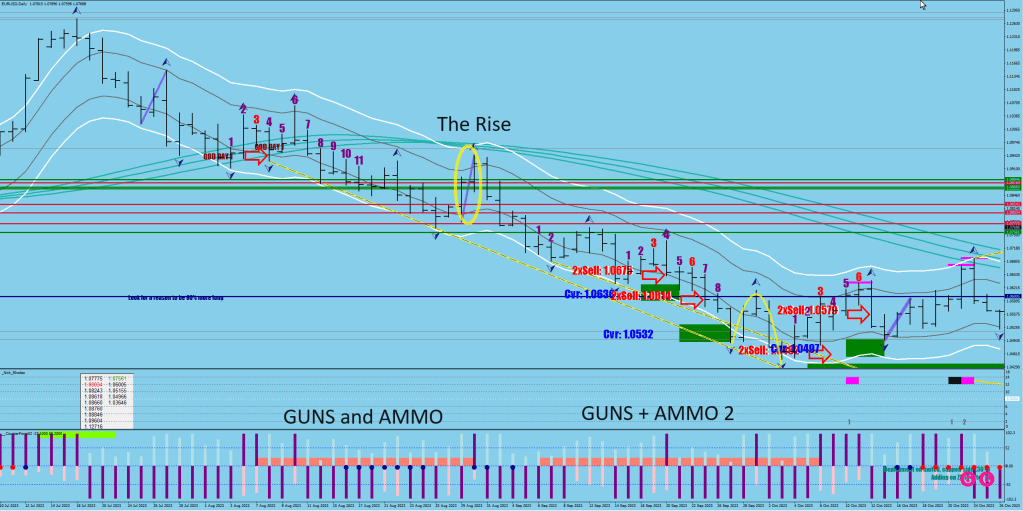
As the thesis goes, you need guns and ammo.

The first block is marking up the location of the guns found.

If the search goes on for 10 or more days, you may have some ammo found too.

Examples.

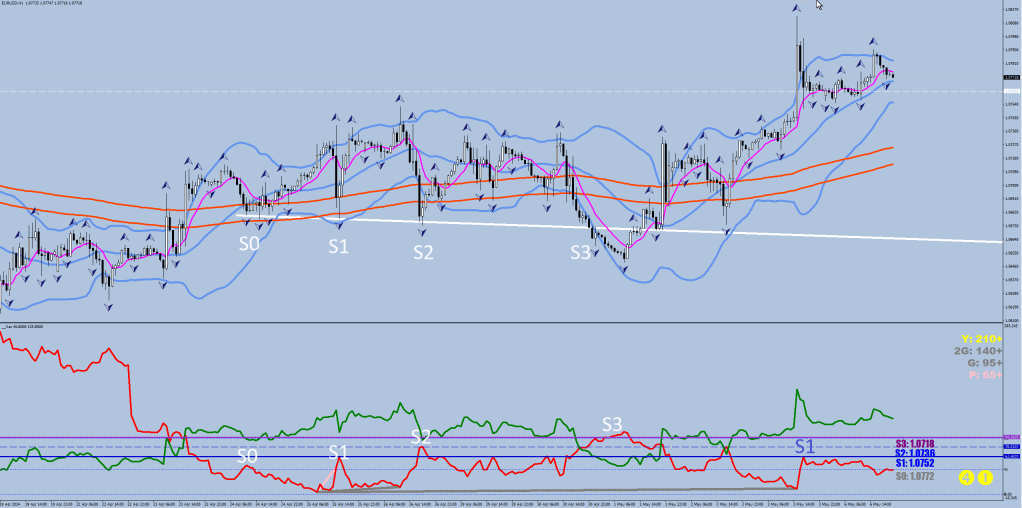
The first image shows a 10-day stretch

Pay attention to the bow back that takes place in 6 days or less.

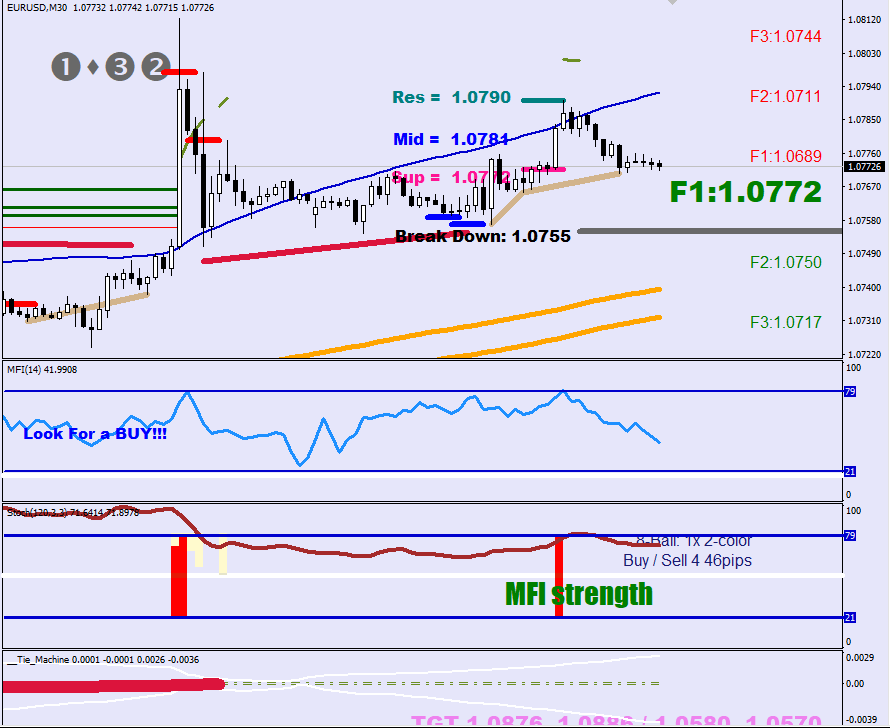
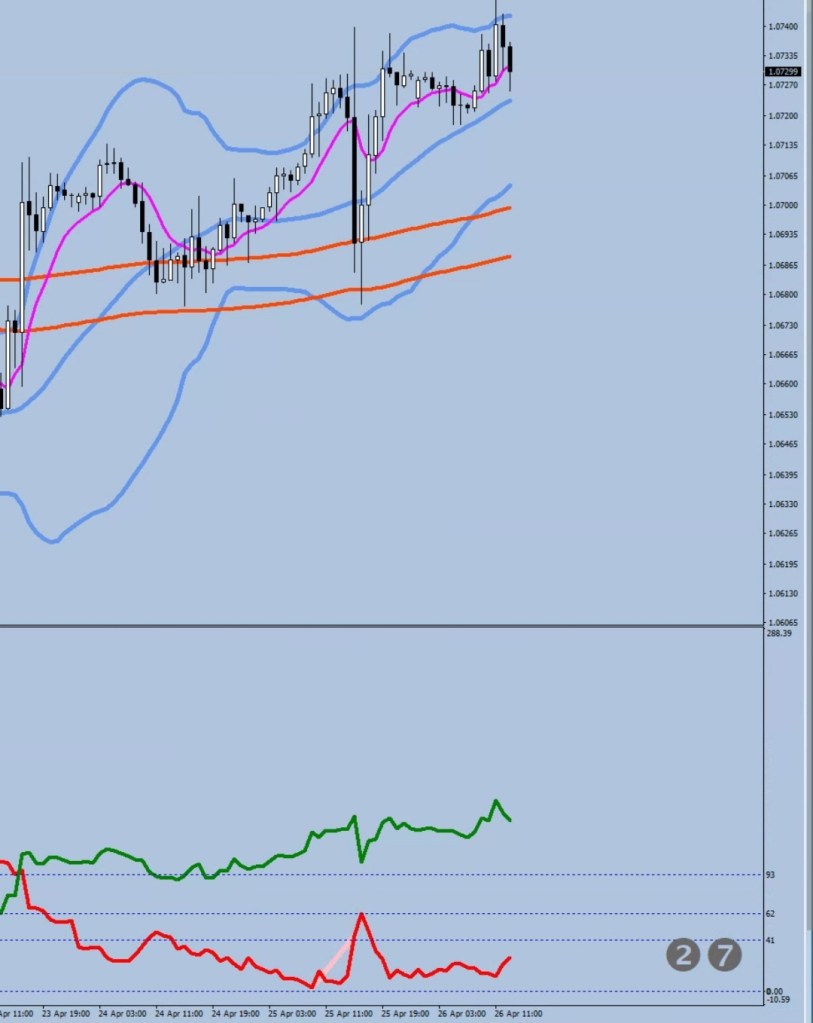
The second example is a Guns + Ammo 16-day search with a bow-back tail.

Of course, the Guns and Ammo blocks are completely separate.

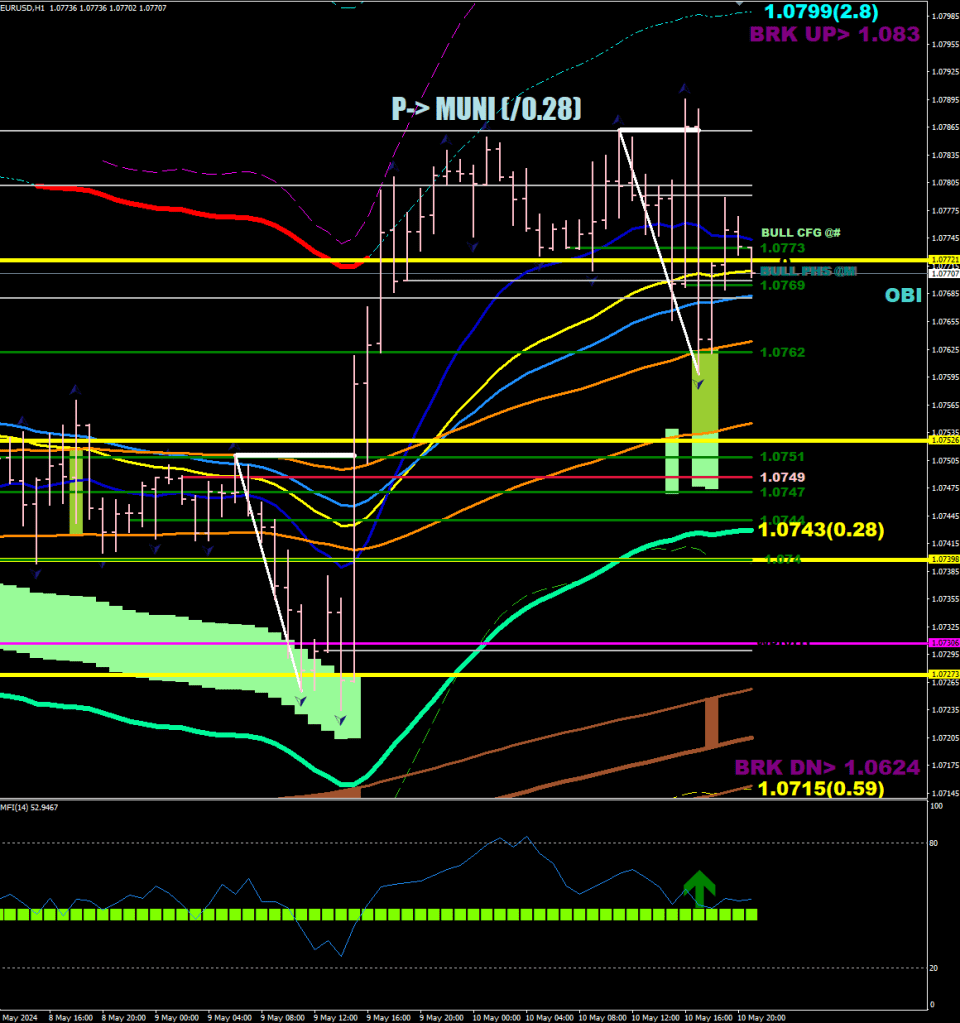
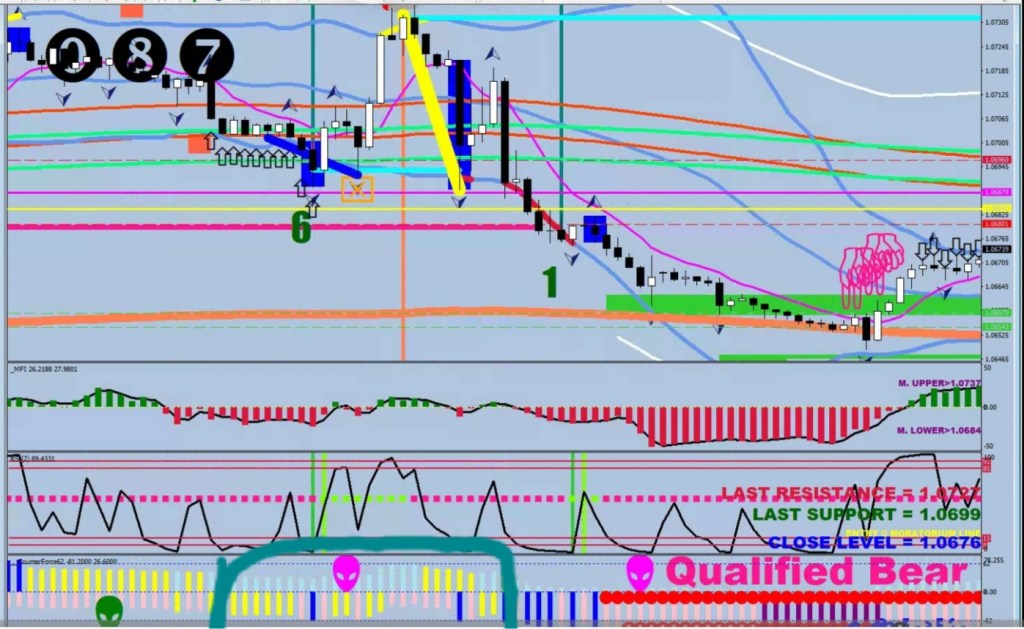
Now we throw liquidity break in the mix. You don’t want to see a lack of buying / a quick lift after a phase of embedding.

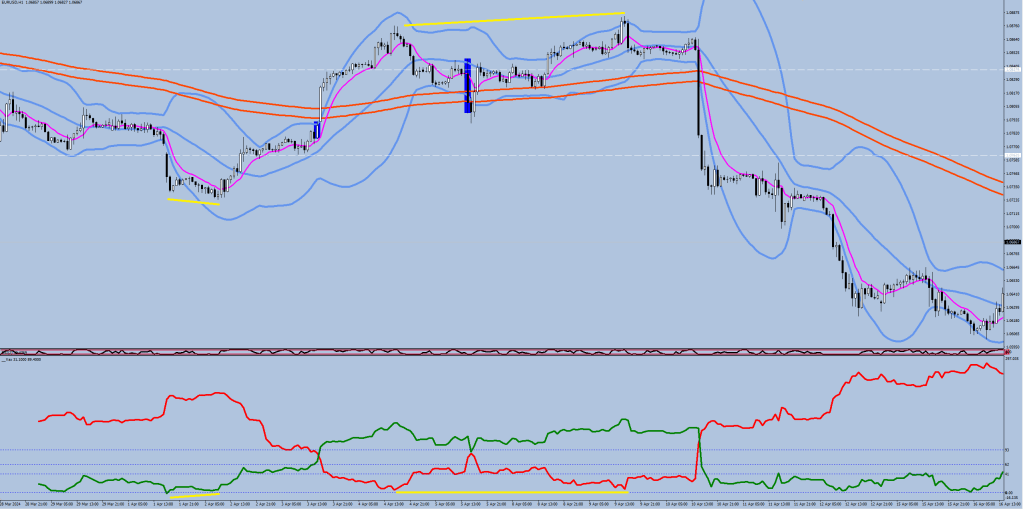
The next one had a deeper pullback in between with a 2-day bow back.

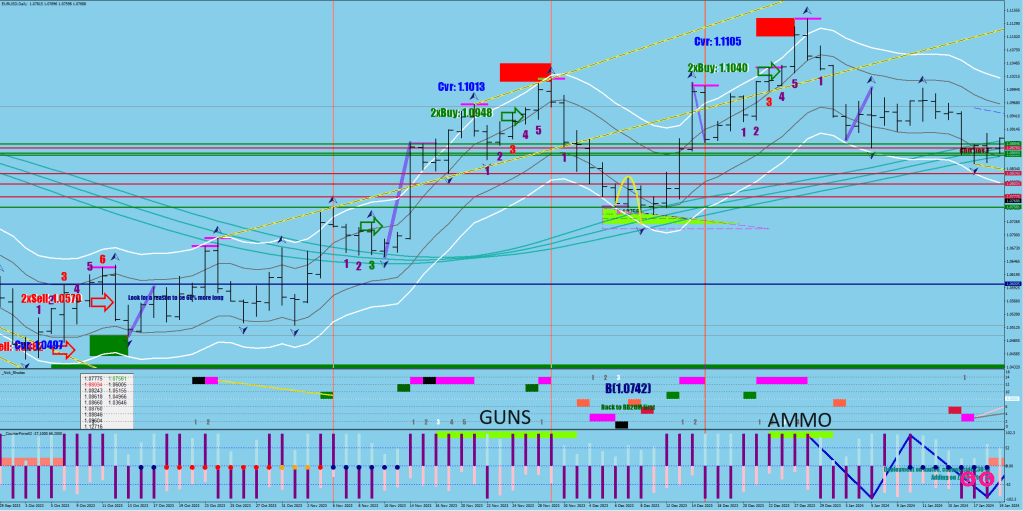
The followin is clearly a G+A with a 6-day bow back at the end.

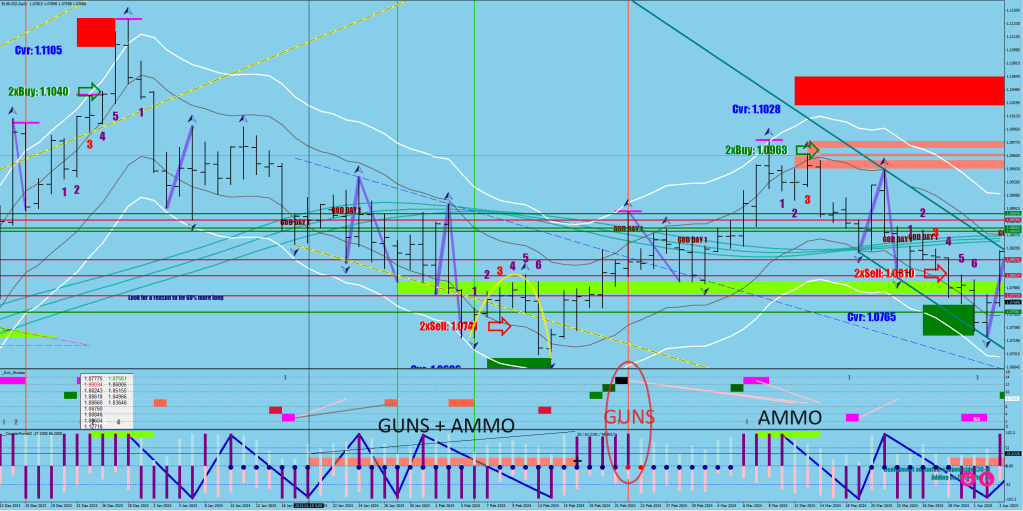
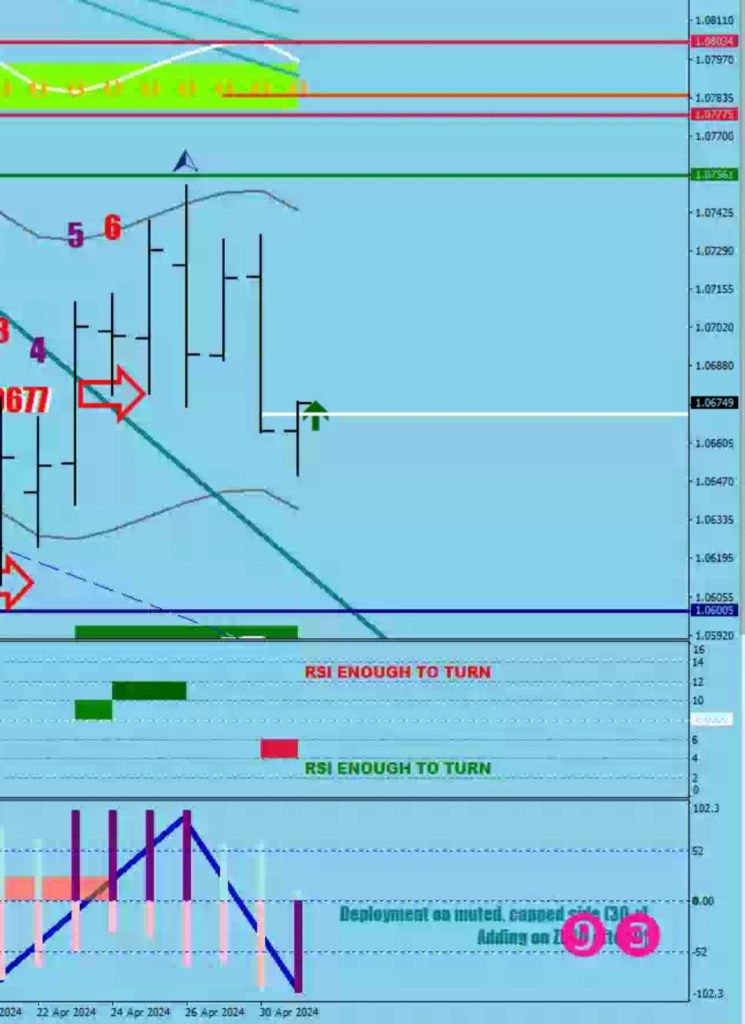
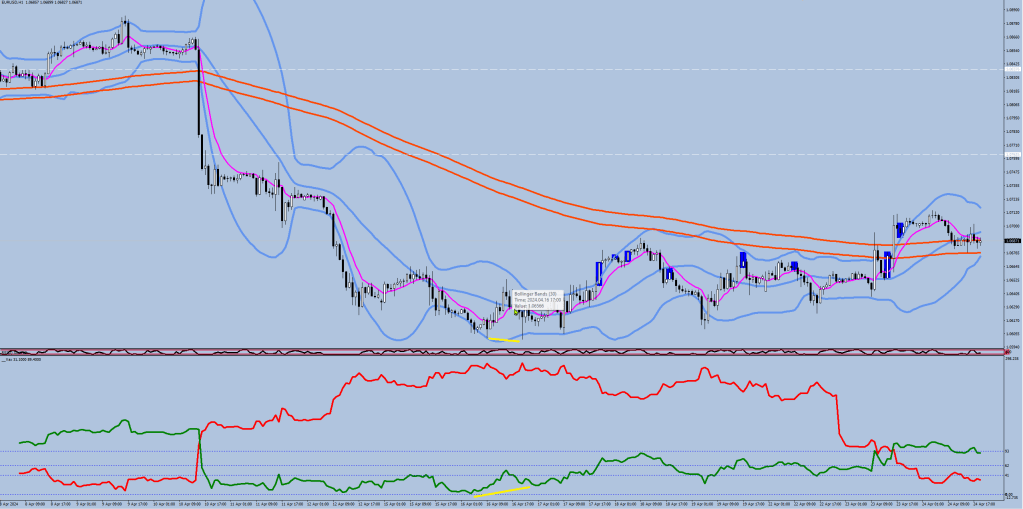
The above has my one single example where Guns were found without Embedding. The combination of the strong squeeze (red ball on the histogram) and a black print (a slip with an extra high RSI2 print).

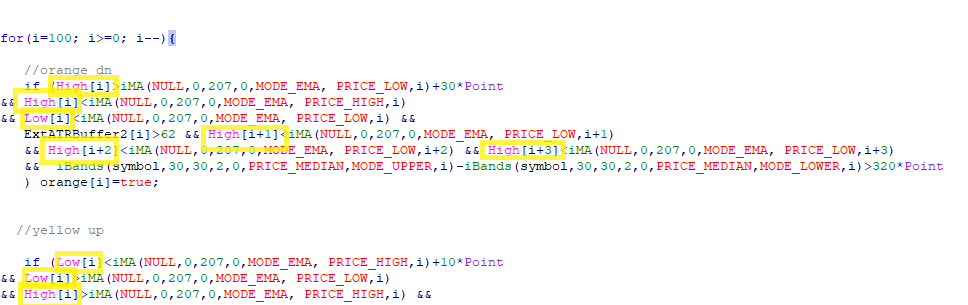
////upside black in the magenta sequence   
   else if (RSI2[i]>96 && High[i+1]<High[i+2]){
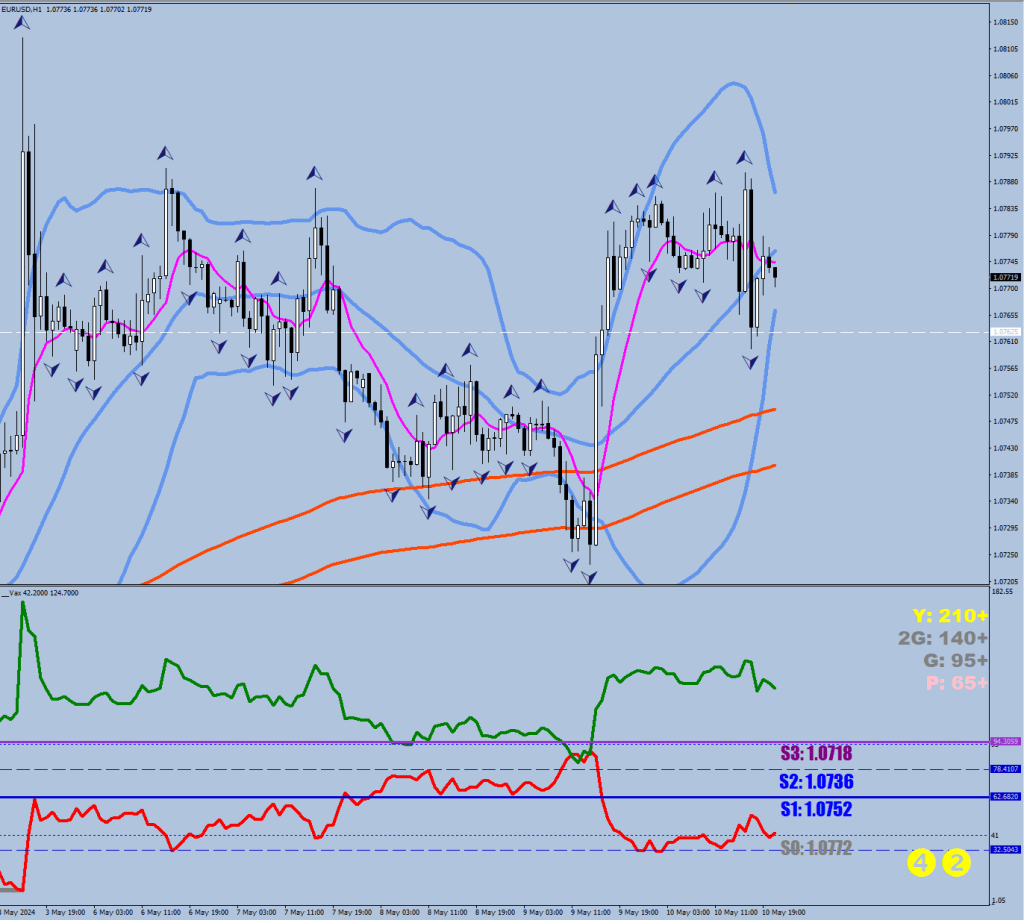
         score[i]=3;

Two things about the last one. The G+A down is clearly visible with the 3-day Bow. Yet, on the upside…

…there hasn’t even been a Guns print yet.

Nostalgia: I called the divergences Guns and Ammo already back in 2021

///// upper guns + ammo pink divergence
    if (score[i]==0 
    && score[i+1]<3
    && (score[i+1]>0  || (score[i+1]<score[iHighest(symbol,0,MODE_HIGH,16,i+6)] && upC[i+1]!=EMPTY_VALUE))
    && score[ArrayMaximum(score,12,i+6)]>2 
    && High[i+1]>iHigh(symbol,0,iHighest(symbol,0,MODE_HIGH,12,i+6))
    && score[ArrayMaximum(score,12,i+6)]>score[ArrayMaximum(score,12,i+6)+1]
    && score[ArrayMinimum(score,12,i+6)]>-3
   ){
    
       ObjectCreate("Panacean"+DoubleToStr(i), OBJ_TEXT, 0, Time[i+1], High[i+1]+70*Point); 
                ObjectSetText("Panacean"+DoubleToStr(i), "DVG DN", 12, "Impact", clrYellow);
                ObjectSet("Panacean"+DoubleToStr(i), OBJPROP_BACK,1);
    
           ObjectCreate("Divergence"+i,OBJ_TREND,indicator_window,Time[i+1],8+score[i+1]*2-1,Time[ArrayMaximum(score,20,i+6)],8+score[ArrayMaximum(score,20,i+6)]*2-1);
                 ObjectSetInteger(0,"Divergence"+i,OBJPROP_RAY_RIGHT,false);
                 ObjectSet("Divergence"+i,OBJPROP_COLOR,clrPink);
                 ObjectSet("Divergence"+i,OBJPROP_WIDTH,3); 
                 ObjectSet("Divergence"+i,OBJPROP_BACK,1); 

                   if (Close[i+1]<c0[0]){
                               ObjectCreate("Panaceattt"+DoubleToStr(i), OBJ_TEXT, 0, Time[i+1], High[i+1]+70*Point); 
                             ObjectSetText("Panaceattt"+DoubleToStr(i), ",", 58, "Webdings", clrWhite);
                             ObjectSet("Panaceattt"+DoubleToStr(i), OBJPROP_BACK,1); 
                             ObjectCreate("Panaceatt"+DoubleToStr(i), OBJ_TEXT, 0, Time[i+1], High[i+1]+70*Point); 
                             ObjectSetText("Panaceatt"+DoubleToStr(i), ",", 52, "Webdings", clrMagenta);
                             ObjectSet("Panaceatt"+DoubleToStr(i), OBJPROP_BACK,1); 
                      }
                      
                 
                   if (i<120 ){
                     ObjectCreate("Fracabb"+IntegerToString(i), OBJ_RECTANGLE, 0,  Time[i+1], iHigh(symbol,0,i+1), Time[0], iHigh(symbol,0,i+1)+160*Point);
                     ObjectSetInteger(0,"Fracabb"+IntegerToString(i),OBJPROP_COLOR,clrSalmon);
                     ObjectSet("Fracabb"+IntegerToString(i),OBJPROP_BACK,1);
                     ObjectSet("Fracabb"+IntegerToString(i),OBJPROP_WIDTH,5);   
                                   
                  }    
   }  

Sudden Denominator

With auto trading, you better know if a routine is timeframe sensitive, and if yes, which one should it be pegged on?

The yellow highlights show timeframe-sensitive data references. These would come back with different values on every timeframe.

It is possible to make a routine timeframe independent in MQL4 by using for instance iLow(symbol, timeframe, location) instead of Low[i].

The point here is that I made a mistake by writing the routine for 30 minutes and then putting it on 1 -hour.

The second long’s 7-candle delay (3.5 hours) became 7 hours, therefore the Municipal Trader opened a long almost at the very end of the move. Amateur hour. Es okay, closed it out in profits and had a reasonably good Friday, since Fridays tend to be about pegging.

I think the yellow aero plane may get a tag in the low 1.075x.

The municipal trader would have opened 2 days ago at 1.0749, and then would have stopped out at the trail at 1.0770 a day later.

I’ll be scaling back into longs, there is nothing bearish here still. Price may not get to the 0.28 safety line.

I think a 2.8x stretch would be a minimum on the upside before a top.

S1 is at 1.0752

As it seems, the high would be between 1.0830 and 1.0860.

Important daily levels are 1.08618 and 1.0866. Also, no top gets made with the Bollinger squeeze-on (blue balls).

Spinnaz

The market hasn’t been providing proper reversal zones, we got spinners instead.

Notice the short red stripe within the green thick line – that was the dip to buy. The red line shows a continuation divergence relative to the previous high – stopping before it and sticking around can only mean one thing.

What was missing vs a reversal zone?

Here are the filters for a Spinner on the upside:

mfi[i]<mfi[i+1] && mfi[i+2]<mfi[i+1] && mfi[i+1]>79 && iStochastic(symbol,0,120,3,3,MODE_SMA,PRICE_MEDIAN,MODE_MAIN,i)>72 && iStochastic(symbol,0,120,3,3,MODE_SMA,PRICE_MEDIAN,MODE_MAIN,i)<92 && mfi[ArrayMaximum(mfi,3,i)]>mfi[ArrayMaximum(mfi,23,i+3)] 

This means an MFI peak above 79, the 120-stochastic above 72, but below 92 and a 26-sample higher MFI read (within the last 3 candles)

Whilst the Money Flow Reversal Zone on the upside goes like this:

      mfi[i+12]>=mfi[i+13] 
      &&
       mfi[i+12]>mfi[i+11] 
      && mfi[ArrayMaximum(mfi,3,i+11)]>mfi[ArrayMaximum(mfi,8,i+14)] 
      && mfi[i+12]>79 
      && iStochastic(symbol,0,120,3,3,MODE_SMA,PRICE_MEDIAN,MODE_MAIN,i)>28
&& !(iStochastic(symbol,0,120,3,3,MODE_SMA,PRICE_MEDIAN,MODE_MAIN,i+12)<88 || iStochastic(symbol,0,120,3,3,MODE_SMA,PRICE_MEDIAN,MODE_MAIN,i+12)>96.8)

so basically 6-7 hours earlier there was a high point in the money flow curve which was over 79, the peak made was greater than any print that was made in the 4 hours prior, and the 120-stochastic reading was not (greater than 96.8 or lower than 88)

In general, the reversal zone is a block where a major rejection could take place (i.e. major daily / weekly swing high / swing low), the Spinner is more of a continuation possibility for a trend in existence (i.e. lower hig / higher low).

I was a bit too optimistic about the S3 getting tagged and maybe overthrown, but they were more eager to cream the dollar than that, and my order block was missed by 1 pip, and S3 was missed by 6.

Altough I was in the fade briefly, I completely missed out on the trip due to some fasting hang over for waiting to be approved for a Pro ECN, which was granted today, so now I can start paying half for a trade.

Now the Vax divergence would be the main thing to look for upon a higher high, but things could fail a different way as well, if they cared to utilize the current spinners and broke the S3, which would by the round trip line up with the S-356 (Brown). The midpoint of the last spinner is 1.0778. If price goes outside the Res= at 1.0782 and then starts making 30-minute closes below the midpoint, that would be a failure.

Since the safety line’s trip level is at 1.0806, which is within a handful of pips of the swing high, the idea here must be higher high after a brief consolidation. It is likely that 1.0830 would be exceeded at least briefly.

I don’t think anyone has ever been more qualified for a Pro ECN. I am now running the Municipal Trader and the W3+F3 traders in the background to supplement my own trading with opening longs.

Let’s see how this goes…

I won’t be able to change the target for the next hour and its own trail would kick in starting 25 pips out.

Vax+

Based on the behavior of the volatility lines, I can now be more precise with the location of the support & resistance levels.

This comes under the “know your instrument” tab. It is not percentaggi, it is hardcore pips.

When the Green Line is on the bottom (Bulls Oppressed), the lines represent resistance levels. The R0 clamp is a strong trend (e.g., aggravated volatility compression) – but when R0 goes, it is over.

A descending/ascending sequence defines an important trendline.

When the Red Line is on the bottom (Bears Oppressed) the lines represent support levels.

Like I said, I am expecting an F3 pullback, which happens to be equal to S3.

I took a good guess with the F list, but there is a level halfway between F2 and F3 that seems to be important as well.

The question is, do we get a lift first? The spinner that is in place gets activated by the price going above the Res level and then making multiple closes back below the Mid. If no upside breakout failure/break and close failure occurs, then the 1.0781 level would become a virgin spinner backtest level and a good probability short.


That’s Steve Lukather and me in the Desert Inn back in the day. Generated all music in 3 days.

The Snoop Dogg track starts at 26:11

To Be Murdered By

Was looking for the meme… “when you turn into a Phoenix after shitting on 1 million cars” – it would have been a good fit here.

Now that I’m about to post an email to apply for a Pro ECN account I’m on the cusp of morphing into a fully Hybrid trader (meaning that I will allow naked positions to be opened by a couple of auto-trading routines on the same account where I would be trading manually). A bit of an obstacle is the instability of Win 10/11.

Auto trading takes a lot, a stable operating system, a not restarting, not freezing computer, a not freezing trading software, working remote access to make changes, continuous power, uninterrupted internet service, the possibility of instant deposit to avoid a margin call…

I have made 3 of the following changes, but the computer still restarted for an update.

The good old Windows 7 has no problems staying on for 6 months straight.

There are technical issues that come and go with a version release of the software. The mobile trading platform for instance recently had a “liquidity issue”: there were no ask and bid values at all times, at-market options were not functioning for half a minute at the time: you could not place your order for half a minute to a minute later, when the button briefly went from gray to active. This went on for almost a week.

Finally, you have to stay conscious and see things for what they are. You are trading with a company registered to the iCount Building, Kumul Highway, Port Villa in Vanuatu. I bet you would not find a living soul at that address, particularly not someone who’s working for this company, just like with an offshore company registered to the Cayman Islands you wouldn’t. The country code is 345 and there are only 200 countries on this planet.

With the PRO ECN my cost of order should drop from $6 to $2.50, and my spread should improve somewhat and or get better fills.

Something useful?

I made a quick tab for Vax divergences about what kind of a move they can prompt.

Based on the current, Gray print, there is more room downward to about 1.0717, but the lasting top (210+ pips) is not gonna be in until another higher high print. A new high-fractal with the following hour closing below the 8EMO would mean a Yellow divergence.


Radio killed the rodeo star.

Another meme that wasn’t there: “when you die and realize that they’re gonna find the plastic ass you’ve been F-ing for the last year”.

Tips & Tips

Let’s talk about the importance of measuring from the 200 sample 30-min lows and highs to have a read on the balance of power.

Who was winning during the green box rally? Bulls managed F1 moves (yellow on the upside) whilst Bears tagged F2 (blue.)

The yellow diagonal highlights a devisive move, the subsequent bounce is a scale in sell.

The recurring money flow adage is that money has to preceed the stochadtic, otherwise that’s a failure upon the print of the divergence. Now, let’s throw some resistance and support in the mix.

The last P/NR had no hopes to be broken, as the money flow breeze did not privide sufficient lift. The most the market managed was a scare on the shield of the 2.8 Safety Line (magenta highlight). The statistical minimum trip was 1.0648. It got within 1 pip of that.

In the opposing corner the failed move got price close enough that dome more money could take care of the break. Remember that I drew that white line for the support?

What’s the damage? Keeping track of the zigzag on the daily it was clear that purple bars were needed next which meant a minimum move to 1.0753-93 pips = 1.0660.

You cannot see that the RSI2 got sufficiently oversold at the low, but that was the case a few pips lower, it was magenta temporarily as it was at the swing high for some of the day.

I think you should be preparing for a rally, maybe a Wave C with that house on.the hill.

A lower low first to utilize the money flow reversal zone? For sure a possibility for more liquidity, but not a must as the gray box was already touched.

Holler If You’re Near Me

Do not miss this one chance to fold on the one opportunity in a lifetime.

Apparently, 35% win rate is enough to make you a Market Shapiro Wizard, but 98.9% isn’t good enough to even get noticed.

On the other hand 35% win rate isn’t going to get you hundreds of percents of gains per year.

Opportunity comes once in a limelight

I earn to be called a professional trader most months.

In January I made $5,828.75 from trading whilst my salary was $4,365.58 (£3,443.86).

In Febuary I made $4,836.55 from trading whilst my salary was $3,103.46 (£2,447.11).

In March I made $5,037.63 from trading whilst my salary was $3,022.94 (£2,393.67).

In April I made $6,000.74 from trading whilst my salary was $4,284.34 (£3,422.87).

I have nothing to hide, the detailed statements are accessible. I don’t make up excel spread sheets with imaginary trades / holdings.

If Forex Factory’s numbers are correct, I made 19.8% gains in January and 22% in Feb, 20% in March & 27.1% in April. I guess mine is also a 20% success trading strategy: 20% gains per month as a minimum.

In February there was a withdrawal attempt for $5100 that got reversed (without explanation) and ended up showing up as a deposit too, but there was never any money going in from me.

The broker’s active sabotage resulted in 2 unrequested entries that I wrote a nasty letter over.

I have been with you for 5 years now guys. In fact, I am merely days away from asking for a Pro Ecn.

I closed 30,379 trades to date. Do you know how many had close by references? Exactly zero.

The two entries were made by a human being.

How do I know this? Because there is most certainly no way to put a close by link to only a part of an ordher, furthermore an automatic partial close out of any trade would never result in the charge of the incurred swap for the entire position (breach #2).

Please reverse those two entries that were made during my sleep, find the resposible person and take appropriate actions.

Mom’s spaghetti? What is this, a requiem for Eminem?

The point is that lots of trading wisdom may amount to nothing, and doing the exact opposite of your guidelines may get you results faster. There is no argument to be had, there is no “yes, but”, there are only bottomline figures for measurements, and how you get there does not matter. I chose to make 3 dollars at a time, take losses on my own terms and I don’t have time for multiple instruments or digesting news feeds, and I have no problems with having a 98% win rate. I’m an in and out burgler.

case imported tuna fish comes once in a lifetime.

Nobody likes a Crowded House.

Kazakhstani version of 2Pac maybe?

I do not have any agenda other than you should not be so certain about how trading must be done. Also I want to call attention to how far behind your own potential you are.

Let me tell you, once you made 100% gains and pulled back out the core capital to give it new purpose, all the traditional risk models cease to make any sense. Your risk would become zero, you would officialy become the bank.

01-04/2024

At The Moment

…I’m having difficulties calling this rally over: there are 3 F-s seem to be missing.

The x0 flip back was missing a filter. I settled on the E-16.

///Flip back down 100x "2" on downsdide & no touch of the 2.8 safety for 40 hours

High[i]<iMA(symbol,0,16,0,MODE_EMA,PRICE_MEDIAN,i)
     

The white low (day 6’s low) does not seem to want to give. The 3 P/NRs remind me of Bulkowski’s 3 peaks… and the house on the hill is yet to be made.

The volatility divergence is not yellow for a reason: a key filter that I came up with at the beginning was that the candle following the divergence fractal (next hour) had to close back on the other side of the 8 EMO (magenta). It is not the case, only the 2nd hour managed to do it. This looks more like a prepped high for a break out.

   if (iFractals(symbol,0,MODE_UPPER,i) && iHigh(symbol,0,iHighest(symbol,0,MODE_HIGH,80,i))==iHigh(symbol,0,i)
   && ExtATRBuffer[ArrayMinimum(ExtATRBuffer,80,i+1)]<10 
   && ExtATRBuffer[ArrayMaximum(ExtATRBuffer,10,i+14)]<62
   && ExtATRBuffer[ArrayMinimum(ExtATRBuffer,80,i+1)]<ExtATRBuffer[i] 
   && ExtATRBuffer[i]<45
   && ((Close[i-1]<iMA(symbol,0,8,0,MODE_EMA,PRICE_OPEN,i-1)) || (i>1 && Close[i-2]<iMA(symbol,0,8,0,MODE_EMA,PRICE_OPEN,i-1))) 
   && ExtATRBuffer2[ArrayMaximum(ExtATRBuffer2,80,i+10)]<ExtATRBuffer2[i]
   )
   {
      ObjectCreate("Frog"+IntegerToString(i),OBJ_TREND,indicator_window, Time[i], ExtATRBuffer[i], Time[ArrayMinimum(ExtATRBuffer,80,i+1)], ExtATRBuffer[ArrayMinimum(ExtATRBuffer,80,i+1)]);
      ObjectSet("Frog"+IntegerToString(i),OBJPROP_COLOR,clrYellow); 
      if (ExtATRBuffer[i]>41)  ObjectSet("Frog"+IntegerToString(i),OBJPROP_COLOR,clrPink); 
      if (Close[i-1]>iMA(symbol,0,8,0,MODE_EMA,PRICE_OPEN,i-1)) ObjectSet("Frog"+IntegerToString(i),OBJPROP_COLOR,clrGray); 
      ObjectSet("Frog"+IntegerToString(i),OBJPROP_WIDTH,6);  
      ObjectSet("Frog"+IntegerToString(i),OBJPROP_RAY_RIGHT,false);
      ObjectSet("Frog"+IntegerToString(i),OBJPROP_BACK,true);           
   }

How far could this go? An upside break out with the current level of consolidation could muster an 1.0802-1.0817 print.

The money flow does not seem to go oversold enough to prompt a reversal zone below. The purple trendline is holding.

The last dip in the green below the 0.28 line shows up as an early bird buy.

The sell off on Friday demoted the Nick Rhodes temporary magenta print to a block below where the RSI2 is stong enough for a turn.

The Hotsteppa line (white + red arrow) happens to be around the E-50 and is currently hanging out at 1.0813 of all places. This line by the way is the tangible heritage of my Energy Bands (as part of the free Nick Rhodes), it is their average six days back.

c0[i]=(c11[i+6]+c22[i+6])/2;
  cval[i] = (.0200/55)*adj*(ChoppinessIndex(ChoppinessPeriod,i+3)+ChoppinessIndex(ChoppinessPeriod,i+4)+ChoppinessIndex(ChoppinessPeriod,i+5))/3;

 c11[i] = (iHigh(NULL,0,i+8)+iHigh(NULL,0,i+7)+iHigh(NULL,0,i+5)+iHigh(NULL,0,i+6))/4+cval[i]*.93*m*Trange[i]*volatility
+(VOLA-50)/10000*m;

   c22[i] = (iLow(NULL,0,i+8)+iLow(NULL,0,i+7)+iLow(NULL,0,i+5))/3-cval[i]*1.62*m*Trange[i]*dvolatility*1.2
+(VOLA-50)/10000*m;

I have 1.7 lots more shorts than longs. I will try to equate them first – if shorts come into money by closing them, if that does not occur, I would have to add longs – or the combination of both.


I’ve dusted off and re-purposed some of my poems for an AI experiment.

Volatility Visor

or wiser?

So I made a flexible displacement option from the E-9.

It takes a bit of fiddling to form fit for the right decimal for the resistsnce.

1.4x does it for dynamic resistance.

Of course the first thing is to get the mean right.

Money flow reversal zone tolerance level is 1.0756.

A bit of fresh air this is from the static levels and trendlines people. Curling back up leaves a bit more headroom for a day to day conversation.

This also means if you are Australian and thinking that the main mean is the daily 20, you are simply wrong.

The 3rd P/NR print. Dumped almost all longs. 8.3 lots short on balance.

The volatility divergence still needs to be set. The attempt was too steep, so it is Pink, not Yellow. Could use another higher high to get the divergence right.

In conclusion be advised: everything starts and ends with volatility, wich means distance.

Vax

Vix is a single number. You can measure absolute maximum distance from a moving average, but how useful is that?

Sophistication starts when you go with a sample size and measure maximum stretch on the upside and on the downside. 2 volatility reads, yes. It makes possibble to see a lot of the underlying changes.

Of course, Counterforce was meant to do this. But so does Vax, only with lines instead of histograms, no limiting and no negative numbers.

#property copyright "Copyright © 2024, Macdulio" 
#property link      "https://forexfore.blog" 
#property description "V1.0"
#property description "Vax"
#property strict

//--- indicator settings
#property indicator_separate_window
#property indicator_buffers 3
#property indicator_color1  clrRed
#property indicator_color2  clrGreen
#property indicator_color3  clrPurple
#property indicator_color4  clrBlue
#property indicator_color5  clrRed
#property indicator_color6  clrDarkKhaki
#property indicator_color7  clrWhite
#property indicator_level1 0
#property indicator_level2 41
#property indicator_level3 62
#property indicator_level4 93
#property indicator_levelcolor clrBlue
#property indicator_levelstyle STYLE_DOT

extern double valuetomonitor = 5.5;
extern int lookback = 100;
extern int indicator_window = 3;
extern int sample = 200;
extern double FSize=32;
double upper[], middle[], lower[];
double avg;
double FMax = FSize*6/5;
double iHi4[];
double iLo4[];    
  string symbol = Symbol();  
double ExtATRBuffer[],ExtATRBuffer2[],ExtATRBuffer3[],ExtATRBuffer4[],ExtATRBuffer5[],stoch60[];
double corr[],corr2[], RSI2[], squeeze[];

int init(){
  
   SetIndexBuffer(0,ExtATRBuffer);   
   SetIndexStyle(0,DRAW_LINE,STYLE_SOLID,4,indicator_color1);
   SetIndexBuffer(1,ExtATRBuffer2);   
   SetIndexStyle(1,DRAW_LINE,STYLE_SOLID,4,indicator_color2);

   return(0);
}

//+------------------------------------------------------------------+
//| Average True Range                                               |
//+------------------------------------------------------------------+
int start(){
  
  ArrayResize(ExtATRBuffer, Bars); 
  ArrayInitialize(ExtATRBuffer, EMPTY_VALUE);   
    ArrayResize(ExtATRBuffer2, Bars); 
  ArrayInitialize(ExtATRBuffer2, EMPTY_VALUE);   
      ArrayResize(ExtATRBuffer3, Bars); 
  ArrayInitialize(ExtATRBuffer3, EMPTY_VALUE);  
      ArrayResize(ExtATRBuffer4, Bars); 
  ArrayInitialize(ExtATRBuffer4, EMPTY_VALUE);  
     ArrayResize(ExtATRBuffer5, Bars); 
  ArrayInitialize(ExtATRBuffer5, EMPTY_VALUE);   
  ArrayResize(iHi4, Bars); 
  ArrayInitialize(iHi4, EMPTY_VALUE);   
  ArrayResize(iLo4, Bars); 
  ArrayInitialize(iLo4, EMPTY_VALUE);   
     ArrayResize(stoch60, Bars);   
 ArrayInitialize(stoch60,  EMPTY_VALUE);
  ArrayResize(RSI2, Bars);   
 ArrayInitialize(RSI2,  EMPTY_VALUE);
   ArrayResize(corr, Bars);   
 ArrayInitialize(corr,  EMPTY_VALUE);  
    ArrayResize(corr2, Bars);   
 ArrayInitialize(corr2,  EMPTY_VALUE);  
    ArrayResize(middle, Bars);   
 ArrayInitialize(middle,  EMPTY_VALUE);  
   ArrayResize(squeeze, Bars);   
 ArrayInitialize(squeeze,  0); 
  ArrayResize(upper, Bars);   
 ArrayInitialize(upper,  EMPTY_VALUE);  
 ArrayResize(lower, Bars);   
 ArrayInitialize(lower,  EMPTY_VALUE);  
    
   int i,j,k;

  for(i=Bars-100; i>=0; i--){ 
   
     if (Period()==240)   iHi4[i]=iMA(NULL,0,52,0,MODE_EMA, PRICE_HIGH,i);
     else if (Period()==30) iHi4[i]=iMA(NULL,0,414,0,MODE_EMA, PRICE_HIGH,i);
     else if (Period()==60) iHi4[i]=iMA(NULL,0,207,0,MODE_EMA, PRICE_HIGH,i);
     if (Period()==240)  iLo4[i]=iMA(NULL,0,52,0,MODE_EMA, PRICE_LOW,i);
     else if (Period()==30) iLo4[i]=iMA(NULL,0,414,0,MODE_EMA, PRICE_LOW,i);
     else if (Period()==60) iLo4[i]=iMA(NULL,0,207,0,MODE_EMA, PRICE_LOW,i);
      stoch60[i]=iStochastic(symbol,60,60,3,3,MODE_SMA,0,MODE_SIGNAL,i);
      RSI2[i]=iRSI(symbol,0,2,PRICE_MEDIAN,i);
}

deletetxt1("Pepper");
deletetxt1("Panace");
deletetxt1("PLOT");

for(i=lookback; i>=0; i--){ 
      middle[i] = iMA(NULL, 0, 20, 0, MODE_SMA, PRICE_TYPICAL, i);
      avg  = findAvg(20, i);
      upper[i] = middle[i] + avg;
      lower[i] = middle[i] - avg;
  
 
 ExtATRBuffer[i]= -1*(iHigh(symbol,0,iHighest(symbol,0,MODE_HIGH,sample-1,i+1))-Low[i])*-10000;
 ExtATRBuffer2[i]=(High[i]-iLow(symbol,0,iLowest(symbol,0,MODE_LOW,sample-1,i+1)))*10000;

if (Period()==60){ 
  
  corr[i]=corr[i+1];
   corr2[i]=corr2[i+1];
   if (ExtATRBuffer4[i+6]!=EMPTY_VALUE) {corr[i]=iHigh(symbol,0,iHighest(symbol,0,MODE_HIGH,60,i))-1360*Point; corr2[i]=iHigh(symbol,0,iHighest(symbol,0,MODE_HIGH,60,i))-2100*Point;} 
   if (ExtATRBuffer5[i+6]!=EMPTY_VALUE) {corr[i]=iLow(symbol,0,iLowest(symbol,0,MODE_LOW,60,i))+1360*Point; corr2[i]=iLow(symbol,0,iLowest(symbol,0,MODE_LOW,60,i))+2100*Point;}


}

}

deletetxt1("AverD");

int twodigits = NormalizeDouble(ExtATRBuffer2[0],0);

if (MathAbs(ExtATRBuffer[0])>ExtATRBuffer2[0]) twodigits = NormalizeDouble(MathAbs(ExtATRBuffer[0]),0);

//string tds = IntegerToString(twodigits);

int tens = round(twodigits/10);

int ones = twodigits-tens*10; 

string stens, sones;

//Print("tens=",tens);
//Print("ones=",ones);


switch(tens)
{
case  1:   stens=CharToStr(140);
        break;
case  2:   stens=CharToStr(141);
        break;
case  3:   stens=CharToStr(142);
        break;        
case  4:   stens=CharToStr(143);
        break;
case  5:   stens=CharToStr(144);
        break;
case  6:   stens=CharToStr(145);
        break;        
case  7:   stens=CharToStr(146);
        break;                
case  8:   stens=CharToStr(147);
        break;                        
case  9:   stens=CharToStr(148);
        break;                      
  default: stens=CharToStr(139);
      break;
  }
  
//deletetxt1("AverD");

switch(ones)
{
case  1:   sones=CharToStr(140);
        break;
case  2:   sones=CharToStr(141);
        break;
case  3:   sones=CharToStr(142);
        break;        
case  4:   sones=CharToStr(143);
        break;
case  5:   sones=CharToStr(144);
        break;
case  6:   sones=CharToStr(145);
        break;        
case  7:   sones=CharToStr(146);
        break;                
case  8:   sones=CharToStr(147);
        break;                        
case  9:   sones=CharToStr(148);
        break;                      
  default: sones=CharToStr(139);
      break;
  }

 
string jointstring=stens+sones;

ObjectCreate("AverD",OBJ_LABEL,indicator_window, 0,0);

ObjectSet("AverD",OBJPROP_CORNER,3);
    ObjectSet("AverD",OBJPROP_XDISTANCE,20);
  ObjectSet("AverD",OBJPROP_YDISTANCE,27);
  
ObjectSetText("AverD",jointstring,40,"Wingdings",DimGray);
if (twodigits>30)  ObjectSetText("AverD",jointstring,40,"Wingdings",Yellow);  
if (twodigits>58)  ObjectSetText("AverD",jointstring,40,"Wingdings",DeepPink);  


deletetxt1("Crush");  
deletetxt1("Leap");  
deletetxt1("Frog"); 
deletetxt1("Countess");
deletetxt1("Missing");
deletetxt1("KAROLY");
  
int counter = 9;  
  
for(i=lookback; i>=0; i--){   

       if (Close[i]<iLo4[i] )  {ObjectSetText("Crushi"+i, "Vol Crush > ", 21, "Impact", clrWhite); ObjectSetText("Crush"+i, "Vol Crush -> ", 19, "Impact", clrNavy); ObjectSetText("Crushy"+i,DoubleToStr(NormalizeDouble(iHi4[i],4),4), 21, "Impact", clrWhite); ObjectSetText("Crushd"+i, DoubleToStr(NormalizeDouble(iHi4[i],4),4), 19, "Impact", clrNavy);   }
       
       else if (Close[i]>iHi4[i] ) { ObjectSetText("Crushi"+i, "Vol Crush > ", 21, "Impact", clrWhite); ObjectSetText("Crush"+i, "Vol Crush -> ", 19, "Impact", clrNavy);  ObjectSetText("Crushy"+i, DoubleToStr(NormalizeDouble(iLo4[i],4),4), 21, "Impact", clrWhite); ObjectSetText("Crushd"+i, DoubleToStr(NormalizeDouble(iLo4[i],4),4), 19, "Impact", clrNavy);  }

}

double rou=0;
double rod=0;

if (Period()==30){
deletetxt1("Libec");

i=0;
while(i<10){
   if (High[i]-iMA(NULL,0,17,0,MODE_EMA, PRICE_MEDIAN,i)>rou) rou=High[i]-iMA(NULL,0,17,0,MODE_EMA, PRICE_MEDIAN,i);
   if (iMA(NULL,0,17,0,MODE_EMA, PRICE_MEDIAN,i)-Low[i]>rod) rod=iMA(NULL,0,17,0,MODE_EMA, PRICE_MEDIAN,i)-Low[i];
i++;
}

  ObjectCreate("Libec"+4,OBJ_LABEL,indicator_window, 0,0);
   ObjectSetText("Libec"+4, DoubleToStr(rou*10000,2)+" ("+DoubleToStr(iMA(NULL,0,17,0,MODE_EMA, PRICE_MEDIAN,0)+rou,4)+")", 11, "Arial Black", DarkViolet);  
  ObjectSet("Libec"+4,OBJPROP_CORNER,2);
    ObjectSet("Libec"+4,OBJPROP_XDISTANCE,20);
  ObjectSet("Libec"+4,OBJPROP_YDISTANCE,67);
  if (rou>rod) ObjectSet("Libec"+4,OBJPROP_COLOR,clrDarkGreen);
  else if (rou<.0010) ObjectSet("Libec"+4,OBJPROP_COLOR,clrGray);
   else ObjectSet("Libec"+4,OBJPROP_COLOR,clrBlack);


  ObjectCreate("Libec"+5,OBJ_LABEL,indicator_window, 0,0);
   ObjectSetText("Libec"+5,DoubleToStr(rod*10000,2)+" ("+DoubleToStr(iMA(NULL,0,17,0,MODE_EMA, PRICE_MEDIAN,0)-rod,4)+")", 11, "Arial Black", DarkViolet);  
  ObjectSet("Libec"+5,OBJPROP_CORNER,2);
    ObjectSet("Libec"+5,OBJPROP_XDISTANCE,20);
  ObjectSet("Libec"+5,OBJPROP_YDISTANCE,47);
  if (rod>rou) ObjectSet("Libec"+5,OBJPROP_COLOR,clrCrimson); 
  else if (rod<.0010) ObjectSet("Libec"+5,OBJPROP_COLOR,clrGray);
   else ObjectSet("Libec"+5,OBJPROP_COLOR,clrBlack);

}


  return(0);
}
//+------------------------------------------------------------------+
   void deletetxt1(string text){
   for(int iObj=ObjectsTotal()-1; iObj >= 0; iObj--){
      string   on = ObjectName(iObj);
      if(StringFind(on, text) == 0)  ObjectDelete(on);
}  }

   double findAvg(int period, int shift) {
      double sum=0;
      for (int x=shift;x<(shift+period);x++) {     
         sum += High[x]-Low[x];
      }
      sum = sum/period;
      return (sum);
   }

Based on the need for \ volatility divergence, there should be a higher high print with the red line not making it down to 25.