And I wonder who you are, and I wonder what you want.
The concept of grasping a concept.
Concept #1
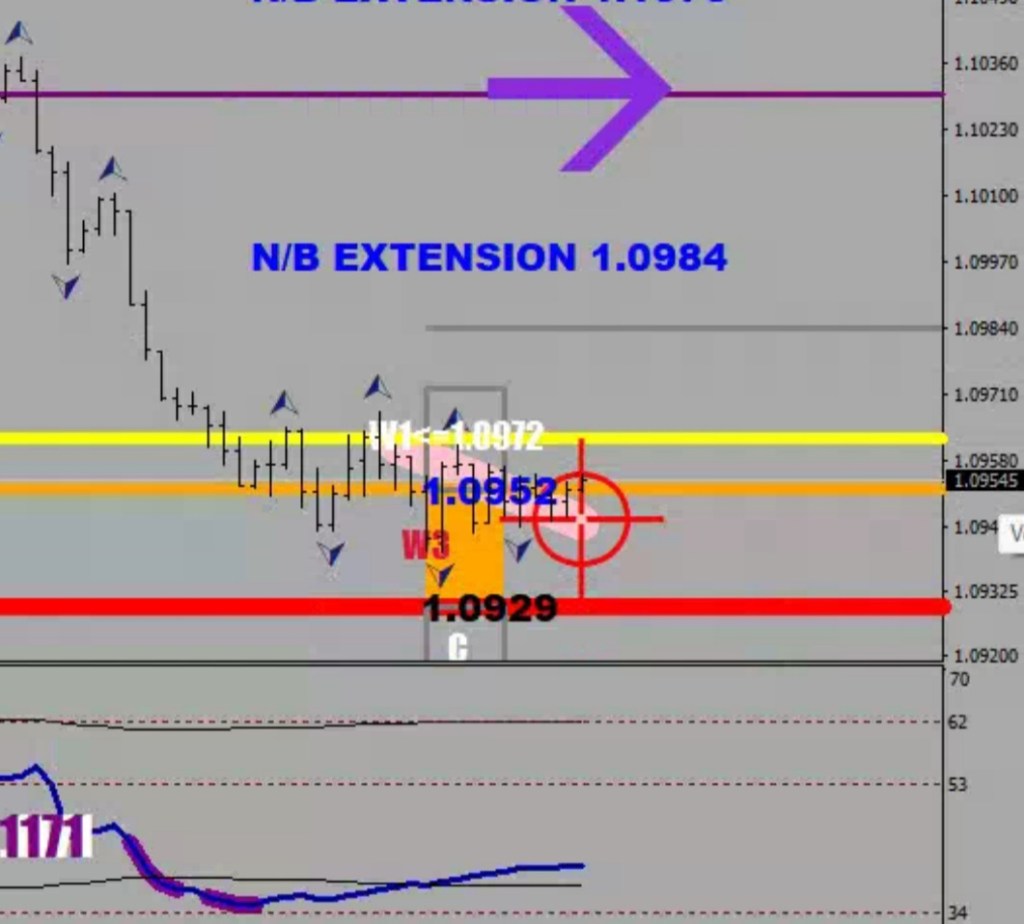
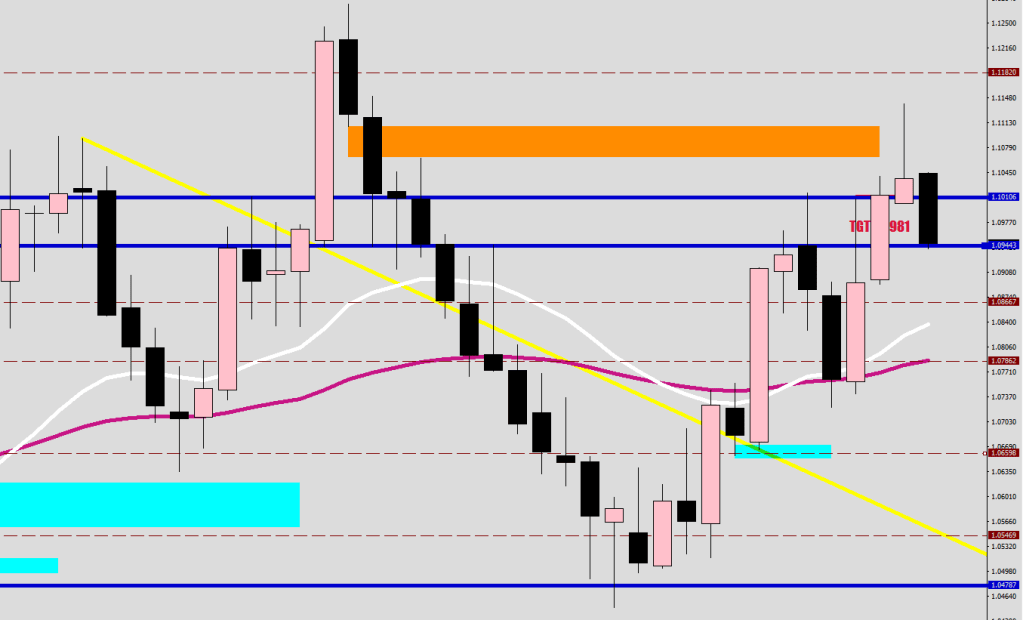
A parabolic market is targeting the W3 close end to mid point. Parabolic = 14 out of the last 16 candles closed below on the 30-minute 30-sample SMA.
W3 is the orange box, 3-day ATR measured from the last consilolidation mean plus 10-30%.
Concept #2
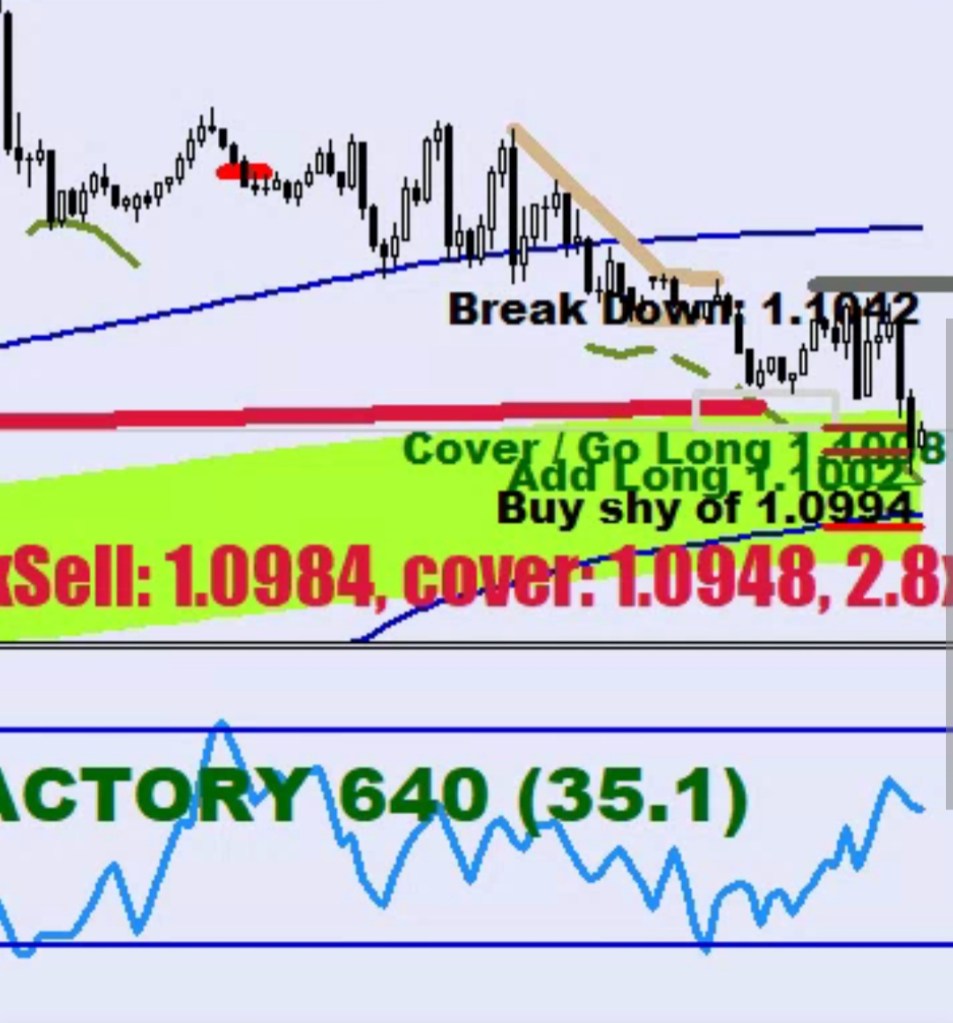
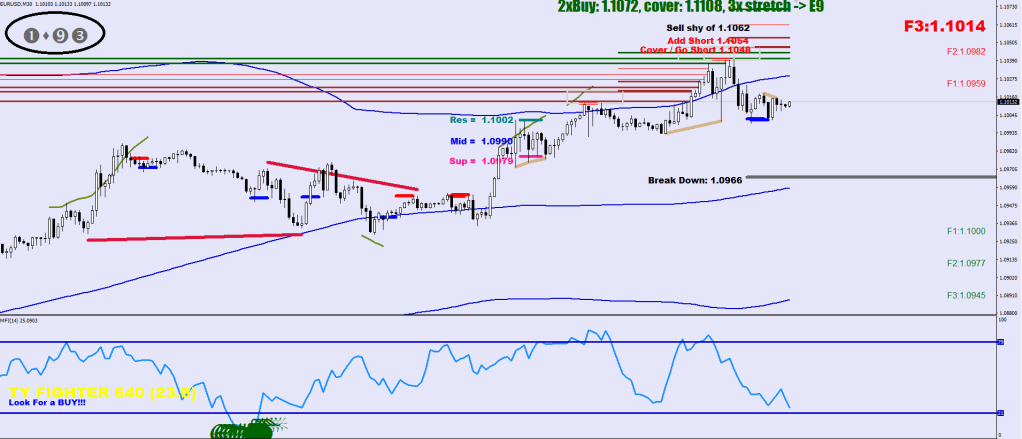
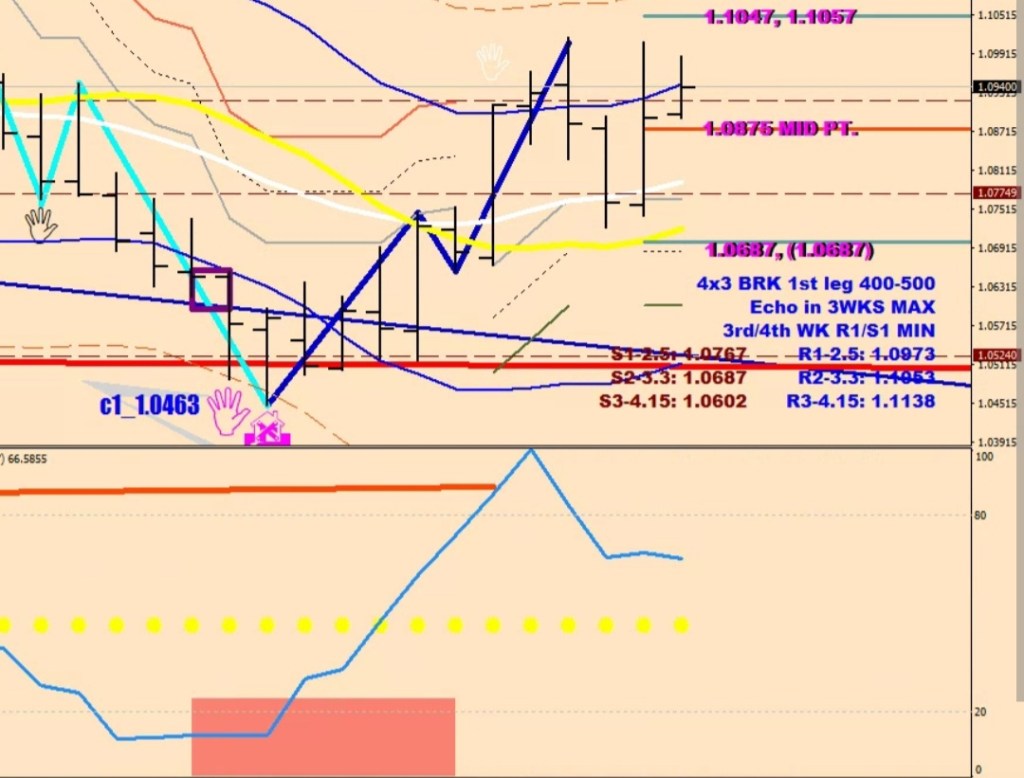
The Money flow droop works like this: if the highighted reversal zone gets exceeded, that means the arrival of new money after the measuring leg was settled, i.e.: go 2x short at 1.0984, cover most of the holdings at 1.0948.
Concept #3
A powder box (4H) is a potential reversal zone. The shaded one ranks higher, as it is outside the 100-pip displacement.
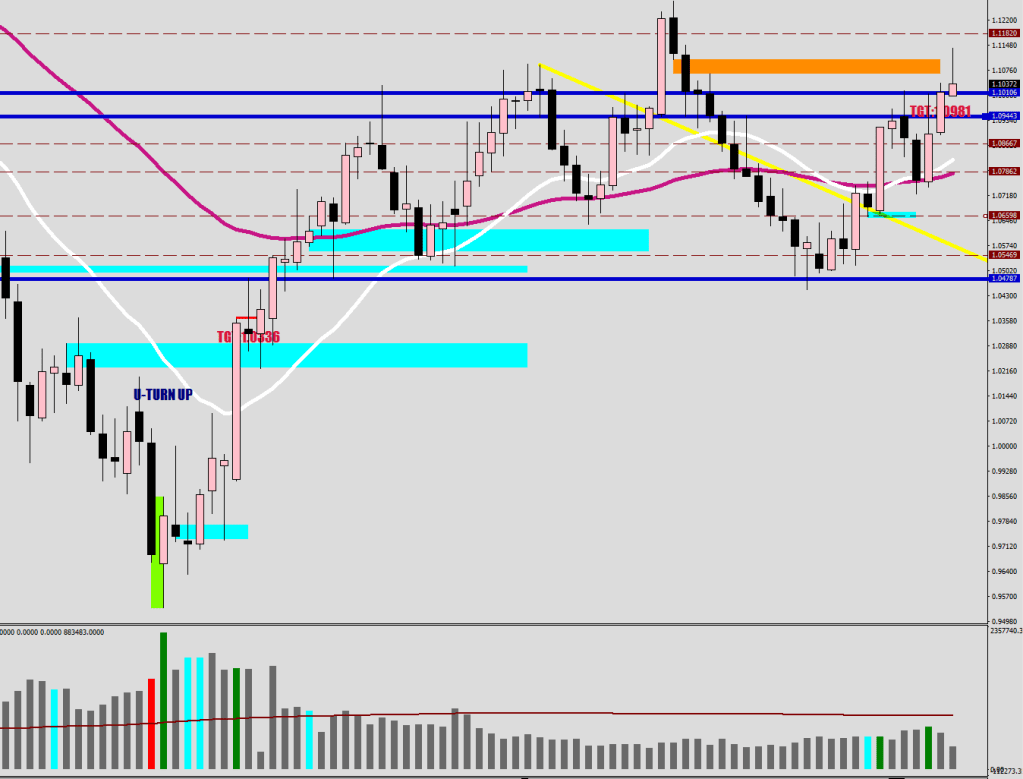
The 14x candle count has started and the market has to now prove upside volatility.
I would expect to find resistance stating 62.5 pips up from the lowest low in this move / at the Upper Guard Rail / starting the upper 30-sample Bollinger Band, and continue lower from there.
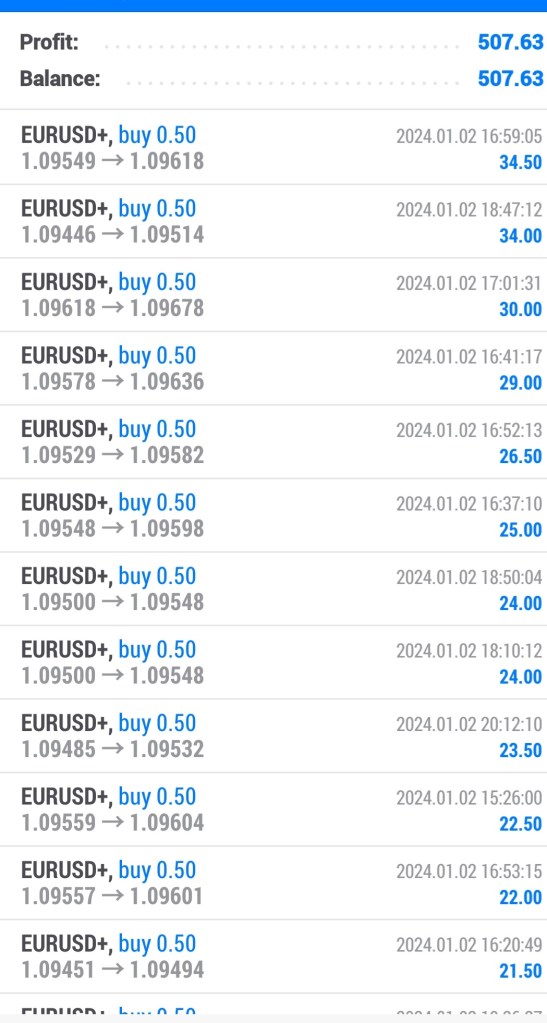
The market is closing on the lows today. I was trading longs only all day, and this turned out to be not a problem to post a normal daily average. I am 6:5 long to short here.
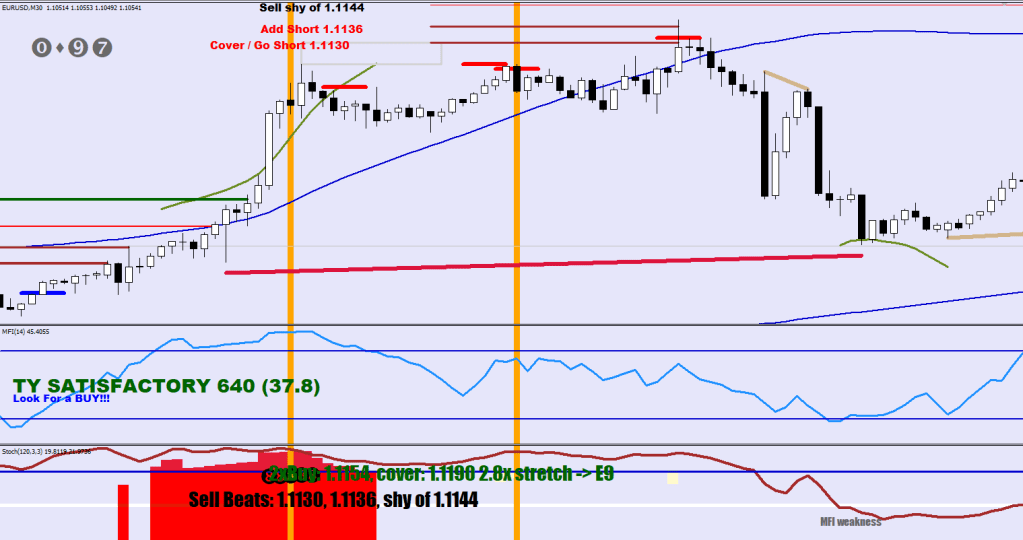
You have the software, here’s some tips on how to interpret and compliment the data on screen.
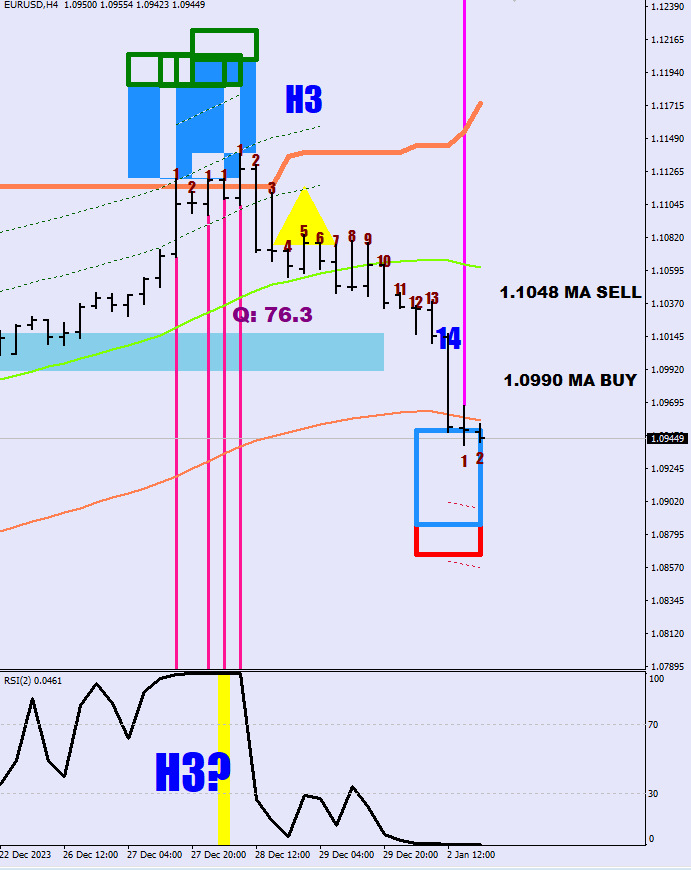
The 14-count is a “show me counter directional volatility” part. If price comes back inside the Guard Rails, you would see more movement in that direction, however a re-test of the powder box (Lower Low / Higher High) is a possibility unless the higher low / lower high is printed within the 14 count.
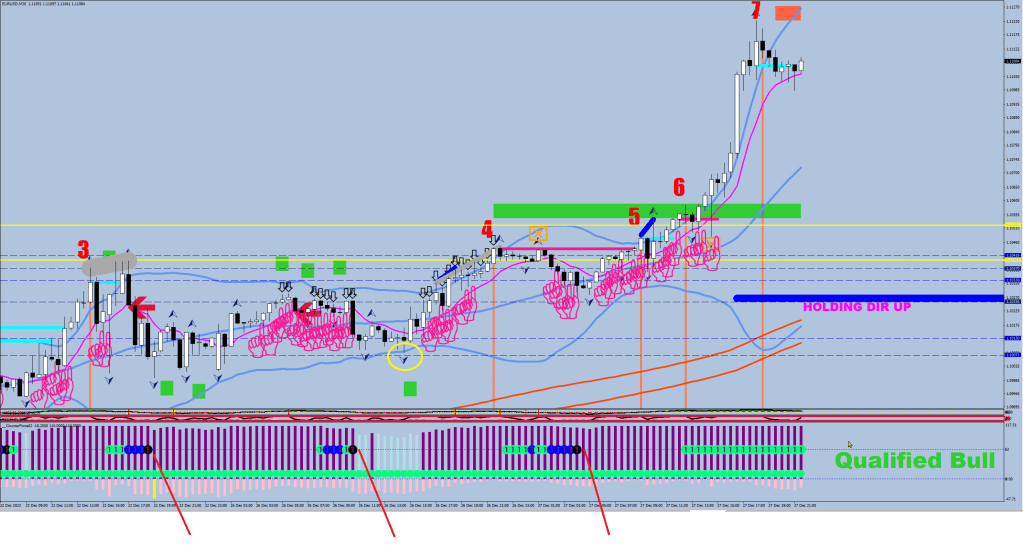
The acceleration can be seen by the Humps (H) going outside the channel on the upside, tagging nothing, tagging the 1st resistance line and sniffing the 2nd resistance line on the 3rd try.
I would plot the Higher Low with a triangle and the H3 for the break out level.
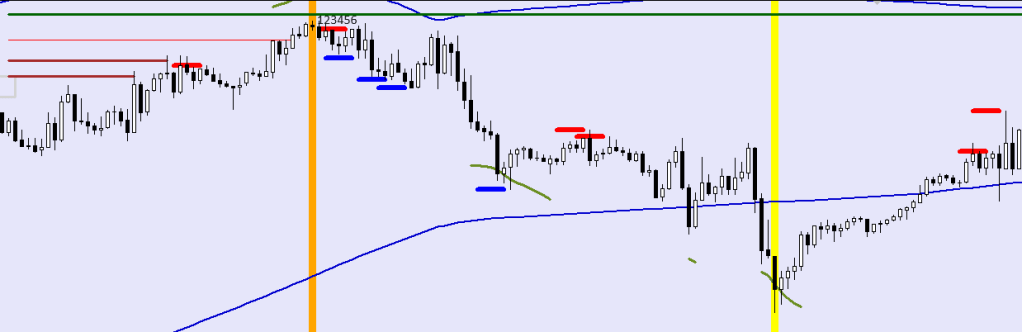
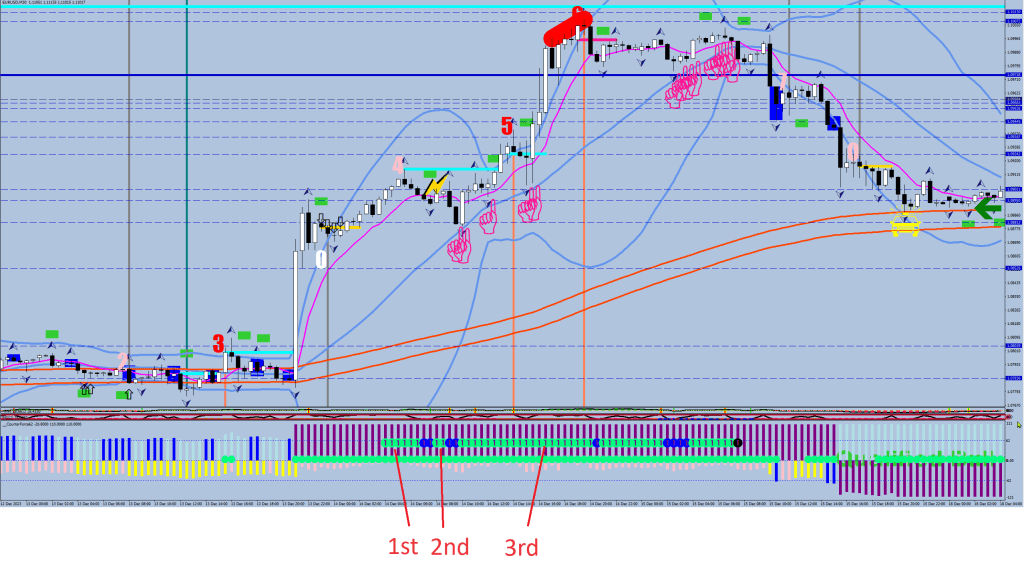
On the second image the 14 count did not prove volatility, and also you get a fresh count by breaking the high. H2 proved volatiliy (working out of a hollow box, which is a divergence, but not necessarily a terminal end, especially not in a corrective structure). Going below the Guards supplied with the 3 humps. The H1 was an automatic plot, H2, H3 I had to fill in (hence the font difference).
After the back test, there were 3 humps again, and the H2 was rather shy around the previous high, but there was clearly a return back below the Guard, so the count stands.
Happy 2024!
* In US English, it’s ‘labeling’ (one ‘l’).In UK English, it’s ‘labelling’ (double ‘l’).
The last subject of the year is smart & funny comcepts.
I’ve got inner city mama on the hook, so you know this is gonna be a bit of an ego trip.
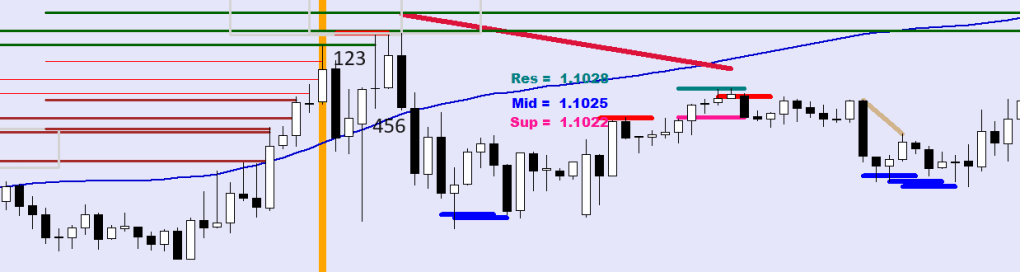
Here are 3 different ways I could call the reversal zone.
#1 – By the way of the Rabbit – energy signals placed the zone between 1.1121 and 1.1151. The high was 1.11393
Energy Trading is a framework invented by me, and is replicable, since it is code based. “Smart Money Concepts” are a bunch of unverifiable linguistic stunts vomited into a bucket.
#2 The Money Flow Droop highlighted the 1.1130-1.1144 zone
#3 the bonus software / powder boxes highighted the zone starting 1.1124. The powder boxes only receive shading outside the bumper lines which are at at 20-sample delay and a 100-pip displacement.
Once price comes off the box, a 14-sample counter is started. This “incubation” is to prove the available volatiliy. This time it made it back inside the E-52 EMA Band’s surrounding Guard Rails. More dowside is confirmed.
A capitulation move is often a 100 or so extra pips move to knock somebody out of their holdings.
The Final Divergence near the top was a Crown Royale.
This plot came in handy at calling the end of the Wave 4 as well.
As Dickens once said, all the chickens come home to defrost.
People are preoccupied with all the wrong things. To me everything starts with a binary code.
if (Close[i]<guardraild[i]) { gm60[i]=guardraild[i]-600*Point; gm100[i]=guardraild[i]-1000*Point; }
if (Close[i]<gm60[i] && gm60[i]!=EMPTY_VALUE) { gm138[i]=guardraild[i]-1380*Point; }
if (High[i+20]>iHigh(symbol,0,iHighest(symbol,0,MODE_HIGH,200,i+21))) upperbumper[i]=High[i+20]+1000*Point; if (Low[i+20]<iLow(symbol,0,iLowest(symbol,0,MODE_LOW,200,i+21))) lowerbumper[i]=Low[i+20]-1000*Point;
if (last_encounter_d>8){ ObjectCreate("EPERJESBACK"+i, OBJ_RECTANGLE, 0, Time[last_encounter_d], Close[last_encounter_d], Time[last_encounter_d-8], iLow(symbol,0,iLowest(symbol,0,MODE_LOW,9,last_encounter_d-8))); ObjectSet("EPERJESBACK"+i,OBJPROP_BACK,1);
if (Close[0]>iLow(symbol,0,iLowest(symbol,0,MODE_LOW,9,last_encounter_d-8))-60*Point) ObjectSetInteger(0,"EPERJESBACK"+i,OBJPROP_COLOR,clrGreen); else ObjectSetInteger(0,"EPERJESBACK"+i,OBJPROP_COLOR,clrCrimson);
}
for (i = 1200 ; i >= 0; i--){ RSI2[i]=iRSI(symbol,0,2,PRICE_MEDIAN,i); }
Typical. I come up with a top notch signal and the first live call turns out to be an exception. Here’s the missing maual, Murphy.
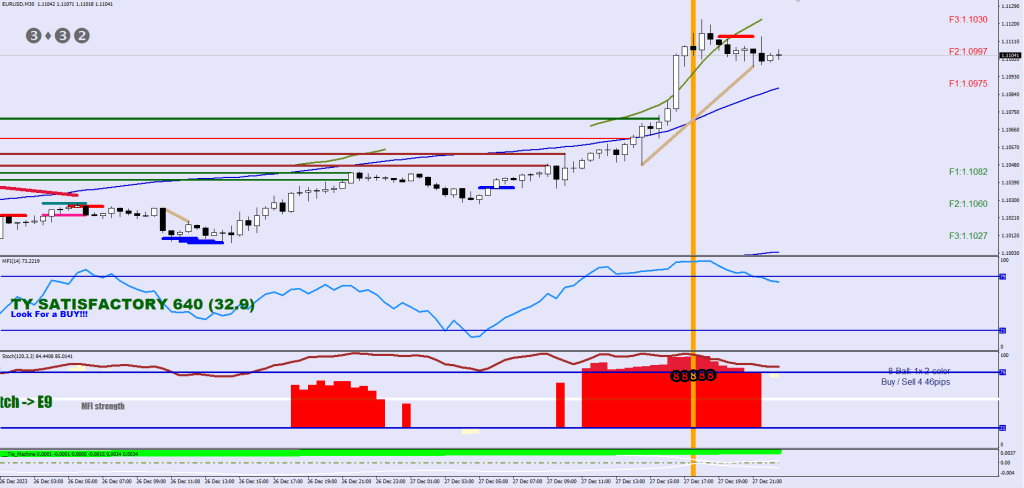
After the lift call button is pressed, the game of rock, paper, volatility is played.
Duration: 3hrs. The bears win and the lift call gets carried out with the call button representing a peak.
However if the volatility shows up first, price would not get too far on the downside / embedding shall persist and the next BB breach would be a continiation entry.
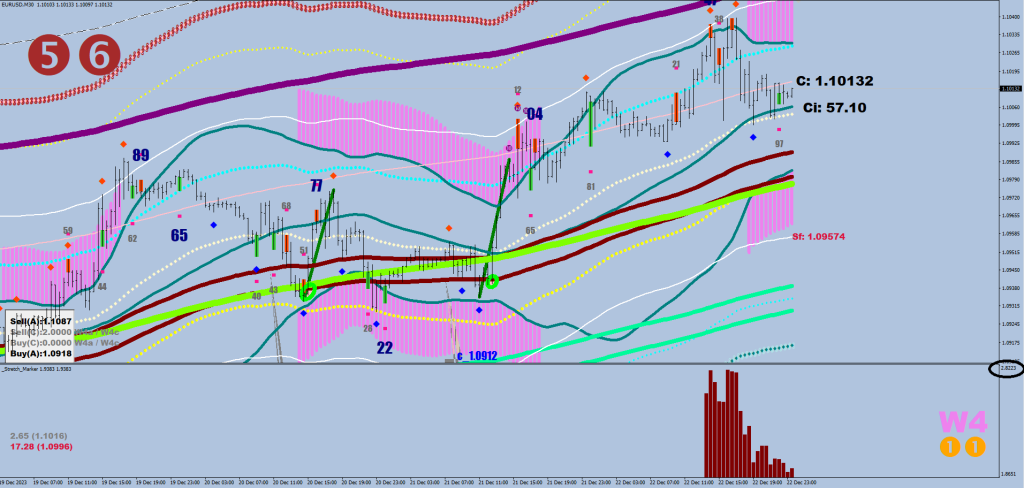
An F-1 market ends in a reversal is started by two closes on the other side of the S30, confirmed by a 40+ pip counter volatility print if these two do not coincide. This would lead to an almost neutral, F1 market. Target W3 ATR near end.
I bet you don’t believe that a parabolic move’s ending point can be projected in any way. It can be. It is measured from the last consolidation level and uses the 3-day ATR 10-30 percent. You can have this number figured for the day, scaling out is advised. Sell some at 1.1113, more at 1.1120 etc.
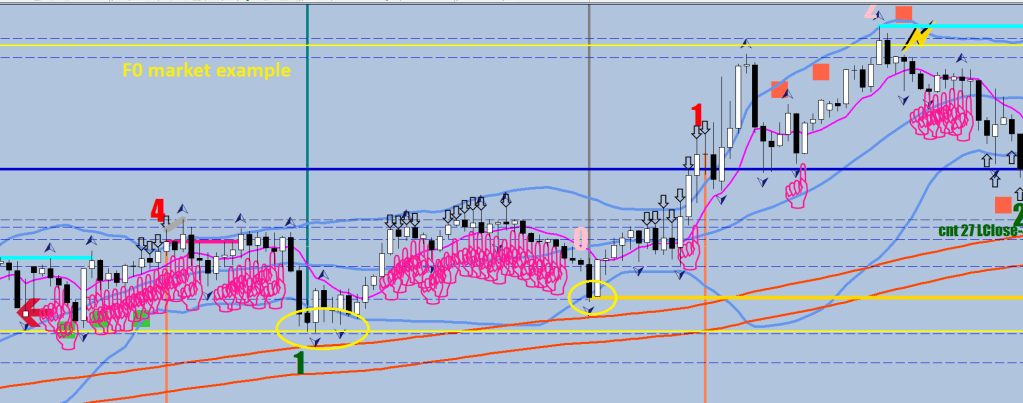
Touching down on the lower BB is a zeroing, a reset / start of new leg (yellow hoop). An F0 market may end in a Flash Gordon (momentum divergence).
As the market spins up, it changes character from F0 to F-1 (F-1: 14 out of the last 16 candles closed above/below the S-30). If you look at the image above, the market can be called qualified if one side prints values beyond 80 pips (200 sample distance of current price).
///F qualifier if (ExtATRBuffer[i]<-80) q[i]=-1; if (ExtATRBuffer2[i]>80) q[i]=1;
///C qualifier if (Close[i]<iMA(symbol,0,30,0,MODE_SMA,PRICE_MEDIAN,i)) c[i]=-1; if (Close[i]>iMA(symbol,0,30,0,MODE_SMA,PRICE_MEDIAN,i)) c[i]=1;
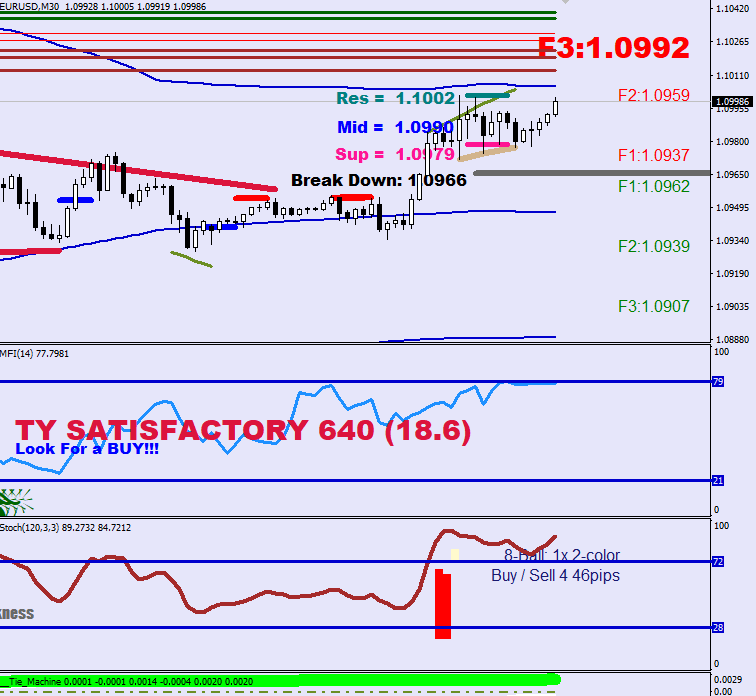
There are a lot of ways you can use the color scale (for the No. 1 plots). They are “hot green / red” if the price is beyond the 8EMO (and 14 out of the last 16 closes fall on one side of the S-30). Blue is a close back inside the 8EMO, but outside the the S-30. Black is a close back at the other side of the S-30. For instance, the continuation buys above are starting the black print. You may want to dump a little bit on the 3rd Green block – see ATR projection above for a winning combo.
if (q[i]==1 || q[i]==-1) {
///F0 market
   if (q[i]==1 && Close[i+2]>iBands(symbol,0,30,2,0,PRICE_MEDIAN,MODE_LOWER,i+2)) {ObjectCreate("CLOT"+IntegerToString(i),OBJ_TEXT, 3, Time[i], 24.5); ObjectSetText("CLOT"+IntegerToString(i), CharToStr(108), 24, "WingDings", clrSpringGreen);}
   if (q[i]==-1 && Close[i+2]<iBands(symbol,0,30,2,0,PRICE_MEDIAN,MODE_UPPER,i+2)){ObjectCreate("CLOT"+IntegerToString(i),OBJ_TEXT, 3, Time[i], 14.5); ObjectSetText("CLOT"+IntegerToString(i), CharToStr(108), 24, "WingDings", clrRed);}
/// F-1
   if (q[i]==1 && c[i]+c[i+1]+c[i+2]+c[i+3]+c[i+4]+c[i+5]+c[i+6]+c[i+7]+c[i+8]+c[i+9]+c[i+10]+c[i+11]+c[i+12]+c[i+13]+c[i+14]+c[i+15]>13) {ObjectCreate("CLOTS"+IntegerToString(i),OBJ_TEXT, 3, Time[i], 75.5); ObjectSetText("CLOTS"+IntegerToString(i), CharToStr(140), 24, "WingDings", clrSpringGreen); if (Close[i]<iMA(symbol,0,8,0,MODE_EMA,PRICE_OPEN,i)) ObjectSet("CLOTS"+IntegerToString(i), OBJPROP_COLOR, Blue); if (Close[i]<iMA(symbol,0,30,0,MODE_SMA,PRICE_MEDIAN,i)) ObjectSet("CLOTS"+IntegerToString(i), OBJPROP_COLOR, Black); }
   if (q[i]==-1 && c[i]+c[i+1]+c[i+2]+c[i+3]+c[i+4]+c[i+5]+c[i+6]+c[i+7]+c[i+8]+c[i+9]+c[i+10]+c[i+11]+c[i+12]+c[i+13]+c[i+14]+c[i+15]<-13) {ObjectCreate("CLOTS"+IntegerToString(i),OBJ_TEXT, 3, Time[i], -55.5); ObjectSetText("CLOTS"+IntegerToString(i), CharToStr(140), 24, "WingDings", clrRed);  if (Close[i]>iMA(symbol,0,8,0,MODE_EMA,PRICE_OPEN,i)) ObjectSet("CLOTS"+IntegerToString(i), OBJPROP_COLOR, Blue); if (Close[i]>iMA(symbol,0,30,0,MODE_SMA,PRICE_MEDIAN,i)) ObjectSet("CLOTS"+IntegerToString(i), OBJPROP_COLOR, Black);}
}
Chicane has a song called Middledistance Runner. It is good to know that there are other smartasses out there.
The Guy made a full time carrer of scamming. Not sure that he would die of natural causes.
What else would I be doing with this much time on my hands if not filtering?
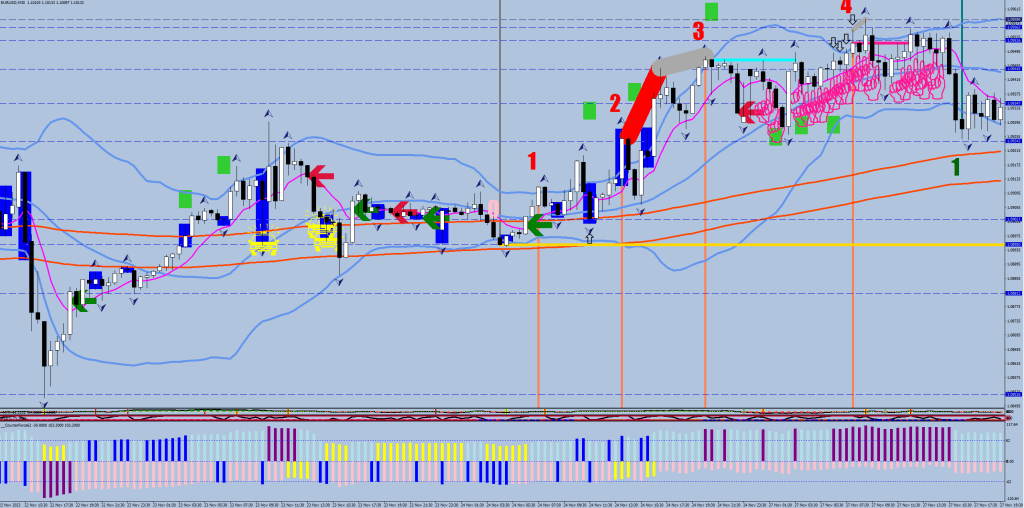
The orange stripes are the call buttons. Can be exact, but if not they are in the ballpark based on 2 oscillators and a bit of play around the 240 sample Bollinger. Add on for the Bouncer. Beam me down, Scotty.
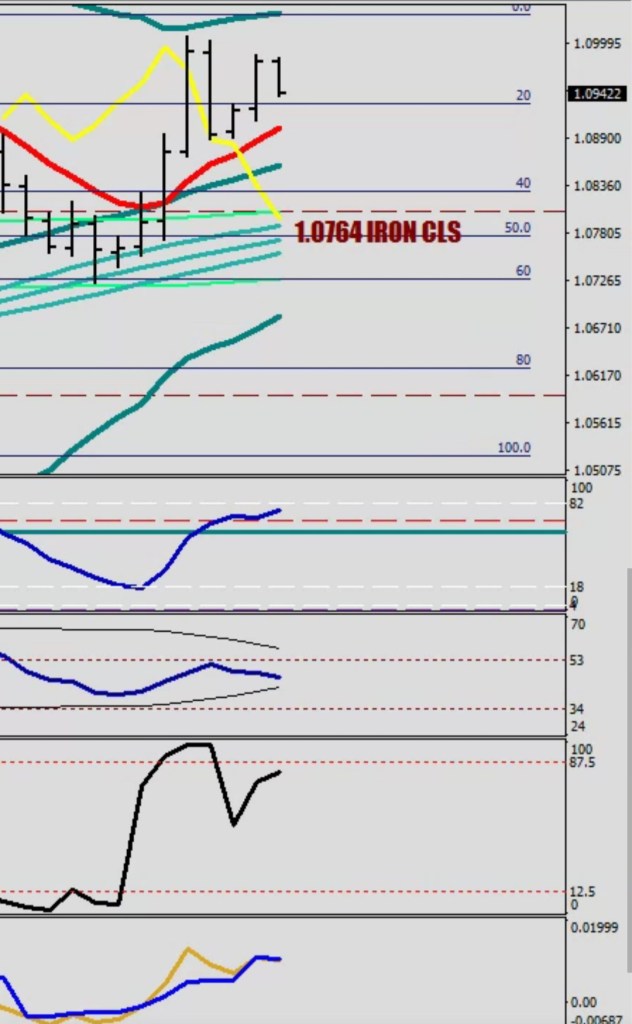
Now, more about the distance is the importance of the stretch from the most important mean.
Yea, that number measured by the Stretch Marker. Since this chart is always buried away, and that 2.8x stretch is a very important clue for a reversal taking place, I had to transplant this info some way.
It is only the last print, but at least it is there with a DeepPink highlight as a reminder on a main chart now.
Thems be the tools for going in to war this coming year. I added the following to the Bouncer.
deletetxt1(“Vignetta”);
int twodigits = MathAbs((High[0]-iMA(NULL,0,414,0,MODE_EMA, PRICE_HIGH,0))/FMax*10000)*100; if (Close[0]<iMA(symbol,0,414,0,MODE_EMA,PRICE_MEDIAN,0)) MathAbs((iMA(NULL,0,414,0,MODE_EMA, PRICE_LOW,0)-Low[0])/FMax*10000)*100;
int hundreds = round(twodigits/100); twodigits = twodigits-hundreds*100;
int tens = round(twodigits/10); int ones = twodigits-tens*10;
string shundreds, stens, sones;
switch(hundreds) { case 1: shundreds=CharToStr(140); break; case 2: shundreds=CharToStr(141); break; case 3: shundreds=CharToStr(142); break; case 4: shundreds=CharToStr(143); break; case 5: shundreds=CharToStr(144); break; case 6: shundreds=CharToStr(145); break; case 7: shundreds=CharToStr(146); break; case 8: shundreds=CharToStr(147); break; case 9: shundreds=CharToStr(148); break; default: shundreds=CharToStr(139); break; }
switch(tens) { case 1: stens=CharToStr(140); break; case 2: stens=CharToStr(141); break; case 3: stens=CharToStr(142); break; case 4: stens=CharToStr(143); break; case 5: stens=CharToStr(144); break; case 6: stens=CharToStr(145); break; case 7: stens=CharToStr(146); break; case 8: stens=CharToStr(147); break; case 9: stens=CharToStr(148); break; default: stens=CharToStr(139); break; }
switch(ones) { case 1: sones=CharToStr(140); break; case 2: sones=CharToStr(141); break; case 3: sones=CharToStr(142); break; case 4: sones=CharToStr(143); break; case 5: sones=CharToStr(144); break; case 6: sones=CharToStr(145); break; case 7: sones=CharToStr(146); break; case 8: sones=CharToStr(147); break; case 9: sones=CharToStr(148); break; default: sones=CharToStr(139); break; }
if (Period()==30) E16[i]=iMA(NULL,0,32,0,MODE_EMA, PRICE_MEDIAN,i); else E16[i]=iMA(NULL,0,16,0,MODE_EMA, PRICE_MEDIAN,i);
if (Period()==60) E32L[i]=iMA(NULL,0,32,0,MODE_EMA, PRICE_MEDIAN,i); else E32L[i]=iMA(NULL,0,32*2,0,MODE_EMA, PRICE_MEDIAN,i);
e16d1[i]=E16[i]+450*Point;
e16d2[i]=E16[i]-450*Point;
if (iMA(NULL,60,67,0,MODE_EMA, PRICE_HIGH,0)>iMA(NULL,60,207,0,MODE_EMA, PRICE_HIGH,0)) e16d4[i]=e16d2[i]; if (iMA(NULL,60,67,0,MODE_EMA, PRICE_HIGH,0)<iMA(NULL,60,207,0,MODE_EMA, PRICE_HIGH,0)) e16d3[i]=e16d1[i];
So, to answer the question, who’s-where-the-why-what, here are the clues.
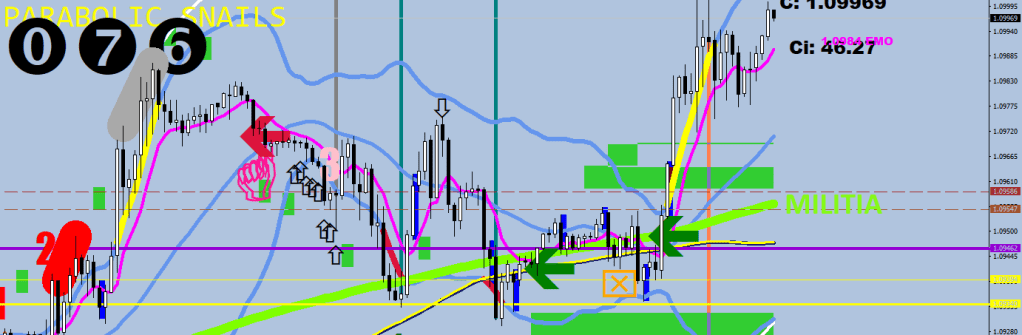
The enemy at the Guard Rails is militia. Shotguns for size.
The second line of defense is the municipals in the E207 trench (orange + addes white highlights). They roll with cannons.
Not a financial advice of course, just trying to prop up my own reaction time.
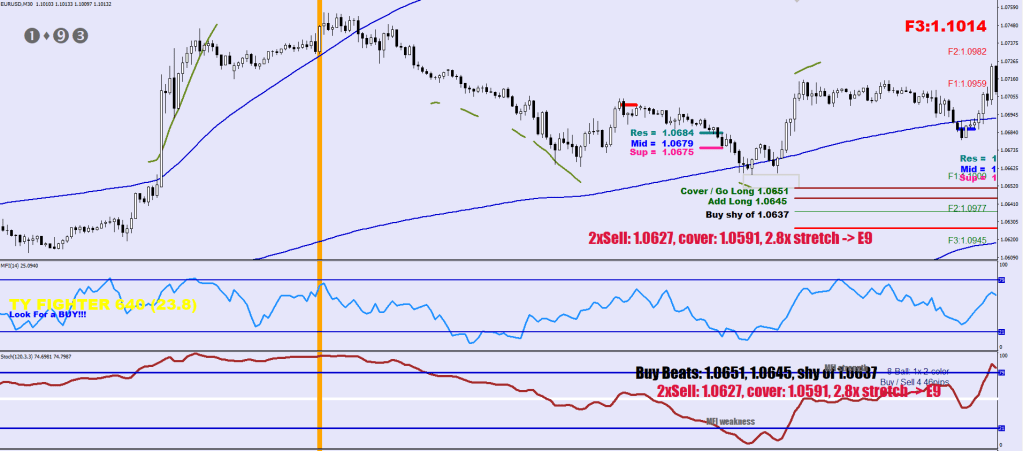
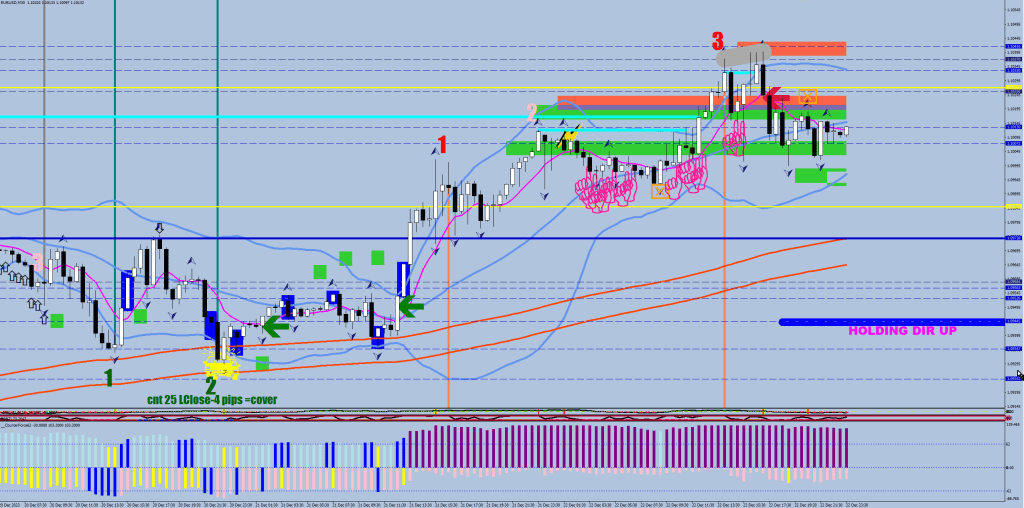
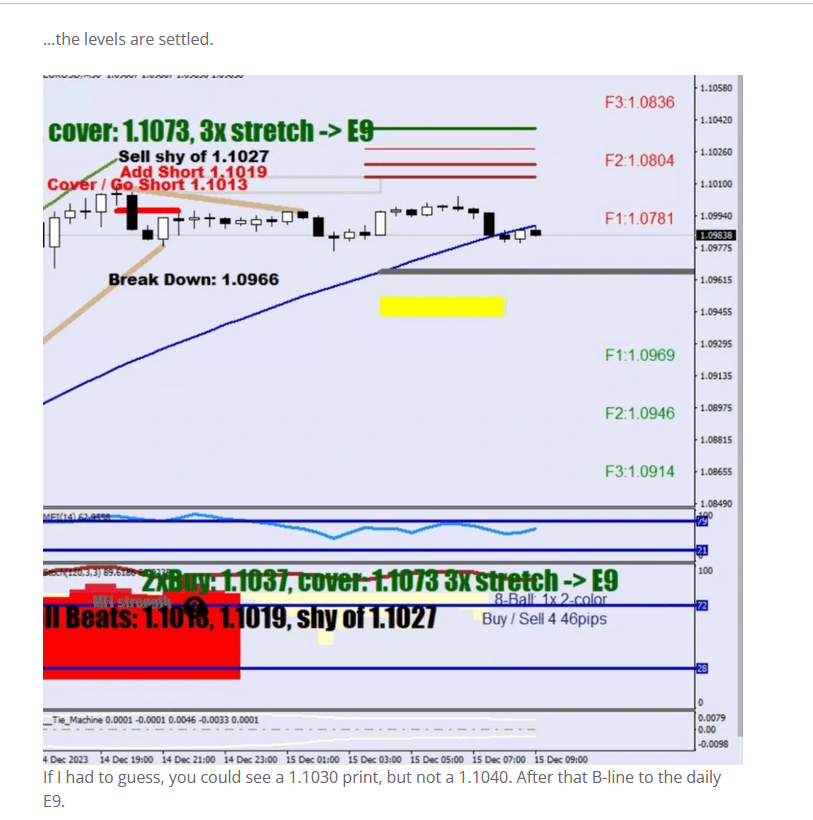
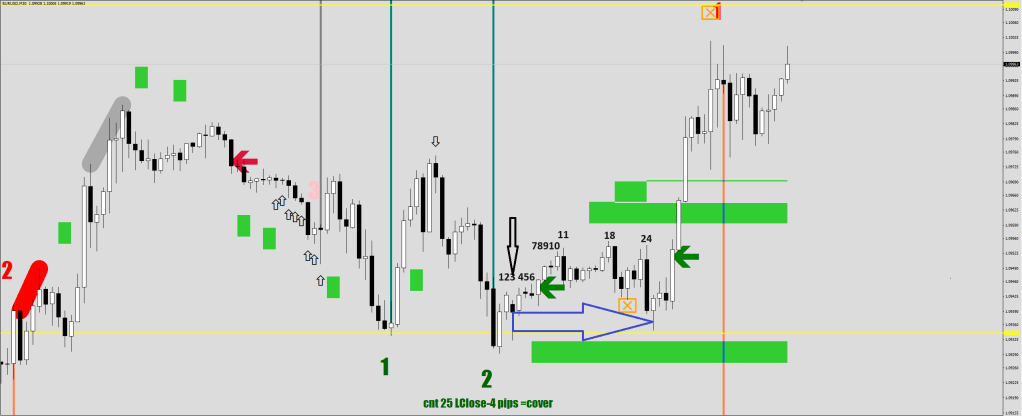
You’re gonna get a kick out of this. Only works on the downside. I plot “count 25, the lowest close minus 4 pips is the cover level” when the second progression low is made. Need to disregard the first couple of candles.
The close, 1.09394 (black arrow) suggested a buy at 1.09354. The actual low was 1.09353.
The overhead supply is at arm’s length. A spinner printed. Going lower and coming back up they might throw some kerosine on the fire at the mid point.
A self proclaimed “institute” is getting extra loud again. If you listen in on one of your 60k priced courses – I shit you not – this is what you get under “idea generation”. Ford is coming out with new Mustang. They like to buy leather seats with it. By call options on a random leather factory.
You would also have to surrender more than half of your profits, because they like to live for free lavishly (Singapore ain’t cheap), and also inside info costs money. We’re talking ex Goldman Sachs here.
Those are the edges at your disposal. Making up fairy tales or going full blown criminal.
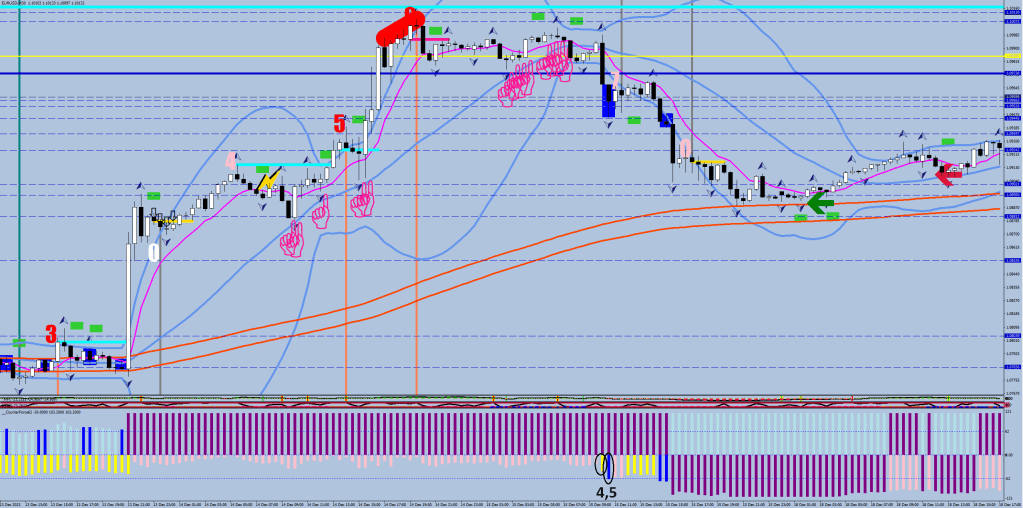
Now, with Forex you can have an edge by accurately classifying the market type based on the counter directional volatility (see CounterForce).
One thing you definitely don’t want to do is chasing a parabolic market when the daily max consolidation level is keep on moving away from you.
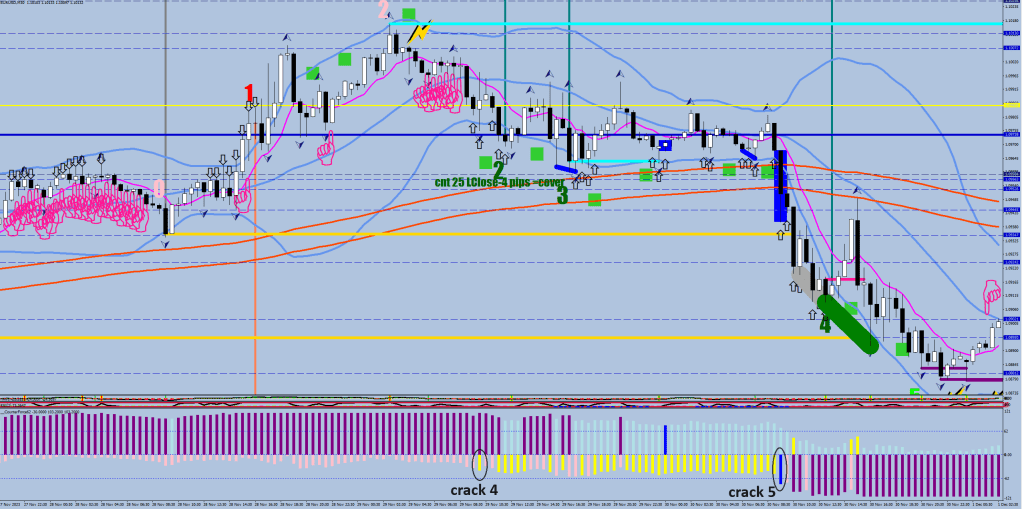
After the 3 cracks of the one side muted volatility, it is unsafe even thinking about a continuation.
Notice how the previous parabolic run only managed to find footing in this low volume environment only after 120-pips of a break, an RSI2 reversal divergence and all returns into the Bollinger were dragged out regressions not triggering the start of a downside progression count and nullifying the upside count the second time around.
Yes, there’s such thing as an F0 market, where the counter dir vol does not reach 40 pips, still it manages to get ouside the BB – this is not it, for this was right after another parabolic phase.
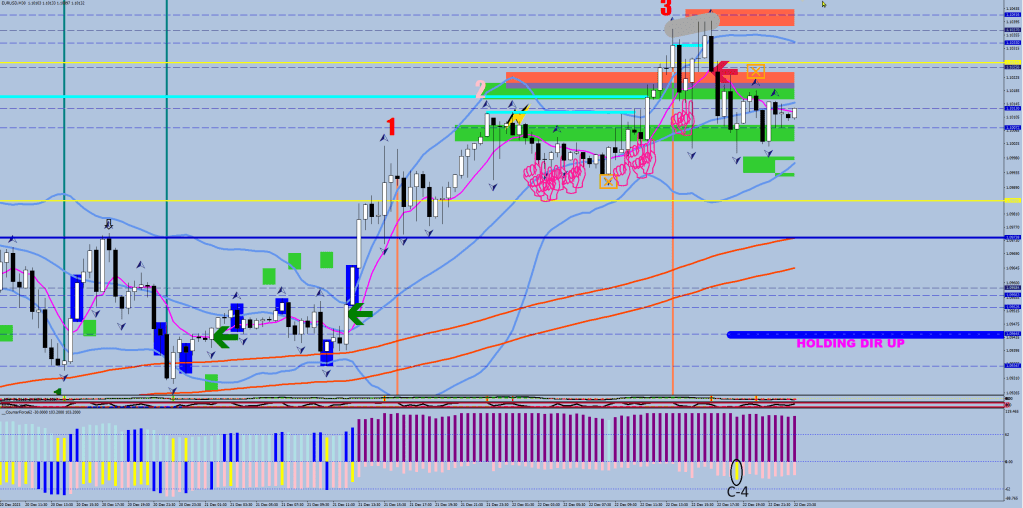
To answer the question of “are you in a push” without getting enegy measurements involved, the breach (and a decisive close outside) of the weekly 14-sample window envelope and 50% larger range than the previous week are good telltales.
Weekly R1 is 1.0973. White hand = fake push, did not manage to close outside far enough.