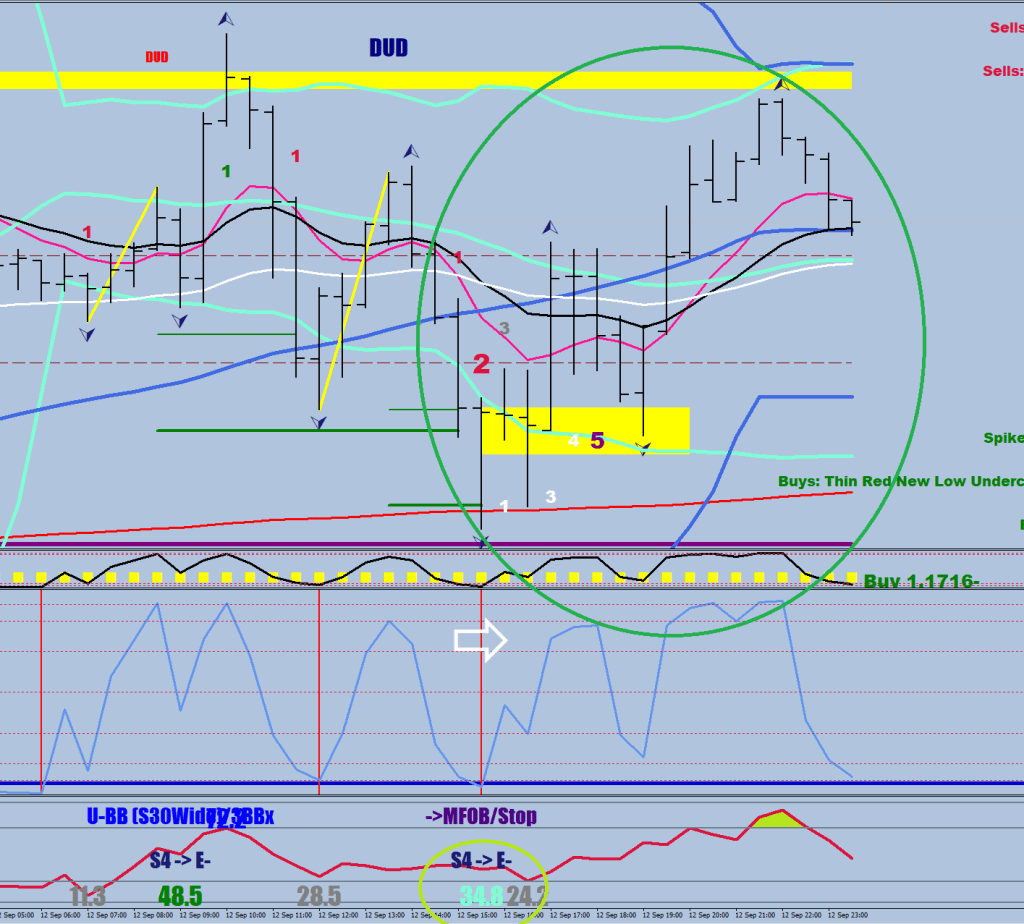
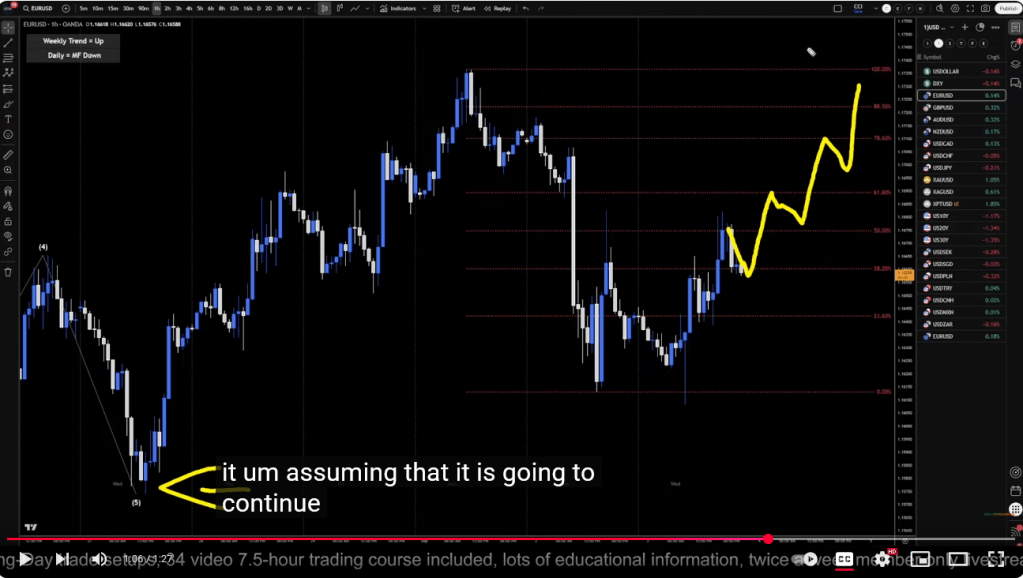
I have been ignoring some charts and signs, but things are getting abnormal here.
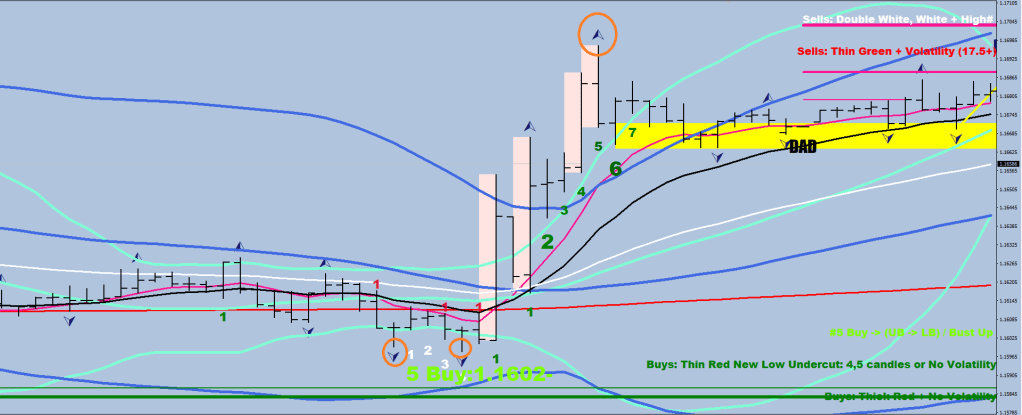
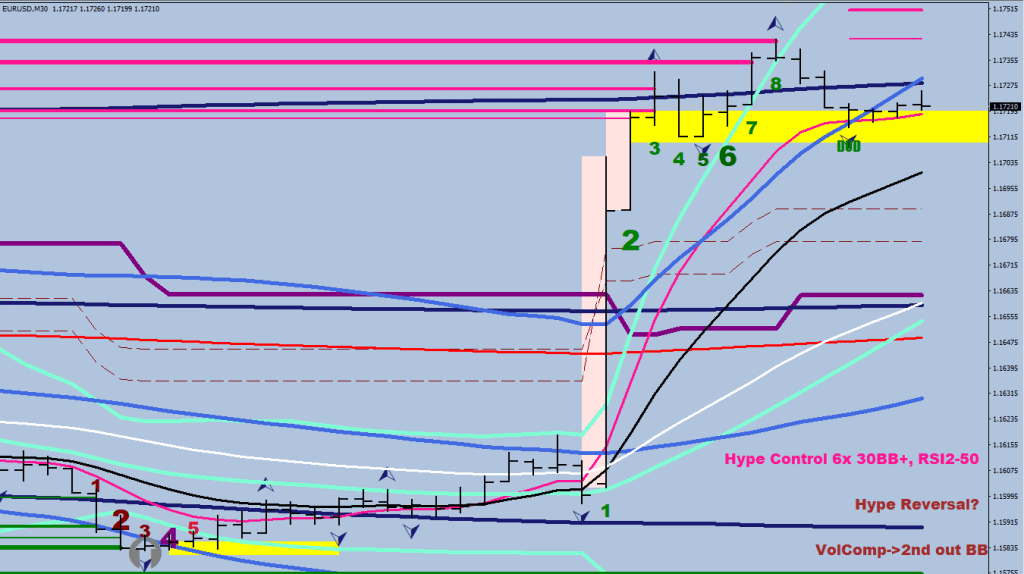
The market is about to print a volatility compression anchor to the upside (@ 3 or so currently).
That is not a final high, only a divergence after could be.
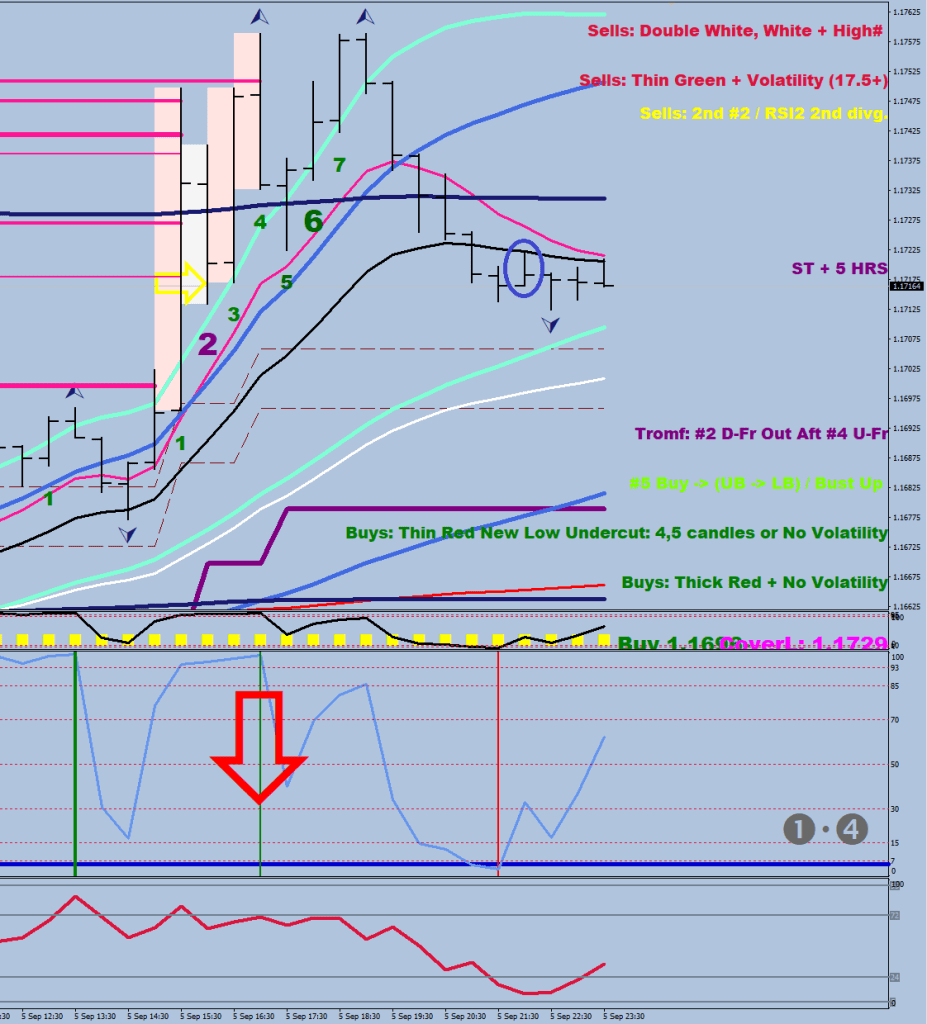
Note the last peak, which printed a yellow divergence relative to the lowest compression-read in recent history, a 5.2 reading.
A sharp divergence next is a possibility, but it still would have to be 3+ hours away. The separation from the hourly 8 EMO isn’t great at all here.
The ideal return would be a divergent compression print with a higher high and the price taking its time before (2+ hours -> gray divergence) before getting back below the 8 EMO.
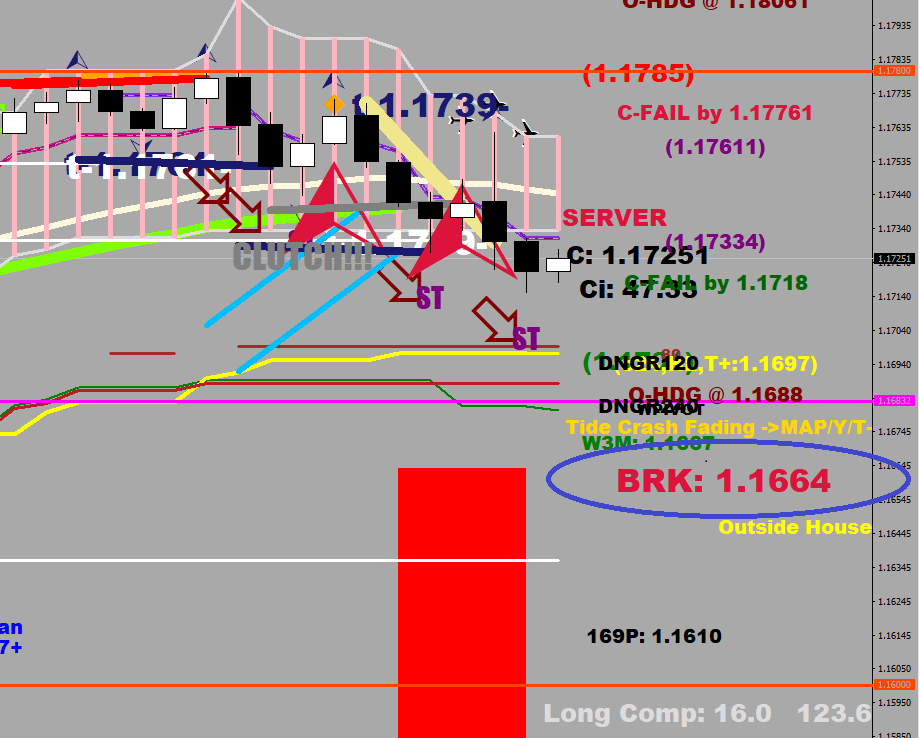
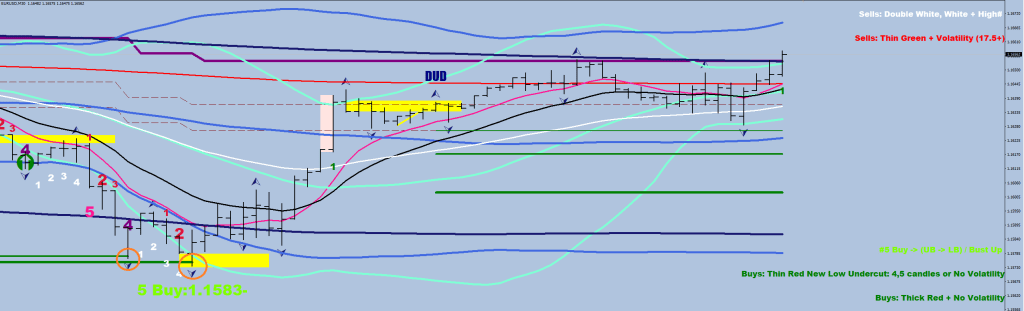
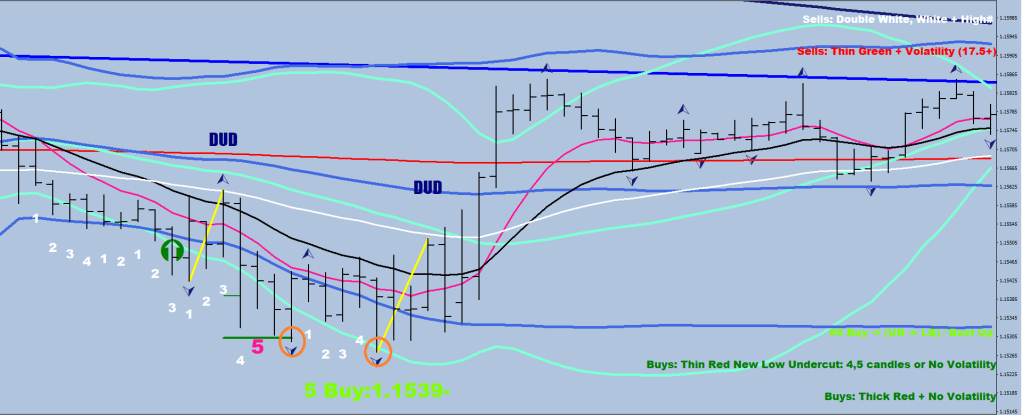
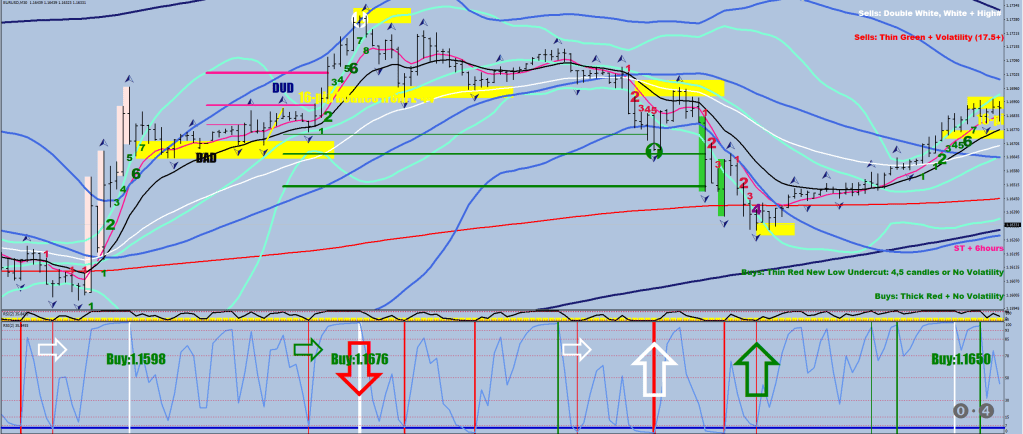
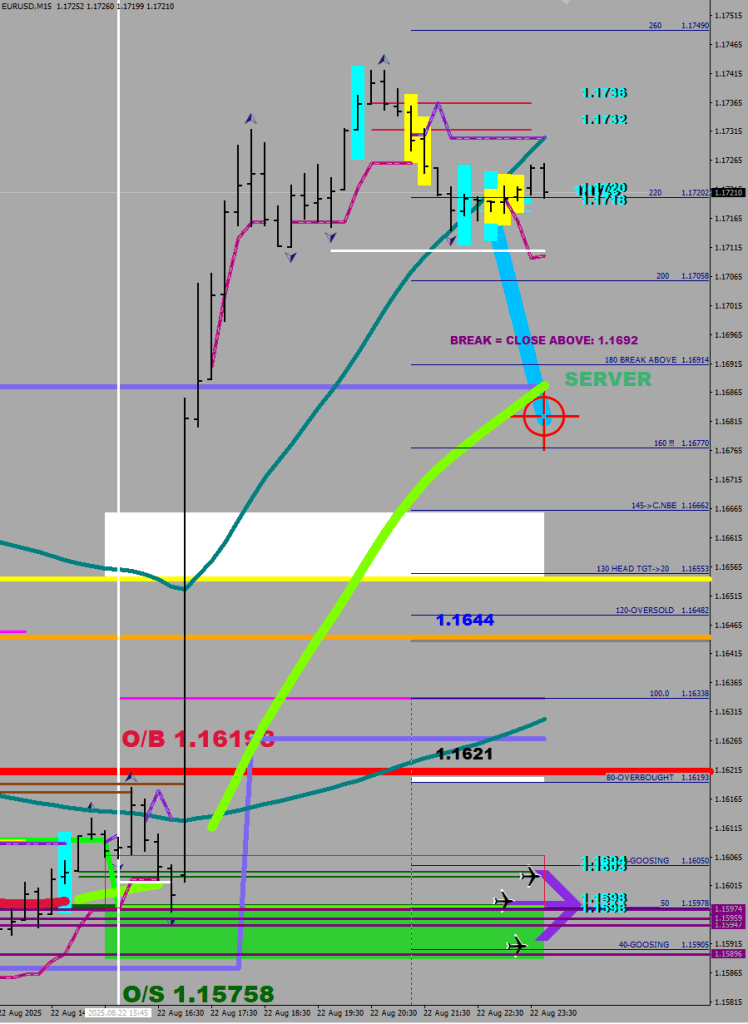
The other thing to mention is how the pullback was holding above the S1 on closing-basis (see blue oval); you have to get yourself trained for the lines to be read in an upside-down manner with this indicator when going up.
Intermission. For those not in favour of my burdensome lyrics and poetry, there is a way to enjoy my purely instrumental works with this playlist:
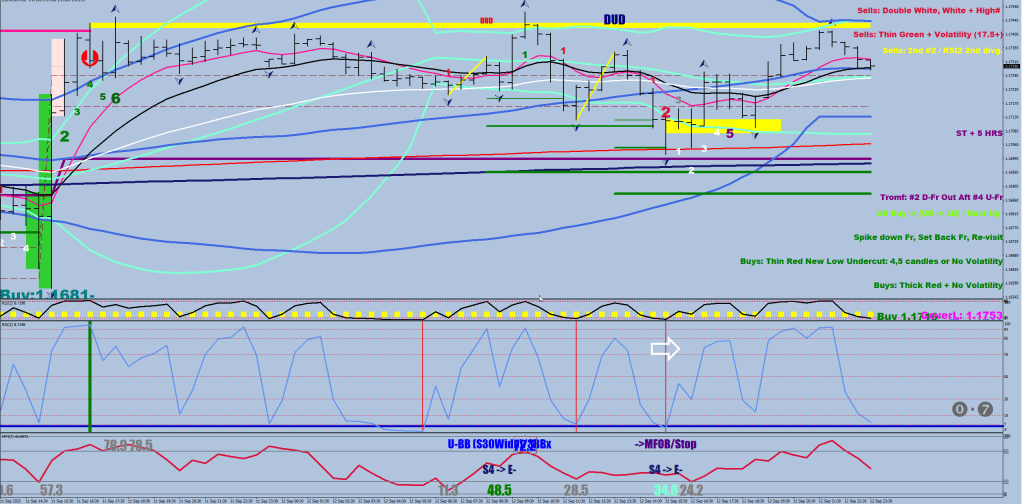
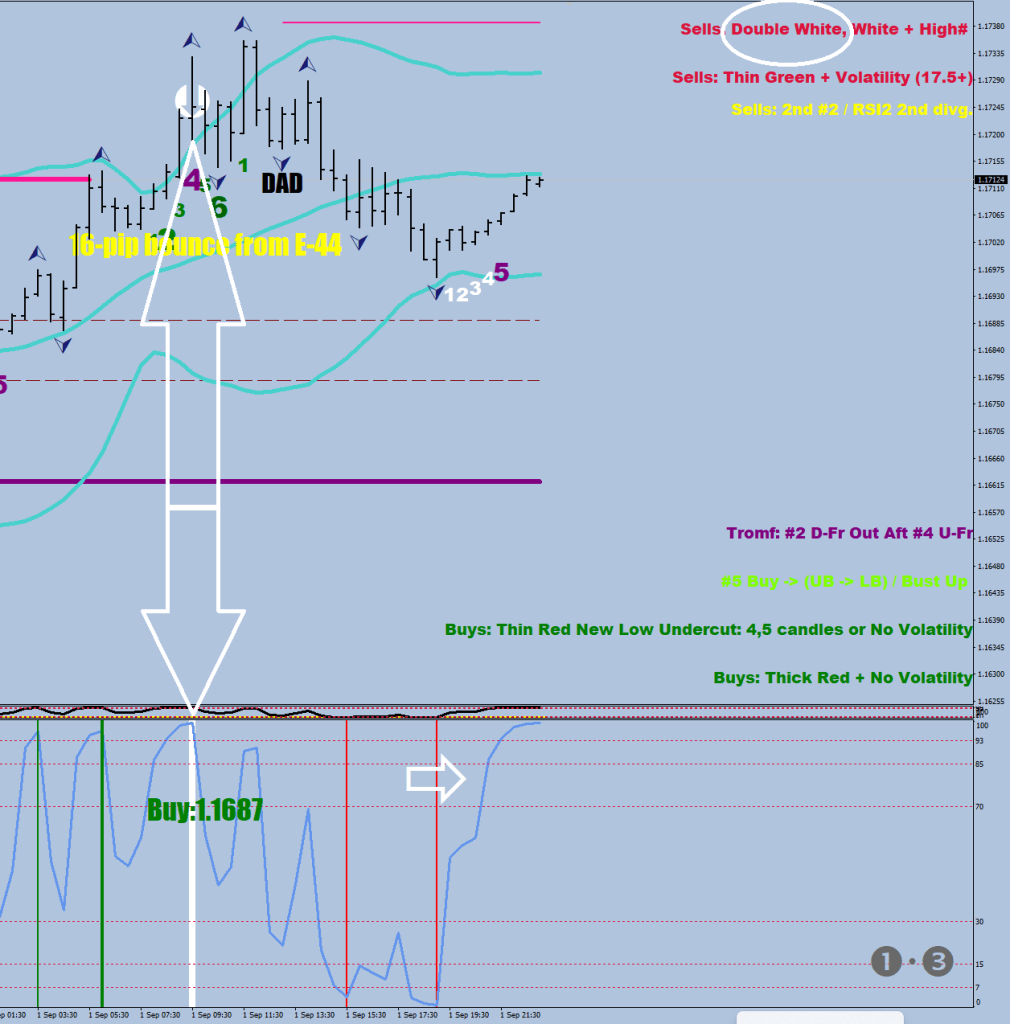
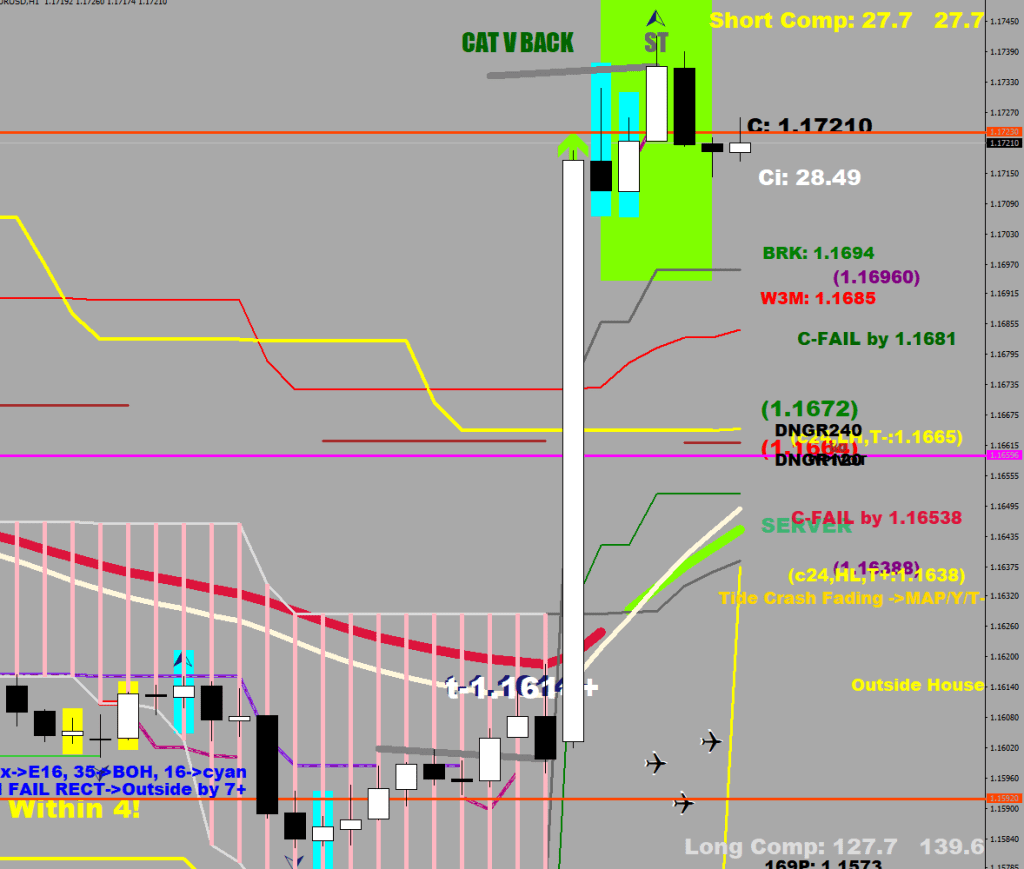
& there is the volatility anchor vertical mark-up
I know there are a lot of surplus plots and unexplained things here, but here’s a working copy of the file I have:
#property copyright "Copyright © 2024, Macdulio"
#property link "https://forexfore.blog"
#property description "V1.0"
#property description "Vax"
#property strict
//--- indicator settings
#property indicator_separate_window
#property indicator_buffers 3
#property indicator_color1 clrRed
#property indicator_color2 clrGreen
#property indicator_color3 clrPurple
#property indicator_color4 clrBlue
#property indicator_color5 clrRed
#property indicator_color6 clrDarkKhaki
#property indicator_color7 clrWhite
#property indicator_level1 0
#property indicator_level2 41
#property indicator_level3 62
#property indicator_level4 93
#property indicator_level5 166
#property indicator_level6 266
#property indicator_levelcolor clrBlue
#property indicator_levelstyle STYLE_DOT
//extern double valuetomonitor = 5.5;
extern int lookback = 400;
extern int dotplot = 100;
extern int indicator_window = 1;
extern int sample = 200;
extern double FSize=32;
double upper[], middle[], lower[];
double avg;
double FMax = FSize*6/5;
double iHi4[];
double iLo4[];
double CI[];
string symbol = Symbol();
double ExtATRBuffer[],ExtATRBuffer2[],ExtATRBuffer3[],ExtATRBuffer4[],ExtATRBuffer5[],stoch60[];
double corr[],corr2[], RSI2[], squeeze[], ExtATRBufferf[],ExtATRBuffer2f[];
bool Anchor[];
double ExtMapBuffer[], tensharp[];
int pit[],dir[], magenta[];
int init(){
SetIndexBuffer(0,ExtATRBuffer);
SetIndexStyle(0,DRAW_LINE,STYLE_SOLID,4,indicator_color1);
SetIndexBuffer(1,ExtATRBuffer2);
SetIndexStyle(1,DRAW_LINE,STYLE_SOLID,4,indicator_color2);
return(0);
}
//+------------------------------------------------------------------+
//| Average True Range |
//+------------------------------------------------------------------+
int start(){
ArrayResize(tensharp, Bars);
ArrayInitialize(tensharp, EMPTY_VALUE);
ArrayResize(ExtATRBuffer, Bars);
ArrayInitialize(ExtATRBuffer, EMPTY_VALUE);
ArrayResize(ExtATRBuffer2, Bars);
ArrayInitialize(ExtATRBuffer2, EMPTY_VALUE);
ArrayResize(ExtATRBufferf, Bars);
ArrayInitialize(ExtATRBufferf, EMPTY_VALUE);
ArrayResize(ExtATRBuffer2f, Bars);
ArrayInitialize(ExtATRBuffer2f, EMPTY_VALUE);
ArrayResize(ExtATRBuffer3, Bars);
ArrayInitialize(ExtATRBuffer3, EMPTY_VALUE);
ArrayResize(ExtATRBuffer4, Bars);
ArrayInitialize(ExtATRBuffer4, EMPTY_VALUE);
ArrayResize(ExtATRBuffer5, Bars);
ArrayInitialize(ExtATRBuffer5, EMPTY_VALUE);
ArrayResize(iHi4, Bars);
ArrayInitialize(iHi4, EMPTY_VALUE);
ArrayResize(iLo4, Bars);
ArrayInitialize(iLo4, EMPTY_VALUE);
ArrayResize(stoch60, Bars);
ArrayInitialize(stoch60, EMPTY_VALUE);
ArrayResize(RSI2, Bars);
ArrayInitialize(RSI2, EMPTY_VALUE);
ArrayResize(corr, Bars);
ArrayInitialize(corr, EMPTY_VALUE);
ArrayResize(corr2, Bars);
ArrayInitialize(corr2, EMPTY_VALUE);
ArrayResize(middle, Bars);
ArrayInitialize(middle, EMPTY_VALUE);
ArrayResize(squeeze, Bars);
ArrayInitialize(squeeze, 0);
ArrayResize(upper, Bars);
ArrayInitialize(upper, EMPTY_VALUE);
ArrayResize(lower, Bars);
ArrayInitialize(lower, EMPTY_VALUE);
ArrayResize(Anchor, Bars);
ArrayInitialize(Anchor, false);
ArrayResize(magenta, Bars);
ArrayInitialize(magenta, 0);
ArrayResize(CI, Bars);
ArrayInitialize(CI, 0);
ArrayResize(ExtMapBuffer, Bars);
ArrayInitialize(ExtMapBuffer, 0);
ArrayResize(pit, Bars);
ArrayInitialize(pit,0);
ArrayResize(dir, Bars);
ArrayInitialize(dir,0);
int i,j,k;
double level;
deletetxt1("Zingi");
for(i=Bars-100; i>=0; i--){
if (Period()==240) iHi4[i]=iMA(NULL,0,52,0,MODE_EMA, PRICE_HIGH,i);
else if (Period()==30) iHi4[i]=iMA(NULL,0,414,0,MODE_EMA, PRICE_HIGH,i);
else if (Period()==60) iHi4[i]=iMA(NULL,0,207,0,MODE_EMA, PRICE_HIGH,i);
if (Period()==240) iLo4[i]=iMA(NULL,0,52,0,MODE_EMA, PRICE_LOW,i);
else if (Period()==30) iLo4[i]=iMA(NULL,0,414,0,MODE_EMA, PRICE_LOW,i);
else if (Period()==60) iLo4[i]=iMA(NULL,0,207,0,MODE_EMA, PRICE_LOW,i);
stoch60[i]=iStochastic(symbol,60,60,3,3,MODE_SMA,0,MODE_SIGNAL,i);
RSI2[i]=iRSI(symbol,0,2,PRICE_MEDIAN,i);
CI[i]=ChoppinessIndex(7,i);
if(CI[i]>69 && CI[i+1]>69 && CI[i+2]<65 && CI[i+3]<65) {
if (indicator_window>2) ObjectCreate("Zingi"+IntegerToString(i), OBJ_TEXT, 2, Time[i+5], 60);
else ObjectCreate("Zingi"+IntegerToString(i), OBJ_TEXT, indicator_window, Time[i+5], 60);
ObjectSetText("Zingi"+IntegerToString(i), "E/H Accelerator! Look 4 vol shlf in 100", 16, "Impact", Purple);
ObjectCreate("Zingis"+IntegerToString(i), OBJ_TEXT, indicator_window, Time[i+5], 40);
ObjectSetText("Zingis"+IntegerToString(i), "Scale to size in fresh OB/OS", 16, "Impact", Purple);
}
if (Period()==60 && i<10) {
int x=sample; if (x>30) x=10;
tensharp[i]=iLow(symbol,0,iLowest(symbol,0,MODE_LOW,x,i))+520*Point;
if (Close[i]<iMA(symbol,0,240,0,MODE_EMA,PRICE_MEDIAN,i)) tensharp[i]=iHigh(symbol,0,iHighest(symbol,0,MODE_HIGH,x,i))-520*Point;
}
}
deletetxt1("Dipper");
deletetxt1("Panace");
deletetxt1("PLOT");
deletetxt1("MLINE");
for(i=lookback; i>=0; i--){
middle[i] = iMA(NULL, 0, 20, 0, MODE_SMA, PRICE_TYPICAL, i);
avg = findAvg(20, i);
upper[i] = middle[i] + avg;
lower[i] = middle[i] - avg;
ExtATRBuffer[i]= -1*(iHigh(symbol,0,iHighest(symbol,0,MODE_HIGH,sample-1,i+1))-Low[i])*-10000;
ExtATRBuffer2[i]=(High[i]-iLow(symbol,0,iLowest(symbol,0,MODE_LOW,sample-1,i+1)))*10000;
ExtATRBufferf[i]= -1*(iHigh(symbol,0,iHighest(symbol,0,MODE_HIGH,200-1,i+1))-Low[i])*-10000;
ExtATRBuffer2f[i]=(High[i]-iLow(symbol,0,iLowest(symbol,0,MODE_LOW,200-1,i+1)))*10000;
///S3 broken
if (ExtATRBufferf[i]>94 && ExtATRBufferf[i+1]>94 && ExtATRBufferf[i+2]>94 && ExtATRBufferf[i+3]<94 && Close[i]<Open[i]){
ObjectCreate("MLINE"+IntegerToString(i),OBJ_VLINE,indicator_window, Time[i], 0);
ObjectSet("MLINE"+IntegerToString(i),OBJPROP_COLOR,clrRed );
ObjectSet("MLINE"+IntegerToString(i),OBJPROP_WIDTH,12);
ObjectSet("MLINE"+IntegerToString(i),OBJPROP_STYLE,STYLE_DOT);
ObjectSet("MLINE"+IntegerToString(i),OBJPROP_BACK,1);}
//R3 reclaimed
if (ExtATRBuffer2f[i]<94 && ExtATRBuffer2f[i+1]<94 && ExtATRBuffer2f[i+2]<94 && ExtATRBuffer2f[i+3]>94 && ExtATRBuffer2f[i+4]>94 && ExtATRBuffer2f[i+5]>94 && Close[i]<Open[i]){
ObjectCreate("MLINE"+IntegerToString(i),OBJ_VLINE,indicator_window, Time[i], 0);
ObjectSet("MLINE"+IntegerToString(i),OBJPROP_COLOR,clrRed );
ObjectSet("MLINE"+IntegerToString(i),OBJPROP_WIDTH,12);
ObjectSet("MLINE"+IntegerToString(i),OBJPROP_STYLE,STYLE_DOT);
ObjectSet("MLINE"+IntegerToString(i),OBJPROP_BACK,1);}
///S3 reclaimed
if (ExtATRBufferf[i]<94 && ExtATRBufferf[i+1]<94 && ExtATRBufferf[i+2]<94 && ExtATRBufferf[i+3]>94 && ExtATRBufferf[i+4]>94 && Close[i]>Open[i]){
ObjectCreate("MLINE"+IntegerToString(i),OBJ_VLINE,indicator_window, Time[i], 0);
ObjectSet("MLINE"+IntegerToString(i),OBJPROP_COLOR,clrMediumSpringGreen );
ObjectSet("MLINE"+IntegerToString(i),OBJPROP_WIDTH,12);
ObjectSet("MLINE"+IntegerToString(i),OBJPROP_STYLE,STYLE_DOT);
ObjectSet("MLINE"+IntegerToString(i),OBJPROP_BACK,1);}
//R3 broken
if (ExtATRBuffer2f[i]>94 && ExtATRBuffer2f[i+1]>94 && ExtATRBuffer2f[i+2]>94 && ExtATRBuffer2f[i+3]<94 && Close[i]>Open[i]){
ObjectCreate("MLINE"+IntegerToString(i),OBJ_VLINE,indicator_window, Time[i], 0);
ObjectSet("MLINE"+IntegerToString(i),OBJPROP_COLOR,clrMediumSpringGreen );
if (ExtATRBufferf[i]<110) ObjectSet("MLINE"+IntegerToString(i),OBJPROP_COLOR,clrYellow );
ObjectSet("MLINE"+IntegerToString(i),OBJPROP_WIDTH,12);
ObjectSet("MLINE"+IntegerToString(i),OBJPROP_STYLE,STYLE_DOT);
ObjectSet("MLINE"+IntegerToString(i),OBJPROP_BACK,1);}
if (ExtATRBuffer[ArrayMaximum(ExtATRBuffer,14,i+1)]<50 && ExtATRBuffer[i]>47){
ObjectCreate("Dipper"+IntegerToString(i), OBJ_TREND, indicator_window, Time[i], ExtATRBuffer[i], Time[i], 31);
ObjectSetInteger(0,"Dipper"+IntegerToString(i),OBJPROP_COLOR,clrOrange);
ObjectSet("Dipper"+IntegerToString(i),OBJPROP_BACK,1);
ObjectSet("Dipper"+IntegerToString(i),OBJPROP_RAY_RIGHT,false);
ObjectSet("Dipper"+IntegerToString(i),OBJPROP_WIDTH,14); }
if (ExtATRBuffer[ArrayMaximum(ExtATRBuffer,45,i+1)]<50 && ExtATRBuffer[i]>50){
ObjectCreate("Dipper"+IntegerToString(i), OBJ_TREND, indicator_window, Time[i], ExtATRBuffer[i], Time[i], 31);
ObjectSetInteger(0,"Dipper"+IntegerToString(i),OBJPROP_COLOR,clrBlue);
ObjectSet("Dipper"+IntegerToString(i),OBJPROP_BACK,1);
ObjectSet("Dipper"+IntegerToString(i),OBJPROP_RAY_RIGHT,false);
ObjectSet("Dipper"+IntegerToString(i),OBJPROP_WIDTH,14);
}
if (ExtATRBuffer2[ArrayMaximum(ExtATRBuffer2,14,i+1)]<50 && ExtATRBuffer2[i]>47){
ObjectCreate("Dipper"+IntegerToString(i), OBJ_TREND, indicator_window, Time[i], ExtATRBuffer2[i], Time[i], 31);
ObjectSetInteger(0,"Dipper"+IntegerToString(i),OBJPROP_COLOR,clrYellow);
ObjectSet("Dipper"+IntegerToString(i),OBJPROP_BACK,1);
ObjectSet("Dipper"+IntegerToString(i),OBJPROP_RAY_RIGHT,false);
ObjectSet("Dipper"+IntegerToString(i),OBJPROP_WIDTH,14);
}
if (ExtATRBuffer2[ArrayMaximum(ExtATRBuffer2,42,i+1)]<50 && ExtATRBuffer2[i]>50){
ObjectCreate("Dipper"+IntegerToString(i), OBJ_TREND, indicator_window, Time[i], ExtATRBuffer2[i], Time[i], 31);
ObjectSetInteger(0,"Dipper"+IntegerToString(i),OBJPROP_COLOR,clrBlue);
ObjectSet("Dipper"+IntegerToString(i),OBJPROP_BACK,1);
ObjectSet("Dipper"+IntegerToString(i),OBJPROP_RAY_RIGHT,false);
ObjectSet("Dipper"+IntegerToString(i),OBJPROP_WIDTH,14);
}
if (ExtATRBuffer2[ArrayMaximum(ExtATRBuffer2,14,i+3)]<50 && ExtATRBuffer2[i+2]>47 && ExtATRBuffer2[i]<47){
ObjectCreate("Zingi"+IntegerToString(i), OBJ_TEXT, indicator_window, Time[i+5], 8);
ObjectSetText("Zingi"+IntegerToString(i), "5HRS 115PIPS LOAD UP!", 16, "Impact", Green); }
if (ExtATRBuffer2[ArrayMaximum(ExtATRBuffer2,42,i+3)]<50 && ExtATRBuffer2[i+2]>50 && ExtATRBuffer2[i]<50){
ObjectCreate("Zingi"+IntegerToString(i), OBJ_TEXT, indicator_window, Time[i+5], 18);
ObjectSetText("Zingi"+IntegerToString(i), "40HRS 70PIPS LOAD UP!", 16, "Impact", Green); }
if (ExtATRBuffer[ArrayMaximum(ExtATRBuffer,14,i+3)]<50 && ExtATRBuffer[i+2]>47 && ExtATRBuffer[i]<47){
ObjectCreate("Zingi"+IntegerToString(i), OBJ_TEXT, indicator_window, Time[i+5], 8);
ObjectSetText("Zingi"+IntegerToString(i), "5HRS 115PIPS LOAD UP!", 16, "Impact", Red); }
if (ExtATRBuffer[ArrayMaximum(ExtATRBuffer,45,i+3)]<50 && ExtATRBuffer[i+2]>50 && ExtATRBuffer[i]<50){
ObjectCreate("Zingi"+IntegerToString(i), OBJ_TEXT, indicator_window, Time[i+5], 18);
ObjectSetText("Zingi"+IntegerToString(i), "40HRS 70PIPS LOAD UP!", 16, "Impact", Red); }
}
deletetxt1("AverD");
int twodigits = NormalizeDouble(ExtATRBuffer2[0],0);
if (MathAbs(ExtATRBuffer[0])<ExtATRBuffer2[0]) twodigits = NormalizeDouble(MathAbs(ExtATRBuffer[0]),0);
//string tds = IntegerToString(twodigits);
int tens = round(twodigits/10);
int ones = twodigits-tens*10;
string stens, sones;
//Print("tens=",tens);
//Print("ones=",ones);
switch(tens)
{
case 1: stens=CharToStr(140);
break;
case 2: stens=CharToStr(141);
break;
case 3: stens=CharToStr(142);
break;
case 4: stens=CharToStr(143);
break;
case 5: stens=CharToStr(144);
break;
case 6: stens=CharToStr(145);
break;
case 7: stens=CharToStr(146);
break;
case 8: stens=CharToStr(147);
break;
case 9: stens=CharToStr(148);
break;
default: stens=CharToStr(139);
break;
}
//deletetxt1("AverD");
switch(ones)
{
case 1: sones=CharToStr(140);
break;
case 2: sones=CharToStr(141);
break;
case 3: sones=CharToStr(142);
break;
case 4: sones=CharToStr(143);
break;
case 5: sones=CharToStr(144);
break;
case 6: sones=CharToStr(145);
break;
case 7: sones=CharToStr(146);
break;
case 8: sones=CharToStr(147);
break;
case 9: sones=CharToStr(148);
break;
default: sones=CharToStr(139);
break;
}
string jointstring=stens+sones;
ObjectCreate("AverD",OBJ_LABEL,indicator_window, 0,0);
ObjectSet("AverD",OBJPROP_CORNER,3);
ObjectSet("AverD",OBJPROP_XDISTANCE,20);
ObjectSet("AverD",OBJPROP_YDISTANCE,27);
ObjectSetText("AverD",jointstring,40,"Wingdings",DimGray);
if (twodigits>30) ObjectSetText("AverD",jointstring,40,"Wingdings",Yellow);
if (twodigits>58) ObjectSetText("AverD",jointstring,40,"Wingdings",DeepPink);
deletetxt1("Crush");
deletetxt1("Leap");
deletetxt1("Frog");
deletetxt1("Countess");
deletetxt1("Missing");
deletetxt1("KAROLY");
deletetxt1("Firstpull");
deletetxt1("POT");
deletetxt1("LOTUS");
deletetxt1("HOT");
deletetxt1("LINUS");
int counter = 9;
if (Period()<1440){
for(i=lookback; i>=0; i--){
if (Period()==60 && sample==10){
dir[i]=dir[i+1];
if (ExtATRBuffer2[i]>42 && ExtATRBuffer2[i+1]<42 && ExtATRBuffer2[i+1]>=ExtATRBuffer2[i+4] && ExtATRBuffer[i+1]>5 && High[i]<iMA(symbol,0,240,0,MODE_SMA,PRICE_MEDIAN,i)
&& (Close[i+1]>iMA(symbol,0,8,0,MODE_EMA,PRICE_MEDIAN,i+1) || Low[i+1]<iMA(symbol,0,8,0,MODE_EMA,PRICE_MEDIAN,i+1)-500*Point)
){
ObjectCreate("HOTT"+i,OBJ_TEXT, 2, Time[i],ExtATRBuffer2[i]+5);
ObjectSetText("HOTT"+i,"+30..50", 26, "Impact", clrDarkGreen);
if (i>0) {ObjectCreate("HOTTS"+i,OBJ_TEXT, 0, Time[i+4],Close[i]+10*Point);
ObjectSetText("HOTTS"+i,"L@"+DoubleToStr(NormalizeDouble(Close[i],4),4), 19, "Impact", clrDarkGreen);}
}
///trending down
if (ExtATRBuffer2[i+1]>22 &&
ExtATRBuffer2[i+1]<31 && RSI2[i]<90 &&
ExtATRBuffer[i+2]>31 && ExtATRBuffer[i+1]<31 && ExtATRBuffer[i]<28 && ExtATRBuffer[ArrayMaximum(ExtATRBuffer,10,i)]>62
&& ExtATRBuffer2[i]>20
){
ObjectCreate("LINUS"+IntegerToString(i),OBJ_VLINE,1, Time[i], 0);
ObjectSet("LINUS"+IntegerToString(i),OBJPROP_COLOR,clrBrown);
ObjectSet("LINUS"+IntegerToString(i),OBJPROP_WIDTH,6);
ObjectSet("LINUS"+IntegerToString(i),OBJPROP_STYLE,STYLE_DOT);
ObjectSet("LINUS"+IntegerToString(i),OBJPROP_BACK,1);
ObjectCreate("LINUSZ"+IntegerToString(i),OBJ_TEXT, 1, Time[i],75);
ObjectSetText("LINUSZ"+IntegerToString(i),"Cut/OH: "+DoubleToStr(NormalizeDouble(High[i],4),4)+"+", 26, "Impact", clrCrimson);
dir[i]=-1;
}
else if (ExtATRBuffer[i]<19 &&
ExtATRBuffer[i+1]>31 && ExtATRBuffer[i+2]>31 && ExtATRBuffer[i+2]>53 ) dir[i]=0;
//trending down over
if (Close[i+1]<iBands(symbol,0,240,2,0,PRICE_MEDIAN,MODE_LOWER,i+1) && Close[i]>iBands(symbol,0,240,2,0,PRICE_MEDIAN,MODE_LOWER,i) && ExtATRBuffer[ArrayMaximum(ExtATRBuffer,40,i)]<45){
ObjectCreate("LINUS"+IntegerToString(i),OBJ_VLINE,1, Time[i], 0);
ObjectSet("LINUS"+IntegerToString(i),OBJPROP_COLOR,clrYellow);
ObjectSet("LINUS"+IntegerToString(i),OBJPROP_WIDTH,6);
ObjectSet("LINUS"+IntegerToString(i),OBJPROP_STYLE,STYLE_DOT);
ObjectSet("LINUS"+IntegerToString(i),OBJPROP_BACK,1);
ObjectCreate("LINUSZ"+IntegerToString(i),OBJ_TEXT, 1, Time[i],75);
ObjectSetText("LINUSZ"+IntegerToString(i),"Trend over?! Buy "+DoubleToStr(NormalizeDouble(Close[i],4),4)+"-", 26, "Impact", clrGreen);
dir[i]=0;
}
///trending up
if (
ExtATRBuffer[i+1]<31 && RSI2[i]>8 &&
ExtATRBuffer2[i+2]>31 && ExtATRBuffer2[i+1]<31 && ExtATRBuffer2[i]<28 && ExtATRBuffer2[ArrayMaximum(ExtATRBuffer2,10,i)]>62
&& ExtATRBuffer[i]<20
&& iBands(symbol,0,240,2,0,PRICE_MEDIAN,MODE_UPPER,i)-iBands(symbol,0,240,2,0,PRICE_MEDIAN,MODE_LOWER,i)>1000*Point
){
ObjectCreate("LINUS"+IntegerToString(i),OBJ_VLINE,1, Time[i], 0);
ObjectSet("LINUS"+IntegerToString(i),OBJPROP_COLOR,clrLimeGreen);
ObjectSet("LINUS"+IntegerToString(i),OBJPROP_WIDTH,6);
ObjectSet("LINUS"+IntegerToString(i),OBJPROP_STYLE,STYLE_DOT);
ObjectSet("LINUS"+IntegerToString(i),OBJPROP_BACK,1);
ObjectCreate("LINUSZ"+IntegerToString(i),OBJ_TEXT, 1, Time[i],75);
ObjectSetText("LINUSZ"+IntegerToString(i),"Cut/OH: "+DoubleToStr(NormalizeDouble(Low[i],4),4)+"-", 26, "Impact", clrGreen);
if (iBands(symbol,0,240,2,0,PRICE_MEDIAN,MODE_UPPER,i)-Open[i]<320*Point){
ObjectCreate("LINUSZZ"+IntegerToString(i),OBJ_TEXT, 1, Time[i],35);
ObjectSetText("LINUSZZ"+IntegerToString(i),"Upper Band Too Close - 40 pips setback: "+DoubleToStr(NormalizeDouble(Low[i]-360*Point,4),4)+"-", 26, "Impact", clrGreen);
}
if (Open[i]>iBands(symbol,0,240,2,0,PRICE_MEDIAN,MODE_UPPER,i)){
ObjectCreate("LINUSZZ"+IntegerToString(i),OBJ_TEXT, 1, Time[i],35);
ObjectSetText("LINUSZZ"+IntegerToString(i),"Last leg up - 100+ pips to be had", 26, "Impact", clrGreen);
}
dir[i]=1;
}
else if (ExtATRBuffer2[i]<24 &&
ExtATRBuffer2[i+1]>31 && ExtATRBuffer2[i+2]>31 && ExtATRBuffer2[i+2]>53 ) dir[i]=0;
///trending up over
if (Close[i+1]>iBands(symbol,0,240,2,0,PRICE_MEDIAN,MODE_UPPER,i+1) && Close[i]<iBands(symbol,0,240,2,0,PRICE_MEDIAN,MODE_UPPER,i) && ExtATRBuffer2[ArrayMaximum(ExtATRBuffer2,40,i+10)]<45 && ExtATRBuffer2[i]<41){
ObjectCreate("LINUS"+IntegerToString(i),OBJ_VLINE,1, Time[i], 0);
ObjectSet("LINUS"+IntegerToString(i),OBJPROP_COLOR,clrYellow);
ObjectSet("LINUS"+IntegerToString(i),OBJPROP_WIDTH,6);
ObjectSet("LINUS"+IntegerToString(i),OBJPROP_STYLE,STYLE_DOT);
ObjectSet("LINUS"+IntegerToString(i),OBJPROP_BACK,1);
ObjectCreate("LINUSZ"+IntegerToString(i),OBJ_TEXT, 1, Time[i],75);
ObjectSetText("LINUSZ"+IntegerToString(i),"Trend over?! Sell"+DoubleToStr(NormalizeDouble(High[i],4),4)+"+", 26, "Impact", clrRed);
dir[i]=0;
}
}
//// fractal + 4 evaluator downside
if (Low[i+4]<iBands(symbol,0,30,2,0,PRICE_MEDIAN,MODE_LOWER,i+4) && iFractals(symbol,0,MODE_LOWER,i+4) && (iBands(symbol,0,30,2,0,PRICE_MEDIAN,MODE_UPPER,i)-iBands(symbol,0,30,2,0,PRICE_MEDIAN,MODE_LOWER,i))>400*Point)
{
ObjectCreate("HOT"+i,OBJ_TEXT, 0, Time[i],Low[i]-90*Point);
ObjectSetText("HOT"+i,"N-¾", 26, "Impact", clrGreen);
if (Low[i]<iMA(symbol,0,356,0,MODE_SMA,PRICE_MEDIAN,i)) ObjectSetText("HOT"+i,"N-¾", 16, "Impact", clrMagenta);
if (High[i]<iMA(symbol,0,8,0,MODE_EMA,PRICE_OPEN,i) && Open[i]>Close[i]) ObjectSetText("HOT"+i,CharToStr(234), 26, "Wingdings", clrRed);
if (Close[i]>iMA(symbol,0,8,0,MODE_EMA,PRICE_OPEN,i)-20*Point && Open[i]<Close[i] && ExtATRBuffer2[i]>25 && (ExtATRBuffer2[i]<41 || ExtATRBuffer2[i]>110)) ObjectSetText("HOT"+i,CharToStr(233), 26, "Wingdings", clrGreen);
}
//// fractal + 4 evaluator upside
if (High[i+4]==iHigh(symbol,0,iHighest(symbol,0,MODE_HIGH,8,i+1)) &&
High[i+4]>iBands(symbol,0,30,2,0,PRICE_MEDIAN,MODE_UPPER,i+4) && iFractals(symbol,0,MODE_UPPER,i+4) &&
(iBands(symbol,0,30,2,0,PRICE_MEDIAN,MODE_UPPER,i)-iBands(symbol,0,30,2,0,PRICE_MEDIAN,MODE_LOWER,i))>400*Point)
{
ObjectCreate("HOT"+i,OBJ_TEXT, 0, Time[i],High[i]+90*Point);
ObjectSetText("HOT"+i,"N-¾", 16, "Impact", clrMagenta);
if (High[i]<iMA(symbol,0,356,0,MODE_SMA,PRICE_MEDIAN,i)) ObjectSetText("HOT"+i,"N-¾", 26, "Impact", clrRed);
if (Low[i]>iMA(symbol,0,8,0,MODE_EMA,PRICE_OPEN,i) && Open[i]<Close[i]) ObjectSetText("HOT"+i,CharToStr(233), 26, "Wingdings", clrGreen);
if (Close[i]<iMA(symbol,0,8,0,MODE_EMA,PRICE_OPEN,i) && Open[i]>Close[i] && ExtATRBuffer[i]>25 && (ExtATRBuffer[i]<41 || ExtATRBuffer[i]>110) && Low[i+3]<iBands(symbol,0,30,2,0,PRICE_MEDIAN,MODE_UPPER,i+3) && Open[i+2]>=Close[i+3]) ObjectSetText("HOT"+i,CharToStr(234), 26, "Wingdings", clrRed);
}
//// ECHO on the downside
if (Low[i+1]<iBands(symbol,0,30,2,0,PRICE_MEDIAN,MODE_LOWER,i+1)+20*Point
&& Low[i+1]>iBands(symbol,0,30,2,0,PRICE_MEDIAN,MODE_LOWER,i+1)-370*Point
&& (Open[i]<Close[i] || (i>0 && Low[i-1]>Low[i+1]))
&& High[i+1]<iMA(symbol,0,8,0,MODE_EMA,PRICE_OPEN,i+1)
&& High[i+3]-Low[i+3]<500*Point
//&& High[i+2]<iMA(symbol,0,8,0,MODE_EMA,PRICE_OPEN,i+2)
&& (iBands(symbol,0,30,2,0,PRICE_MEDIAN,MODE_UPPER,i)-iBands(symbol,0,30,2,0,PRICE_MEDIAN,MODE_LOWER,i))>400*Point
&& Low[i+1]<Low[i]
&& Low[i+1]<(Low[i+2]+20*Point)
//&& Low[i+2]<Low[i+3]
&& High[i+3]>iMA(symbol,0,8,0,MODE_EMA,PRICE_OPEN,i+3)
&& Close[i+1]>(Low[i+1]+((High[i+1]-Low[i+1])/3))
&& ExtATRBufferf[i+1]>50
&& Low[i+1]<Low[i+3]
)
{
ObjectCreate("HOTE"+i,OBJ_TEXT, 0, Time[i+1],Low[i+1]-80*Point);
ObjectSetText("HOTE"+i,"ECHO", 26, "Impact", clrYellow);
if (i>1) {ObjectSetText("HOTE"+i,"ECHO", 26, "Impact", clrWhite); level = Low[i+1]-100*Point;}
if (ExtATRBuffer2f[i+1]<50 && (iBands(symbol,0,30,2,0,PRICE_MEDIAN,MODE_UPPER,i+1)-iBands(symbol,0,30,2,0,PRICE_MEDIAN,MODE_LOWER,i+1))<320*Point)
ObjectSetText("HOTE"+i,"ECHO (MFI_R)", 26, "Impact", clrGray);
}
//// BB ECHO on the downside
if (Low[i+1]<iBands(symbol,0,30,2,0,PRICE_MEDIAN,MODE_LOWER,i+1)+20*Point
&& Low[i+1]>iBands(symbol,0,30,2,0,PRICE_MEDIAN,MODE_LOWER,i+1)-190*Point
&& Open[i]<Close[i]
&& High[i]<iMA(symbol,0,8,0,MODE_EMA,PRICE_OPEN,i)+10*Point
&& Close[i+2]>iBands(symbol,0,30,2,0,PRICE_MEDIAN,MODE_LOWER,i+2)
&& Low[i+1]<Low[i] && Low[i+1]<Low[i+2]
&& Low[i+2]<Low[i+3]
&& Open[i+3]>iBands(symbol,0,30,2,0,PRICE_MEDIAN,MODE_LOWER,i+3)
&& (iBands(symbol,0,30,2,0,PRICE_MEDIAN,MODE_UPPER,i)-iBands(symbol,0,30,2,0,PRICE_MEDIAN,MODE_LOWER,i))>400*Point
&& (Close[i+1]>(Low[i+1]+((High[i+1]-Low[i+1])/3)) || Close[i+1]-Low[i+1]>130*Point))
{
ObjectCreate("HOTE"+i,OBJ_TEXT, 0, Time[i+1],Low[i+1]-60*Point);
ObjectSetText("HOTE"+i,"BBECHO", 26, "Impact", clrYellow);
if (i>1) {ObjectSetText("HOTE"+i,"BBECHO", 26, "Impact", clrBlack);
level = Low[i+1]-100*Point;}
}
//// ECHO on the upside
if (((Close[i+1]>iBands(symbol,0,30,2,0,PRICE_MEDIAN,MODE_UPPER,i+1)-80*Point
&& Close[i+1]<iBands(symbol,0,30,2,0,PRICE_MEDIAN,MODE_UPPER,i+1)+190*Point)
|| (High[i+1]>iBands(symbol,0,30,2,0,PRICE_MEDIAN,MODE_UPPER,i+1)-60*Point
&& High[i+1]<iBands(symbol,0,30,2,0,PRICE_MEDIAN,MODE_UPPER,i+1)+190*Point))
&& Open[i]>Close[i]
&& ((Low[i+1]>iMA(symbol,0,8,0,MODE_EMA,PRICE_OPEN,i+1) && Low[i+2]>iMA(symbol,0,8,0,MODE_EMA,PRICE_OPEN,i+2))
|| (Low[i+1]<iMA(symbol,0,8,0,MODE_EMA,PRICE_OPEN,i+1) && Low[i+2]<iMA(symbol,0,8,0,MODE_EMA,PRICE_OPEN,i+2)
&& Low[i+2]>iBands(symbol,0,30,2,0,PRICE_MEDIAN,MODE_LOWER,i+2)))
&& High[i+1]>High[i] && High[i+1]>High[i+2]
&& Low[i+3]<iMA(symbol,0,8,0,MODE_EMA,PRICE_OPEN,i+3)
//|| Low[i+4]<iMA(symbol,0,8,0,MODE_EMA,PRICE_OPEN,i+4))
&& Close[i+1]<(High[i+1]-((High[i+1]-Low[i+1])/3)))
{
ObjectCreate("HOTE"+i,OBJ_TEXT, 0, Time[i+1],High[i+1]+150*Point);
ObjectSetText("HOTE"+i,"ECHO", 26, "Impact", clrYellow);
if (i>1) {ObjectSetText("HOTE"+i,"ECHO", 26, "Impact", clrWhite);
level = High[i+1]+100*Point; }
}
//// BB ECHO on the upside
if (High[i+1]>iBands(symbol,0,30,2,0,PRICE_MEDIAN,MODE_UPPER,i+1)-20*Point
&& High[i+1]<iBands(symbol,0,30,2,0,PRICE_MEDIAN,MODE_UPPER,i+1)+190*Point
&& Open[i]>Close[i]
&& Low[i]>iMA(symbol,0,8,0,MODE_EMA,PRICE_OPEN,i)
&& Close[i+2]>iBands(symbol,0,30,2,0,PRICE_MEDIAN,MODE_UPPER,i+2)
&& High[i+1]>High[i] && High[i+1]>High[i+2]
&& High[i+2]>High[i+3]
&& Open[i+3]<iBands(symbol,0,30,2,0,PRICE_MEDIAN,MODE_UPPER,i+3)
//|| Open[i+4]<iBands(symbol,0,30,2,0,PRICE_MEDIAN,MODE_UPPER,i+4)
&& Close[i+1]<(High[i+1]-((High[i+1]-Low[i+1])/3)))
{
ObjectCreate("HOTE"+i,OBJ_TEXT, 0, Time[i+1],High[i+1]+90*Point);
ObjectSetText("HOTE"+i,"BBECHO", 26, "Impact", clrYellow);
if (i>1) {ObjectSetText("HOTE"+i,"BBECHO", 26, "Impact", clrBlack);
level = High[i+1]+100*Point; }
}
///hot lows
if (((Close[i+1]>iBands(symbol,0,30,2,0,PRICE_MEDIAN,MODE_UPPER,i+1) && Open[i+2]<iBands(symbol,0,30,2,0,PRICE_MEDIAN,MODE_UPPER,i+2))
|| (Low[i+3]>iMA(symbol,0,8,0,MODE_EMA,PRICE_OPEN,i+3) && Low[i+2]<iMA(symbol,0,8,0,MODE_EMA,PRICE_OPEN,i+2) && Low[i+1]>iMA(symbol,0,8,0,MODE_EMA,PRICE_OPEN,i+1))
|| (Low[i+2]<iMA(symbol,0,8,0,MODE_EMA,PRICE_OPEN,i+2) && Low[i+1]<iMA(symbol,0,8,0,MODE_EMA,PRICE_OPEN,i+1) && Low[i+1]>iBands(symbol,0,30,2,0,PRICE_MEDIAN,MODE_LOWER,i+1) ))
&& Close[i]<(High[i]-((High[i]-Low[i])/3)) && High[i]>High[i+1]
&& ((Close[i]>iBands(symbol,0,30,2,0,PRICE_MEDIAN,MODE_UPPER,i)-80*Point
&& Close[i]<iBands(symbol,0,30,2,0,PRICE_MEDIAN,MODE_UPPER,i)+190*Point)
|| (High[i]>iBands(symbol,0,30,2,0,PRICE_MEDIAN,MODE_UPPER,i)-60*Point
&& High[i]<iBands(symbol,0,30,2,0,PRICE_MEDIAN,MODE_UPPER,i)+270*Point))
){
ObjectCreate("HOTI"+i+1,OBJ_TEXT, 0, Time[i+1],Low[i+1]-40*Point);
ObjectSetText("HOTI"+i+1, CharToStr(174), 26,"Wingdings", clrYellow);
if (i>1 && High[i-2]>High[i]) ObjectSetText("HOTI"+i+1, CharToStr(174), 26,"Wingdings", clrGreen);
/// else if (i>1 && Open[i-1]>Close[i-1] && !(Low[i-1]>iBands(symbol,0,30,2,0,PRICE_MEDIAN,MODE_UPPER,i-1) && (iBands(symbol,0,30,2,0,PRICE_MEDIAN,MODE_UPPER,i+1)-iBands(symbol,0,30,2,0,PRICE_MEDIAN,MODE_LOWER,i+1))<320*Point)) ObjectSetText("HOTI"+i+1, CharToStr(174), 26,"Wingdings", clrGreen);
else if (i>1 && Open[i-1]>Close[i-1] && High[i-1]>iBands(symbol,0,30,2,0,PRICE_MEDIAN,MODE_UPPER,i-1) && Low[i-1]>iBands(symbol,0,30,2,0,PRICE_MEDIAN,MODE_LOWER,i-1)
&& Close[i-1]>Close[i]) ObjectSetText("HOTI"+i+1, CharToStr(174), 26,"Wingdings", clrTeal);
else if (i>1) ObjectSetText("HOTI"+i+1, CharToStr(174), 26,"Wingdings", clrRed);
ObjectDelete("HOTI"+i);
}
///hot highs
if (((Close[i+1]<iBands(symbol,0,30,2,0,PRICE_MEDIAN,MODE_LOWER,i+1) && Open[i+2]>iBands(symbol,0,30,2,0,PRICE_MEDIAN,MODE_LOWER,i+2))
|| (High[i+3]<iMA(symbol,0,8,0,MODE_EMA,PRICE_OPEN,i+3) && High[i+2]>iMA(symbol,0,8,0,MODE_EMA,PRICE_OPEN,i+2) && High[i+1]<iMA(symbol,0,8,0,MODE_EMA,PRICE_OPEN,i+1))
|| (High[i+2]>iMA(symbol,0,8,0,MODE_EMA,PRICE_OPEN,i+2) && High[i+1]>iMA(symbol,0,8,0,MODE_EMA,PRICE_OPEN,i+1) && High[i+1]<iBands(symbol,0,30,2,0,PRICE_MEDIAN,MODE_LOWER,i+1) ))
&& Close[i]>(Low[i]+((High[i]-Low[i])/3)) && Low[i]<Low[i+1]
&& ((Close[i]<iBands(symbol,0,30,2,0,PRICE_MEDIAN,MODE_LOWER,i)+80*Point
&& Close[i]>iBands(symbol,0,30,2,0,PRICE_MEDIAN,MODE_LOWER,i)-190*Point)
|| (Low[i]<iBands(symbol,0,30,2,0,PRICE_MEDIAN,MODE_LOWER,i)+20*Point
&& Low[i]>iBands(symbol,0,30,2,0,PRICE_MEDIAN,MODE_LOWER,i)-270*Point))
&& High[i+2]-Low[i+2]<500*Point
){
ObjectCreate("HOTII"+i+1,OBJ_TEXT, 0, Time[i+1],High[i+1]+90*Point);
ObjectSetText("HOTII"+i+1, CharToStr(174), 26,"Wingdings", clrYellow);
if (i>1 && Low[i-2]<Low[i]) ObjectSetText("HOTII"+i+1, CharToStr(174), 26,"Wingdings", clrRed);
/// else if (i>1 && Open[i-1]>Close[i-1] && !(Low[i-1]>iBands(symbol,0,30,2,0,PRICE_MEDIAN,MODE_UPPER,i-1) && (iBands(symbol,0,30,2,0,PRICE_MEDIAN,MODE_UPPER,i+1)-iBands(symbol,0,30,2,0,PRICE_MEDIAN,MODE_LOWER,i+1))<320*Point)) ObjectSetText("HOTI"+i+1, CharToStr(174), 26,"Wingdings", clrGreen);
else if (i>1 && Open[i-1]<Close[i-1] && Low[i-1]<iBands(symbol,0,30,2,0,PRICE_MEDIAN,MODE_LOWER,i-1) && High[i-1]<iBands(symbol,0,30,2,0,PRICE_MEDIAN,MODE_UPPER,i-1) && Close[i-1]<Close[i]) ObjectSetText("HOTII"+i+1, CharToStr(174), 26,"Wingdings", clrRed);
else if (i>1) ObjectSetText("HOTII"+i+1, CharToStr(174)+CharToString(174), 26,"Wingdings", clrCadetBlue);
ObjectDelete("HOTII"+i);
}
///outside sequence on the upside, vol crush
if (iFractals(symbol,0,MODE_LOWER,i+4)
&& Low[i+4]>iMA(symbol,0,8,0,MODE_EMA,PRICE_OPEN,i+4)
&& Close[i]<(High[i]-((High[i]-Low[i])/3))
&& Low[i+6]>iBands(symbol,0,30,2,0,PRICE_MEDIAN,MODE_UPPER,i+6)
&& Low[i+7]>iBands(symbol,0,30,2,0,PRICE_MEDIAN,MODE_UPPER,i+7)
&& Low[i+8]>iBands(symbol,0,30,2,0,PRICE_MEDIAN,MODE_UPPER,i+8)
&& Low[i+9]>iBands(symbol,0,30,2,0,PRICE_MEDIAN,MODE_UPPER,i+9)
){
ObjectCreate("Firstpulls"+IntegerToString(i), OBJ_TREND, 0, Time[i+4], Low[i+4], Time[i+1], High[i+1]);
ObjectSetInteger(0,"Firstpulls"+IntegerToString(i),OBJPROP_COLOR,clrMagenta);
ObjectSet("Firstpulls"+IntegerToString(i),OBJPROP_BACK,1);
ObjectSet("Firstpulls"+IntegerToString(i),OBJPROP_RAY_RIGHT,false);
ObjectSet("Firstpulls"+IntegerToString(i),OBJPROP_WIDTH,16);
ObjectCreate("HOTEL"+i,OBJ_TEXT, 0, Time[i],High[i]+90*Point);
ObjectSetText("HOTEL"+i,"OUTSIDE SHOCK -> Magenta RSI", 26, "Impact", clrBlack);
level = High[i+1]+80*Point;
}
///last effort candle on the upside, return in 2
if (Low[i]<iMA(symbol,0,8,0,MODE_EMA,PRICE_OPEN,i) && High[i+2]>High[i+1] && High[i+2]>High[i+3] &&
High[i+2]>iBands(symbol,0,30,2,0,PRICE_MEDIAN,MODE_UPPER,i+2)-10*Point
&& (ExtATRBufferf[i]<41 || ExtATRBuffer2f[i+2]>130)
&& (iBands(symbol,0,30,2,0,PRICE_MEDIAN,MODE_UPPER,i)-iBands(symbol,0,30,2,0,PRICE_MEDIAN,MODE_LOWER,i))>320*Point
&& Open[i]>=Close[i+1]
&& Low[i+1]>iMA(symbol,0,8,0,MODE_EMA,PRICE_OPEN,i+1)
&& dir[i]==0
){
ObjectCreate("HOTE"+i,OBJ_TEXT, 0, Time[i+1],High[i+1]+200*Point);
ObjectSetText("HOTE"+i,"BACHO", 26, "Impact", clrBlack);
level = High[i+2]+80*Point;
ObjectCreate("Firstpulls"+IntegerToString(i), OBJ_TREND, 0, Time[i+2], High[i+2], Time[i], Low[i]);
ObjectSetInteger(0,"Firstpulls"+IntegerToString(i),OBJPROP_COLOR,clrYellow);
ObjectSet("Firstpulls"+IntegerToString(i),OBJPROP_BACK,1);
ObjectSet("Firstpulls"+IntegerToString(i),OBJPROP_RAY_RIGHT,false);
ObjectSet("Firstpulls"+IntegerToString(i),OBJPROP_WIDTH,16);
}
///last effort candle on the upside, return in 1
if (Low[i]<iMA(symbol,0,8,0,MODE_EMA,PRICE_OPEN,i) && High[i+1]>High[i] && High[i+1]>High[i+2] &&
High[i+1]>iBands(symbol,0,30,2,0,PRICE_MEDIAN,MODE_UPPER,i+1)-10*Point && (ExtATRBuffer[i]<41 || ExtATRBuffer2[i+1]>130) && (iBands(symbol,0,30,2,0,PRICE_MEDIAN,MODE_UPPER,i)-iBands(symbol,0,30,2,0,PRICE_MEDIAN,MODE_LOWER,i))>400*Point){
ObjectCreate("Firstpulls"+IntegerToString(i), OBJ_TREND, 0, Time[i+1], High[i+1], Time[i], Low[i]);
ObjectSetInteger(0,"Firstpulls"+IntegerToString(i),OBJPROP_COLOR,clrRed);
ObjectSet("Firstpulls"+IntegerToString(i),OBJPROP_BACK,1);
ObjectSet("Firstpulls"+IntegerToString(i),OBJPROP_RAY_RIGHT,false);
ObjectSet("Firstpulls"+IntegerToString(i),OBJPROP_WIDTH,26);
}
///last effort candle on the downside, return in 2
if (High[i]>iMA(symbol,0,8,0,MODE_EMA,PRICE_OPEN,i) && Low[i+2]<Low[i+1] && Low[i+2]<Low[i+3] &&
Low[i+2]<iBands(symbol,0,30,2,0,PRICE_MEDIAN,MODE_LOWER,i+2)+20*Point && (ExtATRBuffer2[i]<31 || ExtATRBuffer2[i+6]<31 ) && (iBands(symbol,0,30,2,0,PRICE_MEDIAN,MODE_UPPER,i)-iBands(symbol,0,30,2,0,PRICE_MEDIAN,MODE_LOWER,i))>400*Point
){
ObjectCreate("Firstpulls"+IntegerToString(i), OBJ_TREND, 0, Time[i+2], Low[i+2], Time[i], High[i]);
ObjectSetInteger(0,"Firstpulls"+IntegerToString(i),OBJPROP_COLOR,clrOrange);
ObjectSet("Firstpulls"+IntegerToString(i),OBJPROP_BACK,1);
ObjectSet("Firstpulls"+IntegerToString(i),OBJPROP_RAY_RIGHT,false);
ObjectSet("Firstpulls"+IntegerToString(i),OBJPROP_WIDTH,16);
}
///Volatility Compression Anchor For A Turn Down
if (ExtATRBuffer[i]<10 && (ExtATRBuffer2[i]>150 || Low[i]>iBands(symbol,0,30,2,0,PRICE_MEDIAN,MODE_UPPER,i))
&& i>0 && High[i-1]<High[i] && (iBands(symbol,0,30,2,0,PRICE_MEDIAN,MODE_UPPER,i)-iBands(symbol,0,30,2,0,PRICE_MEDIAN,MODE_LOWER,i))>360*Point) {
Anchor[i]=true;
ObjectCreate("LOTUS"+IntegerToString(i),OBJ_VLINE,indicator_window, Time[i], 0);
ObjectSet("LOTUS"+IntegerToString(i),OBJPROP_COLOR,clrMistyRose);
ObjectSet("LOTUS"+IntegerToString(i),OBJPROP_WIDTH,3);
ObjectSet("LOTUS"+IntegerToString(i),OBJPROP_BACK,1);
}
///Volatility Compression Anchor For A Turn Up
if (ExtATRBuffer2[i]<7 && (ExtATRBuffer[i]>150 || Close[i]<iBands(symbol,0,30,2,0,PRICE_MEDIAN,MODE_LOWER,i))
&& Close[i]>Low[i]+10*Point && i>0
&& High[i-1]<iMA(symbol,0,8,0,MODE_EMA,PRICE_OPEN,i-1)
) { Anchor[i]=true;
ObjectCreate("LOTUS"+IntegerToString(i),OBJ_VLINE,indicator_window, Time[i], 0);
ObjectSet("LOTUS"+IntegerToString(i),OBJPROP_COLOR,clrPaleGreen);
ObjectSet("LOTUS"+IntegerToString(i),OBJPROP_WIDTH,3);
ObjectSet("LOTUS"+IntegerToString(i),OBJPROP_BACK,1);
}
///End Of Move up
if (High[i+1]>iBands(symbol,0,30,2,0,PRICE_MEDIAN,MODE_UPPER,i+1) && High[i+1]>High[i+2] && High[i]<High[i+1]
&& Close[i]<iMA(symbol,0,8,0,MODE_EMA,PRICE_OPEN,i) && Close[i+1]>iMA(symbol,0,8,0,MODE_EMA,PRICE_OPEN,i+1)
&& (iBands(symbol,0,30,2,0,PRICE_MEDIAN,MODE_UPPER,i)-iBands(symbol,0,30,2,0,PRICE_MEDIAN,MODE_LOWER,i))>360*Point
)
{
ObjectCreate("Firstpull"+IntegerToString(i), OBJ_RECTANGLE, 0, Time[i+6], High[i+1], Time[i], Low[i]);
if (Low[i+1]>iMA(symbol,0,207,0,MODE_EMA,PRICE_LOW,i+1)) {ObjectSetInteger(0,"Firstpull"+IntegerToString(i),OBJPROP_COLOR,clrPink);
ObjectCreate("POT"+i,OBJ_TEXT, 0, Time[i+12],High[i+1]+100*Point);
ObjectSetText("POT"+i,"FLIP OVER (5H)", 26, "Impact", clrCadetBlue);
if (Close[i+1]>iMA(symbol,0,207,0,MODE_EMA,PRICE_LOW,i+1) && Close[i+1]<iMA(symbol,0,207,0,MODE_EMA,PRICE_HIGH,i+1))
ObjectSetText("POT"+i,"CONT. SELL", 26, "Impact", clrCadetBlue);
ObjectCreate("POTS"+i,OBJ_TEXT, 0, Time[i+3],(High[i+1]+Low[i])/2+50*Point);
ObjectSetText("POTS"+i, "to F3-", 26, "Impact", clrBlack);
}
else ObjectSetInteger(0,"Firstpull"+IntegerToString(i),OBJPROP_COLOR,clrMediumSpringGreen);
ObjectSet("Firstpull"+IntegerToString(i),OBJPROP_BACK,1);
ObjectSet("Firstpull"+IntegerToString(i),OBJPROP_WIDTH,5);
}
///Exit Conditon Up #1
if (RSI2[i+2]<75 && RSI2[i+1]>95 && iHigh(symbol,0,iHighest(symbol,0,MODE_HIGH,2,i))-iLow(symbol,0,iLowest(symbol,0,MODE_LOW,3,i))>220*Point
&& High[i]>High[i+1] && Low[i]>iMA(symbol,0,207,0,MODE_EMA,PRICE_HIGH,i)
)
{
ObjectCreate("Firstpulls"+IntegerToString(i), OBJ_TREND, 0, Time[i+2], Open[i]+200*Point, Time[i], Open[i]);
ObjectSetInteger(0,"Firstpulls"+IntegerToString(i),OBJPROP_COLOR,clrPink);
ObjectSet("Firstpulls"+IntegerToString(i),OBJPROP_BACK,1);
ObjectSet("Firstpulls"+IntegerToString(i),OBJPROP_RAY_RIGHT,false);
ObjectSet("Firstpulls"+IntegerToString(i),OBJPROP_WIDTH,6);
}
///Exit Conditon Up #2
if (High[i+2]>High[i+3] && High[i+2]>iBands(symbol,0,30,2,0,PRICE_MEDIAN,MODE_UPPER,i+2) && Close[i+2]<iBands(symbol,0,30,2,0,PRICE_MEDIAN,MODE_UPPER,i+2)
&& Low[i+1]>iMA(symbol,0,207,0,MODE_EMA,PRICE_HIGH,i+1)
&& iHigh(symbol,0,iHighest(symbol,0,MODE_HIGH,2,i+1))>iHigh(symbol,0,iHighest(symbol,0,MODE_HIGH,20,i+3))
&& Low[i]<Low[i+1] && Close[i]<Open[i]
)
{
if (Close[i+1]<Open[i+1]) ObjectCreate("Firstpulls"+IntegerToString(i), OBJ_TREND, 0, Time[i+3], Open[i+1]+200*Point, Time[i+1], Open[i+1]);
else ObjectCreate("Firstpulls"+IntegerToString(i), OBJ_TREND, 0, Time[i+3], Close[i+1]+200*Point, Time[i+1], Close[i+1]);
ObjectSetInteger(0,"Firstpulls"+IntegerToString(i),OBJPROP_COLOR,clrDeepPink);
ObjectSet("Firstpulls"+IntegerToString(i),OBJPROP_BACK,1);
ObjectSet("Firstpulls"+IntegerToString(i),OBJPROP_RAY_RIGHT,false);
ObjectSet("Firstpulls"+IntegerToString(i),OBJPROP_WIDTH,6);
}
///Exit Conditon Up #3
if (ExtATRBuffer2[i]>353.5
)
{
ObjectCreate("Firstpulls"+IntegerToString(i), OBJ_TREND, 0, Time[i+2], High[i]+200*Point, Time[i], High [i]);
ObjectSetInteger(0,"Firstpulls"+IntegerToString(i),OBJPROP_COLOR,clrRed);
ObjectSet("Firstpulls"+IntegerToString(i),OBJPROP_BACK,1);
ObjectSet("Firstpulls"+IntegerToString(i),OBJPROP_RAY_RIGHT,false);
ObjectSet("Firstpulls"+IntegerToString(i),OBJPROP_WIDTH,6);
}
///Buy Conditon Up #1
if (Close[i]>iMA(symbol,0,8,0,MODE_EMA,PRICE_OPEN,i) && Close[i+1]<iMA(symbol,0,8,0,MODE_EMA,PRICE_OPEN,i+1) && Close[i+2]>iMA(symbol,0,8,0,MODE_EMA,PRICE_OPEN,i+2)
&& Close[i+3]>iMA(symbol,0,8,0,MODE_EMA,PRICE_OPEN,i+3) && Close[i+4]>iMA(symbol,0,8,0,MODE_EMA,PRICE_OPEN,i+4)
&& Close[i+5]>iMA(symbol,0,8,0,MODE_EMA,PRICE_OPEN,i+5) && Close[i+6]>iMA(symbol,0,8,0,MODE_EMA,PRICE_OPEN,i+6)
//&& Close[i+7]>iMA(symbol,0,8,0,MODE_EMA,PRICE_OPEN,i+7) && Close[i+8]>iMA(symbol,0,8,0,MODE_EMA,PRICE_OPEN,i+8)
&& Low[i+1]>iMA(symbol,0,207,0,MODE_EMA,PRICE_HIGH,i+1) && ExtATRBuffer2[i]<140
&& High[i+1]<=iHigh(symbol,0,iHighest(symbol,0,MODE_HIGH,20,i+2))
&& iBands(symbol,0,30,2,0,PRICE_MEDIAN,MODE_MAIN,i+10)<iBands(symbol,0,30,2,0,PRICE_MEDIAN,MODE_MAIN,i)
&& iBands(symbol,0,30,2,0,PRICE_MEDIAN,MODE_MAIN,i+20)+20*Point<iBands(symbol,0,30,2,0,PRICE_MEDIAN,MODE_MAIN,i)
)
{
ObjectCreate("Firstpulls"+IntegerToString(i), OBJ_TREND, 0, Time[i+2], Open[i]-200*Point, Time[i], Open[i]);
ObjectSetInteger(0,"Firstpulls"+IntegerToString(i),OBJPROP_COLOR,clrTeal);
ObjectSet("Firstpulls"+IntegerToString(i),OBJPROP_BACK,1);
ObjectSet("Firstpulls"+IntegerToString(i),OBJPROP_RAY_RIGHT,false);
ObjectSet("Firstpulls"+IntegerToString(i),OBJPROP_WIDTH,6);
}
///End Of Move dn
if (Low[i+2]<iBands(symbol,0,30,2,0,PRICE_MEDIAN,MODE_LOWER,i+2) && Low[i+1]<iBands(symbol,0,30,2,0,PRICE_MEDIAN,MODE_LOWER,i+1) && Low[i+1]<Low[i+2] && Low[i]>Low[i+1]
&& Close[i]>iMA(symbol,0,8,0,MODE_EMA,PRICE_OPEN,i) && Close[i+1]<iMA(symbol,0,8,0,MODE_EMA,PRICE_OPEN,i+1)
&& Low[i+1]<Low[i+2] && Low[i+1]<Low[i+3] && Low[i+1]<Low[i+4] && Low[i+1]<Low[i+5]
&& High[i+1]<iMA(symbol,0,207,0,MODE_EMA,PRICE_HIGH,i+1) && High[i+1]-Low[i]>35*Point
)
{
ObjectCreate("Firstpull"+IntegerToString(i), OBJ_RECTANGLE, 0, Time[i+6], High[i], Time[i], Low[i+1]);
if (High[i+1]<iMA(symbol,0,207,0,MODE_EMA,PRICE_HIGH,i+1)) {ObjectSetInteger(0,"Firstpull"+IntegerToString(i),OBJPROP_COLOR,clrLimeGreen);
ObjectCreate("POT"+i,OBJ_TEXT, 0, Time[i+8],Low[i+1]-40*Point);
ObjectSetText("POT"+i,"FLIP OVER 5H", 26, "Impact", clrCadetBlue);
ObjectCreate("POTS"+i,OBJ_TEXT, 0, Time[i+3],(High[i+1]+Low[i])/2-50*Point);
ObjectSetText("POTS"+i, "to F3-", 26, "Impact", clrBlack);
}
else ObjectSetInteger(0,"Firstpull"+IntegerToString(i),OBJPROP_COLOR,clrSalmon);
ObjectSet("Firstpull"+IntegerToString(i),OBJPROP_BACK,1);
ObjectSet("Firstpull"+IntegerToString(i),OBJPROP_WIDTH,5);
}
////First Pullback Up
if (Open[i]>Close[i] && iHigh(symbol,0,iHighest(symbol,0,MODE_HIGH,2,i))==iHigh(symbol,0,iHighest(symbol,0,MODE_HIGH,20,i)) && (
(iFractals(symbol,0,MODE_LOWER,i+2) && Open[i+1]<Close[i+1] && Open[i+2]<Close[i+2] && High[i+1]-Low[i+1]>360*Point)
|| (iFractals(symbol,0,MODE_LOWER,i+3) && Open[i+1]<Close[i+1] && Open[i+2]<Close[i+2] && Open[i+3]<Close[i+3] && High[i+1]-Low[i+3]>360*Point)
|| (iFractals(symbol,0,MODE_LOWER,i+4) && Open[i+1]<Close[i+1] && Open[i+2]<Close[i+2] && Open[i+3]<Close[i+3] && Open[i+4]<Close[i+4] && High[i+1]-Low[i+4]>360*Point)
|| (iFractals(symbol,0,MODE_LOWER,i+5) && Open[i+1]<Close[i+1] && Open[i+2]<Close[i+2] && Open[i+3]<Close[i+3] && Open[i+4]<Close[i+4] && Open[i+5]<Close[i+5] && High[i+1]-Low[i+5]>360*Point && Low[i+4]<Low[i+3])
))
{
ObjectCreate("Firstpull"+IntegerToString(i), OBJ_RECTANGLE, 0, Time[i+2], High[i], Time[i], Low[i]);
ObjectSetInteger(0,"Firstpull"+IntegerToString(i),OBJPROP_COLOR,clrChartreuse);
ObjectSet("Firstpull"+IntegerToString(i),OBJPROP_BACK,1);
ObjectSet("Firstpull"+IntegerToString(i),OBJPROP_WIDTH,5);
}
////First Pullback Down
if (Open[i]<Close[i] && iLow(symbol,0,iLowest(symbol,0,MODE_LOW,2,i))==iLow(symbol,0,iLowest(symbol,0,MODE_LOW,20,i)) && (
(iFractals(symbol,0,MODE_UPPER,i+2) && Open[i+1]>Close[i+1] && Open[i+2]>Close[i+2] && High[i+1]-Low[i+1]>360*Point)
|| (iFractals(symbol,0,MODE_UPPER,i+3) && Open[i+1]>Close[i+1] && Open[i+2]>Close[i+2] && Open[i+3]>Close[i+3] && High[i+3]-Low[i+1]>360*Point)
|| (iFractals(symbol,0,MODE_UPPER,i+4) && Open[i+1]>Close[i+1] && Open[i+2]>Close[i+2] && Open[i+3]>Close[i+3] && Open[i+4]>Close[i+4] && High[i+4]-Low[i+1]>360*Point)
|| (iFractals(symbol,0,MODE_UPPER,i+5) && Open[i+1]>Close[i+1] && Open[i+2]>Close[i+2] && Open[i+3]>Close[i+3] && Open[i+4]>Close[i+4] && Open[i+5]>Close[i+5] && High[i+5]-Low[i+1]>360*Point && High[i+4]>High[i+3])
))
{
if (Close[i]>iMA(symbol,0,207,0,MODE_EMA,PRICE_LOW,i)-100*Point) ObjectCreate("Firstpull"+IntegerToString(i), OBJ_RECTANGLE, 0, Time[i+10], iHigh(symbol,0,iHighest(symbol,0,MODE_HIGH,20,i)), Time[i], iLow(symbol,0,iHighest(symbol,0,MODE_HIGH,20,i)));
else ObjectCreate("Firstpull"+IntegerToString(i), OBJ_RECTANGLE, 0, Time[i+2], High[i], Time[i], Low[i]);
ObjectSetInteger(0,"Firstpull"+IntegerToString(i),OBJPROP_COLOR,clrTomato);
if (Close[i+1]>iBands(symbol,0,30,2,0,PRICE_MEDIAN,MODE_LOWER,i+1)) ObjectSetInteger(0,"Firstpull"+IntegerToString(i),OBJPROP_COLOR,clrChartreuse);
ObjectSet("Firstpull"+IntegerToString(i),OBJPROP_BACK,1);
ObjectSet("Firstpull"+IntegerToString(i),OBJPROP_WIDTH,5);
}
if (Close[i]<iLo4[i] ) {ObjectSetText("Crushi"+i, "Vol Crush > ", 21, "Impact", clrWhite); ObjectSetText("Crush"+i, "Vol Crush -> ", 19, "Impact", clrNavy); ObjectSetText("Crushy"+i,DoubleToStr(NormalizeDouble(iHi4[i],4),4), 21, "Impact", clrWhite); ObjectSetText("Crushd"+i, DoubleToStr(NormalizeDouble(iHi4[i],4),4), 19, "Impact", clrNavy); }
else if (Close[i]>iHi4[i] ) { ObjectSetText("Crushi"+i, "Vol Crush > ", 21, "Impact", clrWhite); ObjectSetText("Crush"+i, "Vol Crush -> ", 19, "Impact", clrNavy); ObjectSetText("Crushy"+i, DoubleToStr(NormalizeDouble(iLo4[i],4),4), 21, "Impact", clrWhite); ObjectSetText("Crushd"+i, DoubleToStr(NormalizeDouble(iLo4[i],4),4), 19, "Impact", clrNavy); }
///////Volatility Divergence On The Downside
if (iFractals(symbol,0,MODE_LOWER,i) && iLow(symbol,0,iLowest(symbol,0,MODE_LOW,240,i))==iLow(symbol,0,i)
&& ExtATRBuffer2[ArrayMinimum(ExtATRBuffer2,240,i+1)]<10
// && ExtATRBuffer2[ArrayMaximum(ExtATRBuffer2,14,i+10)]<41
&& ExtATRBuffer2[ArrayMinimum(ExtATRBuffer2,240,i+1)]<ExtATRBuffer2[i]
&& ExtATRBuffer2[i]<41
// && Close[i-1]>iMA(symbol,0,8,0,MODE_EMA,PRICE_OPEN,i-1)
// && ExtATRBuffer[ArrayMaximum(ExtATRBuffer,70,i+10)]<ExtATRBuffer[i]
)
{
ObjectCreate("Frog"+IntegerToString(i),OBJ_TREND,indicator_window, Time[i], ExtATRBuffer2[i], Time[ArrayMinimum(ExtATRBuffer2,240,i+1)], ExtATRBuffer2[ArrayMinimum(ExtATRBuffer2,240,i+1)]);
ObjectSet("Frog"+IntegerToString(i),OBJPROP_COLOR,clrPowderBlue);
if (ExtATRBuffer2[ArrayMaximum(ExtATRBuffer2,14,i+10)]>41) { ObjectCreate("Frogg"+IntegerToString(i),OBJ_TEXT, 0, Time[i+8],Low[i]-40*Point);
ObjectSetText("Frogg"+IntegerToString(i),"TAKE BCK 2 FRACT.(5H)", 26, "Impact", clrCadetBlue);
// if (ExtATRBuffer[i]<140) ObjectSetText("Frogg"+IntegerToString(i),"TAKE BCK 1 FRACT.(5H)", 26, "Impact", clrCadetBlue);
if (ExtATRBuffer[i]<105) ObjectSetText("Frogg"+IntegerToString(i),"TAKE BCK 3 FRACT.(5H)", 26, "Impact", clrCadetBlue);
if (ExtATRBuffer[i]>140) ObjectSetText("Frogg"+IntegerToString(i),"TAKE BCK 1 FRACT.(5H)", 26, "Impact", clrCadetBlue);
if (i>5 && (Low[i-5]<Low[i] || Low[i-4]<Low[i] || Low[i-3]<Low[i] || Low[i-2]<Low[i] || Low[i-1]<Low[i])) ObjectDelete("Frogg"+IntegerToString(i));
}
if (ExtATRBuffer2[ArrayMaximum(ExtATRBuffer2,14,i+10)]<41) {
ObjectSet("Frog"+IntegerToString(i),OBJPROP_COLOR,clrYellow);
if (ExtATRBuffer[i]>41 && Close[i-1]>iMA(symbol,0,8,0,MODE_EMA,PRICE_OPEN,i-1)) {
ObjectCreate("Frogg"+IntegerToString(i),OBJ_TEXT, 0, Time[i+8],Low[i]-40*Point);
ObjectSetText("Frogg"+IntegerToString(i),"FLIP OVER ATTEMPT", 26, "Impact", clrYellow);}
if (ExtATRBuffer2[i]>41) ObjectSet("Frog"+IntegerToString(i),OBJPROP_COLOR,clrPink);
if (i>0 && Close[i-1]<iMA(symbol,0,8,0,MODE_EMA,PRICE_OPEN,i-1)){
ObjectSet("Frog"+IntegerToString(i),OBJPROP_COLOR,clrGray); }
}
if (i>0 && ExtATRBuffer2[ArrayMaximum(ExtATRBuffer2,14,i+10)]>41 && Close[i-1]<iMA(symbol,0,8,0,MODE_EMA,PRICE_OPEN,i-1)){
ObjectSet("Frog"+IntegerToString(i),OBJPROP_COLOR,clrGray); }
ObjectSet("Frog"+IntegerToString(i),OBJPROP_WIDTH,6);
ObjectSet("Frog"+IntegerToString(i),OBJPROP_RAY_RIGHT,false);
ObjectSet("Frog"+IntegerToString(i),OBJPROP_BACK,true);
}
///////Volatility Divergence On The Upside
if (iFractals(symbol,0,MODE_UPPER,i) &&
iHigh(symbol,0,iHighest(symbol,0,MODE_HIGH,240,i))==iHigh(symbol,0,i)
&& ExtATRBuffer[ArrayMinimum(ExtATRBuffer,240,i+1)]<11
// && ExtATRBuffer[ArrayMaximum(ExtATRBuffer,10,i+14)]<62
&& ExtATRBuffer[ArrayMinimum(ExtATRBuffer,240,i+1)]<ExtATRBuffer[i]
&& ExtATRBuffer[i]<45
// && ((Close[i-1]<iMA(symbol,0,8,0,MODE_EMA,PRICE_OPEN,i-1)) || (i>1 && Close[i-2]<iMA(symbol,0,8,0,MODE_EMA,PRICE_OPEN,i-1)))
&& (
ExtATRBuffer2[ArrayMaximum(ExtATRBuffer2,240,i+10)]<ExtATRBuffer2[i] ||
Close[i]<High[i]-(High[i]-Low[i])/3)
)
{
ObjectCreate("Frogi"+IntegerToString(i),OBJ_TREND,indicator_window, Time[i], ExtATRBuffer[i], Time[ArrayMinimum(ExtATRBuffer,240,i+1)], ExtATRBuffer[ArrayMinimum(ExtATRBuffer,240,i+1)]);
ObjectSet("Frogi"+IntegerToString(i),OBJPROP_COLOR,clrYellow);
if (ExtATRBuffer[i]<31 && Close[i-1]<iMA(symbol,0,8,0,MODE_EMA,PRICE_OPEN,i-1)) {ObjectCreate("Frogg"+IntegerToString(i),OBJ_TEXT, 0, Time[i+12],High[i]+80*Point);
ObjectSetText("Frogg"+IntegerToString(i),"FLIP OVER ATTEMPT", 26, "Impact", clrYellow);
if (ExtATRBuffer2[i]>166) ObjectSetText("Frogg"+IntegerToString(i),"FLIP OVER - MUST HEDGE", 26, "Impact", clrYellow); }
if (ExtATRBuffer[i]>31) ObjectSet("Frogi"+IntegerToString(i),OBJPROP_COLOR,clrPink);
else if (Close[i-1]>iMA(symbol,0,8,0,MODE_EMA,PRICE_OPEN,i-1))
{ObjectSet("Frogi"+IntegerToString(i),OBJPROP_COLOR,clrLightGray);
if (Low[i+2]<iMA(symbol,0,8,0,MODE_EMA,PRICE_OPEN,i+2) && Close[i+2]>iMA(symbol,0,8,0,MODE_EMA,PRICE_OPEN,i+2)) ObjectSet("Frogi"+IntegerToString(i),OBJPROP_COLOR,clrBlack);
if (Low[i]>iBands(symbol,0,30,2,0,PRICE_MEDIAN,MODE_UPPER,i)) ObjectSet("Frogi"+IntegerToString(i),OBJPROP_COLOR,clrGray);
// ObjectCreate("POTA"+IntegerToString(i),OBJ_TEXT, 0, Time[i+8],(High[i])-50*Point);
// ObjectSetText("POTA"+IntegerToString(i), "10L to F2-", 36, "Impact", clrRed);
if (ExtATRBuffer2[i]<129 && Anchor[ArrayMinimum(ExtATRBuffer,160,i+1)]==true) {ObjectSetText("POTA"+IntegerToString(i), "Extra Dangerous Flip Over", 36, "Impact", clrYellow);
ObjectSet("Frogi"+IntegerToString(i),OBJPROP_COLOR,clrYellow);
}
}
ObjectSet("Frogi"+IntegerToString(i),OBJPROP_WIDTH,6);
ObjectSet("Frogi"+IntegerToString(i),OBJPROP_RAY_RIGHT,false);
ObjectSet("Frogi"+IntegerToString(i),OBJPROP_BACK,true);
}
}
}
double rou=0;
double rod=0;
if (Period()==30){
deletetxt1("Libec");
i=0;
while(i<10){
if (High[i]-iMA(NULL,0,17,0,MODE_EMA, PRICE_MEDIAN,i)>rou) rou=High[i]-iMA(NULL,0,17,0,MODE_EMA, PRICE_MEDIAN,i);
if (iMA(NULL,0,17,0,MODE_EMA, PRICE_MEDIAN,i)-Low[i]>rod) rod=iMA(NULL,0,17,0,MODE_EMA, PRICE_MEDIAN,i)-Low[i];
i++;
}
ObjectCreate("Libec"+4,OBJ_LABEL,indicator_window, 0,0);
ObjectSetText("Libec"+4, DoubleToStr(rou*10000,2)+" ("+DoubleToStr(iMA(NULL,0,17,0,MODE_EMA, PRICE_MEDIAN,0)+rou,4)+")", 11, "Arial Black", DarkViolet);
ObjectSet("Libec"+4,OBJPROP_CORNER,2);
ObjectSet("Libec"+4,OBJPROP_XDISTANCE,20);
ObjectSet("Libec"+4,OBJPROP_YDISTANCE,67);
if (rou>rod) ObjectSet("Libec"+4,OBJPROP_COLOR,clrDarkGreen);
else if (rou<.0010) ObjectSet("Libec"+4,OBJPROP_COLOR,clrGray);
else ObjectSet("Libec"+4,OBJPROP_COLOR,clrBlack);
ObjectCreate("Libec"+5,OBJ_LABEL,indicator_window, 0,0);
ObjectSetText("Libec"+5,DoubleToStr(rod*10000,2)+" ("+DoubleToStr(iMA(NULL,0,17,0,MODE_EMA, PRICE_MEDIAN,0)-rod,4)+")", 11, "Arial Black", DarkViolet);
ObjectSet("Libec"+5,OBJPROP_CORNER,2);
ObjectSet("Libec"+5,OBJPROP_XDISTANCE,20);
ObjectSet("Libec"+5,OBJPROP_YDISTANCE,47);
if (rod>rou) ObjectSet("Libec"+5,OBJPROP_COLOR,clrCrimson);
else if (rod<.0010) ObjectSet("Libec"+5,OBJPROP_COLOR,clrGray);
else ObjectSet("Libec"+5,OBJPROP_COLOR,clrBlack);
}
//////////////Pit Array
if (Period()==60){
i=0;
while (i<dotplot){
if (Close[i+3]<iMA(symbol,0,8,0,MODE_EMA,PRICE_OPEN,i+3) && Close[i+2]<iMA(symbol,0,8,0,MODE_EMA,PRICE_OPEN,i+2) && Close[i+1]<iMA(symbol,0,8,0,MODE_EMA,PRICE_OPEN,i+1))
pit[i]=-1;
if (Close[i+3]>iMA(symbol,0,8,0,MODE_EMA,PRICE_OPEN,i+3) && Close[i+2]>iMA(symbol,0,8,0,MODE_EMA,PRICE_OPEN,i+2) && Close[i+1]>iMA(symbol,0,8,0,MODE_EMA,PRICE_OPEN,i+1))
pit[i]=1;
i++;
}
deletetxt1("PENELOPE");
i=0;
while (i<dotplot){
ObjectCreate("PENELOPE"+i,OBJ_LABEL,0, 0,0);
ObjectSet("PENELOPE"+i,OBJPROP_CORNER,1);
ObjectSet("PENELOPE"+i,OBJPROP_XDISTANCE,305+i*16);
ObjectSet("PENELOPE"+i,OBJPROP_YDISTANCE,510);
ObjectSetText("PENELOPE"+i,CharToStr(108),19,"Wingdings");
ObjectSet("PENELOPE"+i,OBJPROP_COLOR,clrBlack);
if (pit[i]>0) ObjectSet("PENELOPE"+i,OBJPROP_COLOR,clrGreen);
if (pit[i]<0) ObjectSet("PENELOPE"+i,OBJPROP_COLOR,clrRed);
i++;
if (iBands(symbol,0,30,2,0,PRICE_MEDIAN,MODE_UPPER,i)-iBands(symbol,0,30,2,0,PRICE_MEDIAN,MODE_LOWER,i)>180*Point){
if (pit[i]==0 && pit[i+1]==0 && pit[i+2]<0 && High[i]>iBands(symbol,0,240,2,0,PRICE_MEDIAN,MODE_LOWER,i) ){
ObjectCreate("PENELOPEZi"+i,OBJ_TEXT, 0, Time[i+2], iLow(symbol,0,iLowest(symbol,0,MODE_LOW,3,i))+15*Point);
ObjectSetText("PENELOPEZi"+i,CharToStr(240),29,"Wingdings");
ObjectSet("PENELOPEZi"+i,OBJPROP_COLOR,clrBlack);
ObjectCreate("PENELOPEZii"+i,OBJ_TEXT, 0, Time[i+2], iLow(symbol,0,iLowest(symbol,0,MODE_LOW,3,i))-25*Point);
ObjectSetText("PENELOPEZii"+i,"B416p@ "+DoubleToStr(NormalizeDouble(iLow(symbol,0,iLowest(symbol,0,MODE_LOW,3,i)),4),4)+"-(5)",29,"Impact");
if (j>42) ObjectSetText("PENELOPEZii"+i,"B416p@ "+DoubleToStr(NormalizeDouble(iLow(symbol,0,iLowest(symbol,0,MODE_LOW,3,i))-70*Point,4),4)+"-(5)",29,"Impact");
ObjectSet("PENELOPEZii"+i,OBJPROP_COLOR,clrDarkGreen);
if (i>14) ObjectSet("PENELOPEZii"+i,OBJPROP_COLOR,clrBlue);
j=i-1;
while (j>0){
if (Low[j]<iLow(symbol,0,iLowest(symbol,0,MODE_LOW,3,i))-50*Point) {ObjectDelete("PENELOPEZii"+i); ObjectDelete("PENELOPEZi"+i);}
j--;
}
}
if (pit[i]==0 && pit[i+1]==0 && pit[i+2]>0 && Low[i]<iBands(symbol,0,240,2,0,PRICE_MEDIAN,MODE_UPPER,i)){
ObjectCreate("PENELOPEZi"+i,OBJ_TEXT, 0, Time[i+2], iHigh(symbol,0,iHighest(symbol,0,MODE_HIGH,2,i))+60*Point);
ObjectSetText("PENELOPEZi"+i,CharToStr(240),29,"Wingdings");
ObjectSet("PENELOPEZi"+i,OBJPROP_COLOR,clrBlack);
ObjectCreate("PENELOPEZii"+i,OBJ_TEXT, 0, Time[i+2], iHigh(symbol,0,iHighest(symbol,0,MODE_HIGH,2,i))+80*Point);
ObjectSetText("PENELOPEZii"+i,"S416p@ "+DoubleToStr(NormalizeDouble(iHigh(symbol,0,iHighest(symbol,0,MODE_HIGH,2,i)),4),4)+"+(5)",29,"Impact");
if (j>42) ObjectSetText("PENELOPEZii"+i,"S416p@ "+DoubleToStr(NormalizeDouble(iHigh(symbol,0,iHighest(symbol,0,MODE_HIGH,2,i))+70*Point,4),4)+"+(5)",29,"Impact");
ObjectSet("PENELOPEZii"+i,OBJPROP_COLOR,clrCrimson);
if (i>14) ObjectSet("PENELOPEZii"+i,OBJPROP_COLOR,clrBlue);
j=i-1;
while (j>0){
if (High[j]>iHigh(symbol,0,iHighest(symbol,0,MODE_HIGH,2,i))+50*Point) {ObjectDelete("PENELOPEZii"+i); ObjectDelete("PENELOPEZi"+i);}
j--;
}
}
}
}
if (Close[0]>iMA(symbol,0,8,0,MODE_EMA,PRICE_MEDIAN,207)){
if (pit[10]==0 && Close[11]<iMA(symbol,0,8,0,MODE_EMA,PRICE_OPEN,11)
&& (Close[10]>iMA(symbol,0,8,0,MODE_EMA,PRICE_OPEN,10)+50*Point || (Close[10]>iMA(symbol,0,8,0,MODE_EMA,PRICE_OPEN,10) && Open[10]-Close[10]<30*Point)))
{
ObjectCreate("PENELOPEZ"+12,OBJ_LABEL,0, 0,0);
ObjectSet("PENELOPEZ"+12,OBJPROP_CORNER,1);
ObjectSet("PENELOPEZ"+12,OBJPROP_XDISTANCE,440);
ObjectSet("PENELOPEZ"+12,OBJPROP_YDISTANCE,490);
ObjectSetText("PENELOPEZ"+12,CharToStr(241),19,"Wingdings");
ObjectSet("PENELOPEZ"+12,OBJPROP_COLOR,clrGreen);
}
if (pit[9]==0 && Close[10]<iMA(symbol,0,8,0,MODE_EMA,PRICE_OPEN,10)
&& (Close[9]>iMA(symbol,0,8,0,MODE_EMA,PRICE_OPEN,9)+50*Point || (Close[9]>iMA(symbol,0,8,0,MODE_EMA,PRICE_OPEN,9) && Open[9]-Close[9]<30*Point)))
{
ObjectCreate("PENELOPEZ"+13,OBJ_LABEL,0, 0,0);
ObjectSet("PENELOPEZ"+13,OBJPROP_CORNER,1);
ObjectSet("PENELOPEZ"+13,OBJPROP_XDISTANCE,425);
ObjectSet("PENELOPEZ"+13,OBJPROP_YDISTANCE,490);
ObjectSetText("PENELOPEZ"+13,CharToStr(241),19,"Wingdings");
ObjectSet("PENELOPEZ"+13,OBJPROP_COLOR,clrGreen);
}
if (pit[8]==0 && Close[9]<iMA(symbol,0,8,0,MODE_EMA,PRICE_OPEN,9)
&& (Close[8]>iMA(symbol,0,8,0,MODE_EMA,PRICE_OPEN,8)+50*Point || (Close[8]>iMA(symbol,0,8,0,MODE_EMA,PRICE_OPEN,8) && Open[8]-Close[8]<30*Point)))
{
ObjectCreate("PENELOPEZ"+14,OBJ_LABEL,0, 0,0);
ObjectSet("PENELOPEZ"+14,OBJPROP_CORNER,1);
ObjectSet("PENELOPEZ"+14,OBJPROP_XDISTANCE,410);
ObjectSet("PENELOPEZ"+14,OBJPROP_YDISTANCE,490);
ObjectSetText("PENELOPEZ"+14,CharToStr(241),19,"Wingdings");
ObjectSet("PENELOPEZ"+14,OBJPROP_COLOR,clrGreen);
}
if (pit[7]==0 && Close[8]<iMA(symbol,0,8,0,MODE_EMA,PRICE_OPEN,8)
&& (Close[7]>iMA(symbol,0,8,0,MODE_EMA,PRICE_OPEN,7)+50*Point || (Close[7]>iMA(symbol,0,8,0,MODE_EMA,PRICE_OPEN,7) && Open[7]-Close[7]<30*Point)))
{
ObjectCreate("PENELOPEZ"+15,OBJ_LABEL,0, 0,0);
ObjectSet("PENELOPEZ"+15,OBJPROP_CORNER,1);
ObjectSet("PENELOPEZ"+15,OBJPROP_XDISTANCE,395);
ObjectSet("PENELOPEZ"+15,OBJPROP_YDISTANCE,490);
ObjectSetText("PENELOPEZ"+15,CharToStr(241),19,"Wingdings");
ObjectSet("PENELOPEZ"+15,OBJPROP_COLOR,clrGreen);
}
if (pit[6]==0 && Close[7]<iMA(symbol,0,8,0,MODE_EMA,PRICE_OPEN,7)
&& (Close[6]>iMA(symbol,0,8,0,MODE_EMA,PRICE_OPEN,6)+50*Point || (Close[6]>iMA(symbol,0,8,0,MODE_EMA,PRICE_OPEN,6) && Open[6]-Close[6]<30*Point)))
{
ObjectCreate("PENELOPEZ"+15,OBJ_LABEL,0, 0,0);
ObjectSet("PENELOPEZ"+15,OBJPROP_CORNER,1);
ObjectSet("PENELOPEZ"+15,OBJPROP_XDISTANCE,380);
ObjectSet("PENELOPEZ"+15,OBJPROP_YDISTANCE,490);
ObjectSetText("PENELOPEZ"+15,CharToStr(241),19,"Wingdings");
ObjectSet("PENELOPEZ"+15,OBJPROP_COLOR,clrGreen);
}
if (pit[5]==0 && Close[6]<iMA(symbol,0,8,0,MODE_EMA,PRICE_OPEN,6)
&& (Close[5]>iMA(symbol,0,8,0,MODE_EMA,PRICE_OPEN,5)+50*Point || (Close[5]>iMA(symbol,0,8,0,MODE_EMA,PRICE_OPEN,5) && Open[5]-Close[5]<30*Point)))
{
ObjectCreate("PENELOPEZ"+16,OBJ_LABEL,0, 0,0);
ObjectSet("PENELOPEZ"+16,OBJPROP_CORNER,1);
ObjectSet("PENELOPEZ"+16,OBJPROP_XDISTANCE,365);
ObjectSet("PENELOPEZ"+16,OBJPROP_YDISTANCE,490);
ObjectSetText("PENELOPEZ"+16,CharToStr(241),19,"Wingdings");
ObjectSet("PENELOPEZ"+16,OBJPROP_COLOR,clrGreen);
}
if (pit[4]==0 && Close[5]<iMA(symbol,0,8,0,MODE_EMA,PRICE_OPEN,5)
&& (Close[4]>iMA(symbol,0,8,0,MODE_EMA,PRICE_OPEN,4)+50*Point || (Close[4]>iMA(symbol,0,8,0,MODE_EMA,PRICE_OPEN,4) && Open[4]-Close[4]<30*Point)))
{
ObjectCreate("PENELOPEZ"+17,OBJ_LABEL,0, 0,0);
ObjectSet("PENELOPEZ"+17,OBJPROP_CORNER,1);
ObjectSet("PENELOPEZ"+17,OBJPROP_XDISTANCE,350);
ObjectSet("PENELOPEZ"+17,OBJPROP_YDISTANCE,490);
ObjectSetText("PENELOPEZ"+17,CharToStr(241),19,"Wingdings");
ObjectSet("PENELOPEZ"+17,OBJPROP_COLOR,clrGreen);
}
if (pit[3]==0 && Close[4]<iMA(symbol,0,8,0,MODE_EMA,PRICE_OPEN,4)
&& (Close[3]>iMA(symbol,0,8,0,MODE_EMA,PRICE_OPEN,3)+50*Point || (Close[3]>iMA(symbol,0,8,0,MODE_EMA,PRICE_OPEN,3) && Open[3]-Close[3]<30*Point)))
{
ObjectCreate("PENELOPEZ"+18,OBJ_LABEL,0, 0,0);
ObjectSet("PENELOPEZ"+18,OBJPROP_CORNER,1);
ObjectSet("PENELOPEZ"+18,OBJPROP_XDISTANCE,335);
ObjectSet("PENELOPEZ"+18,OBJPROP_YDISTANCE,490);
ObjectSetText("PENELOPEZ"+18,CharToStr(241),19,"Wingdings");
ObjectSet("PENELOPEZ"+18,OBJPROP_COLOR,clrGreen);
}
if (pit[2]==0 && Close[3]<iMA(symbol,0,8,0,MODE_EMA,PRICE_OPEN,3)
&& (Close[2]>iMA(symbol,0,8,0,MODE_EMA,PRICE_OPEN,2)+50*Point || (Close[2]>iMA(symbol,0,8,0,MODE_EMA,PRICE_OPEN,2) && Open[2]-Close[2]<30*Point)))
{
ObjectCreate("PENELOPEZ"+19,OBJ_LABEL,0, 0,0);
ObjectSet("PENELOPEZ"+19,OBJPROP_CORNER,1);
ObjectSet("PENELOPEZ"+19,OBJPROP_XDISTANCE,320);
ObjectSet("PENELOPEZ"+19,OBJPROP_YDISTANCE,490);
ObjectSetText("PENELOPEZ"+19,CharToStr(241),19,"Wingdings");
ObjectSet("PENELOPEZ"+19,OBJPROP_COLOR,clrGreen);
}
if (pit[1]==0 && Close[2]<iMA(symbol,0,8,0,MODE_EMA,PRICE_OPEN,2)
&& (Close[1]>iMA(symbol,0,8,0,MODE_EMA,PRICE_OPEN,1)+50*Point || (Close[1]>iMA(symbol,0,8,0,MODE_EMA,PRICE_OPEN,1) && Open[1]-Close[1]<30*Point)))
{
ObjectCreate("PENELOPEZ"+20,OBJ_LABEL,0, 0,0);
ObjectSet("PENELOPEZ"+20,OBJPROP_CORNER,1);
ObjectSet("PENELOPEZ"+20,OBJPROP_XDISTANCE,305);
ObjectSet("PENELOPEZ"+20,OBJPROP_YDISTANCE,490);
ObjectSetText("PENELOPEZ"+20,CharToStr(241),19,"Wingdings");
ObjectSet("PENELOPEZ"+20,OBJPROP_COLOR,clrGreen);
}
}
}
deletetxt1("DEVELOPE");
if (Period()<1440){
ObjectCreate("DEVELOPE"+0,OBJ_TEXT,indicator_window, Time[0],41);
ObjectSetText("DEVELOPE"+0," S0: "+DoubleToStr(NormalizeDouble(iHigh(symbol,0,iHighest(symbol,0,MODE_HIGH,200,0))-400*Point,4),4),19,"Impact",clrGray);
ObjectCreate("DEVELOPE"+1,OBJ_TEXT,indicator_window, Time[0],63);
ObjectSetText("DEVELOPE"+1," S1: "+DoubleToStr(NormalizeDouble(iHigh(symbol,0,iHighest(symbol,0,MODE_HIGH,200,0))-600*Point,4),4),19,"Impact",clrBlue);
ObjectCreate("DEVELOPE"+2,OBJ_TEXT,indicator_window, Time[0],79);
ObjectSetText("DEVELOPE"+2," S2: "+DoubleToStr(NormalizeDouble(iHigh(symbol,0,iHighest(symbol,0,MODE_HIGH,200,0))-760*Point,4),4),19,"Impact",clrBlue);
ObjectCreate("DEVELOPE"+3,OBJ_TEXT,indicator_window, Time[0],95);
ObjectSetText("DEVELOPE"+3," S3: "+DoubleToStr(NormalizeDouble(iHigh(symbol,0,iHighest(symbol,0,MODE_HIGH,200,0))-940*Point,4),4),19,"Impact",clrPurple);
ObjectCreate("DEVELOPE"+11,OBJ_TEXT,indicator_window, Time[0],25);
ObjectSetText("DEVELOPE"+11," E: "+DoubleToStr(NormalizeDouble(iHigh(symbol,0,iHighest(symbol,0,MODE_HIGH,200,0))-300*Point,4),4),19,"Impact",clrMagenta);
ObjectCreate("DEVELOPE"+12,OBJ_TEXT,indicator_window, Time[0],115);
ObjectSetText("DEVELOPE"+12," SOB: "+DoubleToStr(NormalizeDouble(iHigh(symbol,0,iHighest(symbol,0,MODE_HIGH,200,0))-470*Point,4),4),19,"Impact",clrYellow);
ObjectCreate("Firstpullz", OBJ_TREND, 0, Time[2], iHigh(symbol,0,iHighest(symbol,0,MODE_HIGH,200,0))-470*Point, Time[0], iHigh(symbol,0,iHighest(symbol,0,MODE_HIGH,200,0))-470*Point);
ObjectSetInteger(0,"Firstpullz",OBJPROP_COLOR,clrYellow);
ObjectSet("Firstpullz",OBJPROP_BACK,0);
ObjectSet("Firstpullz",OBJPROP_RAY_RIGHT,true);
ObjectSet("Firstpullz",OBJPROP_WIDTH,6);
ObjectCreate("Firstpullx", OBJ_TREND, 0, Time[2], iHigh(symbol,0,iHighest(symbol,0,MODE_HIGH,200,0))-470*Point, Time[0], iHigh(symbol,0,iHighest(symbol,0,MODE_HIGH,200,0))-470*Point);
ObjectSetInteger(0,"Firstpullx",OBJPROP_COLOR,clrPurple);
ObjectSet("Firstpullx",OBJPROP_BACK,1);
ObjectSet("Firstpullx",OBJPROP_RAY_RIGHT,true);
ObjectSet("Firstpullx",OBJPROP_WIDTH,12);
if (ExtATRBuffer[0]>ExtATRBuffer2[0]){
ObjectSetText("DEVELOPE"+0," R0: "+DoubleToStr(NormalizeDouble(iLow(symbol,0,iLowest(symbol,0,MODE_LOW,200,0))+400*Point,4),4),19,"Impact",clrGray);
ObjectSetText("DEVELOPE"+1," R1: "+DoubleToStr(NormalizeDouble(iLow(symbol,0,iLowest(symbol,0,MODE_LOW,200,0))+600*Point,4),4),19,"Impact",clrBlue);
ObjectSetText("DEVELOPE"+2," R2: "+DoubleToStr(NormalizeDouble(iLow(symbol,0,iLowest(symbol,0,MODE_LOW,200,0))+760*Point,4),4),19,"Impact",clrBlue);
ObjectSetText("DEVELOPE"+3," R3: "+DoubleToStr(NormalizeDouble(iLow(symbol,0,iLowest(symbol,0,MODE_LOW,200,0))+940*Point,4),4),19,"Impact",clrPurple);
ObjectSetText("DEVELOPE"+11," E: "+DoubleToStr(NormalizeDouble(iLow(symbol,0,iLowest(symbol,0,MODE_LOW,200,0))+300*Point,4),4),19,"Impact",clrMagenta);
ObjectSetText("DEVELOPE"+12," SOB: "+DoubleToStr(NormalizeDouble(iLow(symbol,0,iLowest(symbol,0,MODE_LOW,200,0))+470*Point,4),4),19,"Impact",clrYellow);
ObjectDelete("Firstpullz");
ObjectDelete("Firstpullx");
ObjectCreate("Firstpullz", OBJ_TREND, 0, Time[2], iLow(symbol,0,iLowest(symbol,0,MODE_LOW,200,0))+470*Point, Time[0], iLow(symbol,0,iLowest(symbol,0,MODE_LOW,200,0))+470*Point);
ObjectSetInteger(0,"Firstpullz",OBJPROP_COLOR,clrYellow);
ObjectSet("Firstpullz",OBJPROP_BACK,0);
ObjectSet("Firstpullz",OBJPROP_RAY_RIGHT,true);
ObjectSet("Firstpullz",OBJPROP_WIDTH,6);
ObjectCreate("Firstpullx", OBJ_TREND, 0, Time[2], iLow(symbol,0,iLowest(symbol,0,MODE_LOW,200,0))+470*Point, Time[0], iLow(symbol,0,iLowest(symbol,0,MODE_LOW,200,0))+470*Point);
ObjectSetInteger(0,"Firstpullx",OBJPROP_COLOR,clrPurple);
ObjectSet("Firstpullx",OBJPROP_BACK,1);
ObjectSet("Firstpullx",OBJPROP_RAY_RIGHT,true);
ObjectSet("Firstpullx",OBJPROP_WIDTH,12);
}
ObjectCreate("Firstpullyy", OBJ_TREND, 0, Time[2], tensharp[0], Time[0], tensharp[0]);
ObjectSetInteger(0,"Firstpullyy",OBJPROP_COLOR,clrPurple);
ObjectSet("Firstpullyy",OBJPROP_BACK,1);
ObjectSet("Firstpullyy",OBJPROP_RAY_RIGHT,true);
ObjectSet("Firstpullyy",OBJPROP_WIDTH,6);
if (Close[0]>iMA(symbol,0,240,0,MODE_SMA,PRICE_MEDIAN,0)){
ObjectCreate("DEVELOPE"+14,OBJ_TEXT,0, Time[0],tensharp[0]+30*Point);
ObjectSetText("DEVELOPE"+14," Cover >"+DoubleToStr(NormalizeDouble(tensharp[0],4),4),19,"Arial Black",clrBlack);
ObjectCreate("DEVELOPE"+16,OBJ_LABEL,1, 0,0);
ObjectSet("DEVELOPE"+16,OBJPROP_CORNER,1);
ObjectSet("DEVELOPE"+16,OBJPROP_XDISTANCE,0);
ObjectSet("DEVELOPE"+16,OBJPROP_YDISTANCE,20);
ObjectSet("DEVELOPE"+16,OBJPROP_COLOR,clrWhite);
ObjectSetText("DEVELOPE"+16,"Cover Level: "+DoubleToStr(NormalizeDouble(tensharp[0],4),4),19,"Arial Black");
}
else {ObjectCreate("DEVELOPE"+14,OBJ_TEXT,0, Time[0],tensharp[0]-10*Point);
ObjectSetText("DEVELOPE"+14," Cover <"+DoubleToStr(NormalizeDouble(tensharp[0],4),4),19,"Arial Black",clrBlack);
ObjectCreate("DEVELOPE"+16,OBJ_LABEL,1, 0,0);
ObjectSet("DEVELOPE"+16,OBJPROP_CORNER,1);
ObjectSet("DEVELOPE"+16,OBJPROP_XDISTANCE,0);
ObjectSet("DEVELOPE"+16,OBJPROP_YDISTANCE,20);
ObjectSet("DEVELOPE"+16,OBJPROP_COLOR,clrWhite);
ObjectSetText("DEVELOPE"+16,"Cover Level: "+DoubleToStr(NormalizeDouble(tensharp[0],4),4),19,"Arial Black");
}
ObjectCreate("DEVELOPE"+5,OBJ_TEXT,indicator_window, Time[0],49);
ObjectSetText("DEVELOPE"+5," W3M",19,"Impact",clrBlack);
ObjectCreate("DEVELOPE"+10,OBJ_TEXT,indicator_window, Time[0],41);
ObjectSetText("DEVELOPE"+10," GL",19,"Impact",clrBlack);
ObjectCreate("DEVELOPE"+4,OBJ_LABEL,indicator_window, 0,0);
ObjectSet("DEVELOPE"+4,OBJPROP_CORNER,1);
ObjectSet("DEVELOPE"+4,OBJPROP_XDISTANCE,0);
ObjectSet("DEVELOPE"+4,OBJPROP_YDISTANCE,140);
ObjectSet("DEVELOPE"+4,OBJPROP_COLOR,clrPowderBlue);
ObjectSetText("DEVELOPE"+4,"B: K/Fractal",19,"Arial Black");
ObjectCreate("DEVELOPE"+6,OBJ_LABEL,indicator_window, 0,0);
ObjectSet("DEVELOPE"+6,OBJPROP_CORNER,1);
ObjectSet("DEVELOPE"+6,OBJPROP_XDISTANCE,0);
ObjectSet("DEVELOPE"+6,OBJPROP_YDISTANCE,20);
ObjectSet("DEVELOPE"+6,OBJPROP_COLOR,clrYellow);
ObjectSetText("DEVELOPE"+6,"Y: 210+",19,"Arial Black");
ObjectCreate("DEVELOPE"+9,OBJ_LABEL,indicator_window, 0,0);
ObjectSet("DEVELOPE"+9,OBJPROP_CORNER,1);
ObjectSet("DEVELOPE"+9,OBJPROP_XDISTANCE,0);
ObjectSet("DEVELOPE"+9,OBJPROP_YDISTANCE,50);
ObjectSet("DEVELOPE"+9,OBJPROP_COLOR,clrGray);
ObjectSetText("DEVELOPE"+9,"G,G: 140+",19,"Arial Black");
ObjectCreate("DEVELOPE"+8,OBJ_LABEL,indicator_window, 0,0);
ObjectSet("DEVELOPE"+8,OBJPROP_CORNER,1);
ObjectSet("DEVELOPE"+8,OBJPROP_XDISTANCE,0);
ObjectSet("DEVELOPE"+8,OBJPROP_YDISTANCE,80);
ObjectSet("DEVELOPE"+8,OBJPROP_COLOR,clrGray);
ObjectSetText("DEVELOPE"+8,"G: 88+(<135)",19,"Arial Black");
ObjectCreate("DEVELOPE"+7,OBJ_LABEL,indicator_window, 0,0);
ObjectSet("DEVELOPE"+7,OBJPROP_CORNER,1);
ObjectSet("DEVELOPE"+7,OBJPROP_XDISTANCE,0);
ObjectSet("DEVELOPE"+7,OBJPROP_YDISTANCE,110);
ObjectSet("DEVELOPE"+7,OBJPROP_COLOR,clrPink);
ObjectSetText("DEVELOPE"+7,"P: 65+",19,"Arial Black");
}
ObjectCreate("Firstpullw", OBJ_TREND, 0, Time[2], level, Time[0], level);
ObjectSetInteger(0,"Firstpullw",OBJPROP_COLOR,clrBlack);
ObjectSet("Firstpullw",OBJPROP_BACK,1);
ObjectSet("Firstpullw",OBJPROP_RAY_RIGHT,true);
ObjectSet("Firstpullw",OBJPROP_WIDTH,12);
ObjectCreate("Firstpully", OBJ_TREND, 0, Time[2], level, Time[0], level);
if (Close[0]>level) ObjectSetInteger(0,"Firstpully",OBJPROP_COLOR,clrGreen);
else ObjectSetInteger(0,"Firstpully",OBJPROP_COLOR,clrRed);
ObjectSet("Firstpully",OBJPROP_BACK,0);
ObjectSet("Firstpully",OBJPROP_RAY_RIGHT,true);
ObjectSet("Firstpully",OBJPROP_WIDTH,6);
//deletetxt1("PENELOPE");
if (sample<31 && Period()==60){
ObjectCreate("PENELOPED"+6,OBJ_LABEL,2, 0,0);
ObjectSet("PENELOPED"+6,OBJPROP_CORNER,1);
ObjectSet("PENELOPED"+6,OBJPROP_XDISTANCE,0);
ObjectSet("PENELOPED"+6,OBJPROP_YDISTANCE,20);
ObjectSet("PENELOPED"+6,OBJPROP_COLOR,clrGray);
if (ExtATRBuffer[0]>24 && ExtATRBuffer[0]<32 && ExtATRBuffer[1]<28 && ExtATRBuffer[2]<28) ObjectSet("PENELOPED"+6,OBJPROP_COLOR,clrYellow);
ObjectSetText("PENELOPED"+6,DoubleToStr(NormalizeDouble(ExtATRBuffer[0],2),1)+" "+DoubleToStr(NormalizeDouble(ExtATRBuffer[ArrayMaximum(ExtATRBuffer,10,0)],2),1),19,"Arial Black");
if (dir[0]<0 && ExtATRBuffer[ArrayMaximum(ExtATRBuffer,10,0)]<35 && RSI2[ArrayMaximum(RSI2,10,0)]>8) {ObjectSetText("PENELOPED"+6,"TBUY "+DoubleToStr(NormalizeDouble(ExtATRBuffer[0],2),1)+" "+DoubleToStr(NormalizeDouble(ExtATRBuffer[ArrayMaximum(ExtATRBuffer,10,0)],2),1),19,"Arial Black");
ObjectSet("PENELOPED"+6,OBJPROP_COLOR,clrGreen);
}
ObjectCreate("PENELOPED"+9,OBJ_LABEL,2, 0,0);
ObjectSet("PENELOPED"+9,OBJPROP_CORNER,3);
ObjectSet("PENELOPED"+9,OBJPROP_XDISTANCE,0);
ObjectSet("PENELOPED"+9,OBJPROP_YDISTANCE,20);
ObjectSet("PENELOPED"+9,OBJPROP_COLOR,clrGray);
ObjectSetText("PENELOPED"+9,DoubleToStr(NormalizeDouble(ExtATRBuffer2[0],2),1)+" "+DoubleToStr(NormalizeDouble(ExtATRBuffer2[ArrayMaximum(ExtATRBuffer2,10,0)],2),1),19,"Arial Black");
if (ExtATRBuffer2[0]>24 && ExtATRBuffer2[0]<32 && ExtATRBuffer2[1]<28 && ExtATRBuffer2[2]<28) ObjectSet("PENELOPED"+9,OBJPROP_COLOR,clrYellow);
if (dir[0]>0 && ExtATRBuffer2[ArrayMaximum(ExtATRBuffer2,10,0)]<35 && RSI2[ArrayMaximum(RSI2,10,0)]<92) {ObjectSetText("PENELOPED"+9,"TSELL "+DoubleToStr(NormalizeDouble(ExtATRBuffer2[0],2),1)+" "+DoubleToStr(NormalizeDouble(ExtATRBuffer2[ArrayMaximum(ExtATRBuffer2,10,0)],2),1),19,"Arial Black");
ObjectSet("PENELOPED"+9,OBJPROP_COLOR,clrRed);
}
}
if (Period()==60 && sample<31){
deletetxt1("Singende");
deletetxt1("Frogger");
deletetxt1("Bacardo");
for(i = lookback; i >= 0; i--){
///breaker wave coming up
if (ExtATRBuffer[i]>36 && ExtATRBuffer2[i]>15 && ExtATRBuffer2[i+1]<15 && Close[i]>Open[i]-50*Point && !(ExtATRBuffer[i]>41 && ExtATRBuffer[i]<53) && ExtATRBuffer[i+2]<62
&& dir[i]>-1
){
ObjectCreate("LINUSS"+IntegerToString(i),OBJ_VLINE,1, Time[i], 0);
ObjectSet("LINUSS"+IntegerToString(i),OBJPROP_COLOR,clrLimeGreen);
ObjectSet("LINUSS"+IntegerToString(i),OBJPROP_WIDTH,6);
ObjectSet("LINUSS"+IntegerToString(i),OBJPROP_STYLE,STYLE_DOT);
ObjectSet("LINUSS"+IntegerToString(i),OBJPROP_BACK,1);
}
///breaker wave coming down
if (ExtATRBuffer2[i]>36 && ExtATRBuffer[i]>15 && ExtATRBuffer[i+1]<15 && ExtATRBuffer2[i]<=ExtATRBuffer2[i+1]
&& ExtATRBuffer2[i+1]<=ExtATRBuffer2[i+2]
){
ObjectCreate("LINUSS"+IntegerToString(i),OBJ_VLINE,1, Time[i], 0);
ObjectSet("LINUSS"+IntegerToString(i),OBJPROP_COLOR,clrCoral);
ObjectSet("LINUSS"+IntegerToString(i),OBJPROP_WIDTH,6);
ObjectSet("LINUSS"+IntegerToString(i),OBJPROP_STYLE,STYLE_DOT);
ObjectSet("LINUSS"+IntegerToString(i),OBJPROP_BACK,1);
}
///volatility expansion eval - buy side
if (dir[i]>-1 && ExtATRBuffer2[i]>24 && ExtATRBuffer2[i]<32 && ExtATRBuffer2[i+1]<28 && ExtATRBuffer2[i+2]<28
&& (iBands(symbol,0,240,2,0,PRICE_MEDIAN,MODE_UPPER,i)-iBands(symbol,0,240,2,0,PRICE_MEDIAN,MODE_LOWER,i))>1000*Point
&& magenta[ArrayMaximum(magenta,20,i)]<1
){
if ((Low[i]>iMA(symbol,0,8,0,MODE_EMA,PRICE_OPEN,i) && Low[i+1]>iMA(symbol,0,8,0,MODE_EMA,PRICE_OPEN,i+1) && Low[i+2]>iMA(symbol,0,8,0,MODE_EMA,PRICE_OPEN,i+2) && Close[i+3]>iMA(symbol,0,8,0,MODE_EMA,PRICE_OPEN,i+3))
|| (Close[i]>iMA(symbol,0,8,0,MODE_EMA,PRICE_OPEN,i)+80*Point && Close[i+1]<iMA(symbol,0,8,0,MODE_EMA,PRICE_OPEN,i+1)+40*Point && Close[i+1]>iMA(symbol,0,8,0,MODE_EMA,PRICE_OPEN,i+1)-20*Point)
)
{ if (High[i+2]<iBands(symbol,0,240,2,0,PRICE_MEDIAN,MODE_UPPER,i+2))
ObjectCreate("HOTS"+i,OBJ_TEXT, 2, Time[i],ExtATRBuffer2[i]+30);
ObjectSetText("HOTS"+i,CharToStr(241), 56, "Wingdings", clrDarkGreen);
}
else if ((Close[i]>iMA(symbol,0,8,0,MODE_EMA,PRICE_OPEN,i) || Close[i+1]>iMA(symbol,0,8,0,MODE_EMA,PRICE_OPEN,i+1)) &&
High[i+2]<iBands(symbol,0,240,2,0,PRICE_MEDIAN,MODE_MAIN,i+2) && Low[i+2]>iBands(symbol,0,240,2,0,PRICE_MEDIAN,MODE_LOWER,i+2)){
ObjectCreate("HOTS"+i,OBJ_TEXT, 2, Time[i],ExtATRBuffer2[i]+30);
ObjectSetText("HOTS"+i,CharToStr(242), 56, "Wingdings", clrCrimson);
}
}
///volatility expansion eval - sell side
if (dir[i]<1 && ExtATRBuffer[i]>24 && ExtATRBuffer[i]<32 && ExtATRBuffer[i+1]<28 && ExtATRBuffer[i+2]<28
&& (iBands(symbol,0,240,2,0,PRICE_MEDIAN,MODE_UPPER,i)-iBands(symbol,0,240,2,0,PRICE_MEDIAN,MODE_LOWER,i))>1000*Point
){
if ((High[i]<iMA(symbol,0,8,0,MODE_EMA,PRICE_OPEN,i) && High[i+1]<iMA(symbol,0,8,0,MODE_EMA,PRICE_OPEN,i+1) && High[i+2]<iMA(symbol,0,8,0,MODE_EMA,PRICE_OPEN,i+2) && Close[i+3]<iMA(symbol,0,8,0,MODE_EMA,PRICE_OPEN,i+3))
|| (Close[i]<iMA(symbol,0,8,0,MODE_EMA,PRICE_OPEN,i)-80*Point && Close[i+1]>iMA(symbol,0,8,0,MODE_EMA,PRICE_OPEN,i+1)+40*Point && Close[i+1]>iMA(symbol,0,8,0,MODE_EMA,PRICE_OPEN,i+1)+20*Point)
)
{ if (Low[i+2]>iBands(symbol,0,240,2,0,PRICE_MEDIAN,MODE_LOWER,i+2))
ObjectCreate("HOTS"+i,OBJ_TEXT, 2, Time[i],ExtATRBuffer[i]+30);
ObjectSetText("HOTS"+i,CharToStr(234), 56, "Wingdings", clrCrimson);
}
else if ((Close[i]<iMA(symbol,0,8,0,MODE_EMA,PRICE_OPEN,i) || Close[i+1]<iMA(symbol,0,8,0,MODE_EMA,PRICE_OPEN,i+1)) &&
Low[i+2]>iBands(symbol,0,240,2,0,PRICE_MEDIAN,MODE_MAIN,i+2) && High[i+2]<iBands(symbol,0,240,2,0,PRICE_MEDIAN,MODE_LOWER,i+2)){
ObjectCreate("HOTS"+i,OBJ_TEXT, 2, Time[i],ExtATRBuffer[i]+30);
ObjectSetText("HOTS"+i,CharToStr(233), 56, "Wingdings", clrDarkGreen);
}
}
///shape long
if ((i>0 && ExtATRBuffer[i]<52 && ExtATRBuffer[i+1]>52 && ExtATRBuffer[i]>ExtATRBuffer2[i]-10 && ExtATRBuffer[i-1]<ExtATRBuffer[i+1]
&& ExtATRBuffer2[ArrayMinimum(ExtATRBuffer2,10,i)]>1.8
&& ExtATRBuffer[ArrayMaximum(ExtATRBuffer,10,i)]<64)
|| (((ExtATRBuffer[i]<42 && ExtATRBuffer[i+1]>42) || (ExtATRBuffer[i]<47 && ExtATRBuffer[i+1]>47))
&& Close[i+2]<iBands(symbol,0,240,2,0,PRICE_MEDIAN,MODE_LOWER,i+2)
&& ((Close[i]>iBands(symbol,0,240,2,0,PRICE_MEDIAN,MODE_LOWER,i)-50*Point && Close[i+3]<iBands(symbol,0,240,2,0,PRICE_MEDIAN,MODE_LOWER,i+3))
|| Close[i+1]>iBands(symbol,0,240,2,0,PRICE_MEDIAN,MODE_LOWER,i+1))
))
{
ObjectCreate("LINUS"+IntegerToString(i),OBJ_VLINE,2, Time[i], 0);
ObjectSet("LINUS"+IntegerToString(i),OBJPROP_COLOR,clrPurple);
ObjectSet("LINUS"+IntegerToString(i),OBJPROP_WIDTH,6);
ObjectSet("LINUS"+IntegerToString(i),OBJPROP_STYLE,STYLE_DOT);
ObjectSet("LINUS"+IntegerToString(i),OBJPROP_BACK,1);
if (Low[i]>iBands(symbol,0,240,2,0,PRICE_MEDIAN,MODE_LOWER,i) && !((Low[i+1]<iMA(symbol,0,207,0,MODE_EMA,PRICE_LOW,i+1) && Close[i+1]>iMA(symbol,0,207,0,MODE_EMA,PRICE_LOW,i+1)) || (Low[i+2]<iMA(symbol,0,207,0,MODE_EMA,PRICE_LOW,i+2) && Close[i+2]>iMA(symbol,0,207,0,MODE_EMA,PRICE_LOW,i+2))))
{ObjectSet("LINUS"+IntegerToString(i),OBJPROP_COLOR,clrGray);
if (ExtATRBuffer2[i]<6) ObjectSet("LINUS"+IntegerToString(i),OBJPROP_COLOR,clrBlack);
else if ((ExtATRBuffer2[i]>ExtATRBuffer2[i+1]) || ExtATRBuffer2[i]>30) { ObjectCreate("LINUSZZS"+IntegerToString(i),OBJ_TEXT, 2, Time[i],25);
ObjectSetText("LINUSZZS"+IntegerToString(i),"14 Hrs Immunity", 16, "Impact", clrDarkGreen);
if (magenta[ArrayMaximum(magenta,100,i)]>0) {ObjectSetText("LINUSZZS"+IntegerToString(i),"44-47 Hrs of Immunity", 16, "Impact", clrDarkGreen);
ObjectSet("LINUS"+IntegerToString(i),OBJPROP_COLOR,clrMagenta);
magenta[i]=1;
}
}
if (Low[i+1]-iBands(symbol,0,240,2,0,PRICE_MEDIAN,MODE_LOWER,i+1)>240*Point)
{ObjectCreate("LINUSZZZ"+IntegerToString(i),OBJ_TEXT, 1, Time[i],15);
ObjectSetText("LINUSZZZ"+IntegerToString(i),"Dip Below 8-24 pips=buy", 16, "Impact", clrGreen);}
}
if (((ExtATRBuffer[i]<42 && ExtATRBuffer[i+1]>42) ) && Close[i+2]<iBands(symbol,0,240,2,0,PRICE_MEDIAN,MODE_LOWER,i+2) && Close[i+1]>iBands(symbol,0,240,2,0,PRICE_MEDIAN,MODE_LOWER,i+1))
{ObjectSet("LINUS"+IntegerToString(i),OBJPROP_COLOR,clrGray);
if (ExtATRBuffer2[i]<6) ObjectSet("LINUS"+IntegerToString(i),OBJPROP_COLOR,clrBlack);
ObjectCreate("LINUSZZZ"+IntegerToString(i),OBJ_TEXT, 1, Time[i],15);
ObjectSetText("LINUSZZZ"+IntegerToString(i),"Dip Below 8-24 pips=buy", 16, "Impact", clrGreen);
if (Low[i+1]<iBands(symbol,0,240,2,0,PRICE_MEDIAN,MODE_LOWER,i+1)) {ObjectSet("LINUS"+IntegerToString(i),OBJPROP_COLOR,clrBlue);
ObjectCreate("LINUSZZS"+IntegerToString(i),OBJ_TEXT, 2, Time[i],25);
ObjectSetText("LINUSZZS"+IntegerToString(i),"64 Hrs Immunity", 16, "Impact", clrDarkGreen);
}
}
ObjectCreate("LINUSZ"+IntegerToString(i),OBJ_TEXT, 1, Time[i],85);
ObjectSetText("LINUSZ"+IntegerToString(i),"Shape long!", 16, "Impact", clrGreen);
ObjectCreate("LINUSZZ"+IntegerToString(i),OBJ_TEXT, 1, Time[i],35);
ObjectSetText("LINUSZZ"+IntegerToString(i),"53/63/80=Break", 16, "Impact", clrGreen);
if (Close[i]<iMA(symbol,0,207,0,MODE_EMA,PRICE_MEDIAN,i)-600*Point)
{
ObjectCreate("LINUSZZZ"+IntegerToString(i),OBJ_TEXT, 1, Time[i],75); ObjectSetText("LINUSZZZ"+IntegerToString(i),"Continuation sell", 16, "Impact", clrCrimson);
}
if (Close[i]>iBands(symbol,0,240,2,0,PRICE_MEDIAN,MODE_LOWER,i)-50*Point && Close[i+3]<iBands(symbol,0,240,2,0,PRICE_MEDIAN,MODE_LOWER,i+3)){ ObjectSet("LINUS"+IntegerToString(i),OBJPROP_COLOR,clrMagenta);
ObjectCreate("LINUSZZS"+IntegerToString(i),OBJ_TEXT, 2, Time[i],25);
ObjectSetText("LINUSZZS"+IntegerToString(i),"23/46Hrs Immunity", 16, "Impact", clrDarkGreen);
ObjectDelete("LINUSZZ"+IntegerToString(i));
ObjectDelete("LINUSZZZ"+IntegerToString(i));
ObjectCreate("LINUSZZ"+IntegerToString(i),OBJ_TEXT, 1, Time[i],65);
ObjectSetText("LINUSZZ"+IntegerToString(i),"Sell 207L / 207H+FMax", 16, "Impact", clrCrimson);
ObjectCreate("LINUSZZZS"+IntegerToString(i),OBJ_TEXT, 1, Time[i],35);
ObjectSetText("LINUSZZZS"+IntegerToString(i),"NEXT Hoop is Final below Mag. vol line", 16, "Impact", clrGreen);
ObjectCreate("LINUSZZZ"+IntegerToString(i),OBJ_TEXT, 1, Time[i],15);
ObjectSetText("LINUSZZZ"+IntegerToString(i),"Buy LL 25-50 pips lower", 16, "Impact", clrGreen);
if (magenta[ArrayMaximum(magenta,80,i)]>0){
ObjectSetText("LINUSZZ"+IntegerToString(i),"2nd attempt, Low In", 16, "Impact", clrGreen);
ObjectSetText("LINUSZZS"+IntegerToString(i),"46 Hrs Immunity", 16, "Impact", clrDarkGreen);
ObjectDelete("LINUSZZZ"+IntegerToString(i));
ObjectDelete("LINUSZZZS"+IntegerToString(i));
}
magenta[i]=1;
}
}
///shape short
if (((ExtATRBuffer2[i]<52 && ExtATRBuffer2[i+1]>52) || (( ExtATRBuffer2[i]<47 && ExtATRBuffer2[i+1]>47) || ( ExtATRBuffer2[i]<41 && ExtATRBuffer2[i+1]>41 && dir[i]<1) ))
//&& ExtATRBuffer2[ArrayMaximum(ExtATRBuffer2,10,i)]<64
&& ExtATRBuffer2[i+3]>10
//&& (ExtATRBuffer2[i+2]<40 || ExtATRBuffer2[i+2]>50)
&& ExtATRBuffer[ArrayMinimum(ExtATRBuffer,10,i)]>2
&& ExtATRBuffer[ArrayMaximum(ExtATRBuffer,10,i)]<64
&& Open[i+7]<iBands(symbol,0,240,2,0,PRICE_MEDIAN,MODE_UPPER,i+7)
&& Close[i]>iHigh(symbol,0,iHighest(symbol,0,MODE_HIGH,6,i))-240*Point
&& Close[i]>iBands(symbol,0,240,2,0,PRICE_MEDIAN,MODE_UPPER,i)-240*Point
)
{
ObjectCreate("LINUS"+IntegerToString(i),OBJ_VLINE,2, Time[i], 0);
ObjectSet("LINUS"+IntegerToString(i),OBJPROP_COLOR,clrPink);
ObjectSet("LINUS"+IntegerToString(i),OBJPROP_WIDTH,6);
ObjectSet("LINUS"+IntegerToString(i),OBJPROP_STYLE,STYLE_DOT);
ObjectSet("LINUS"+IntegerToString(i),OBJPROP_BACK,1);
if (((ExtATRBuffer2[i]<41 && ExtATRBuffer2[i+1]>41) ) && Close[i+2]>iBands(symbol,0,240,2,0,PRICE_MEDIAN,MODE_UPPER,i+2) && Close[i+1]<iBands(symbol,0,240,2,0,PRICE_MEDIAN,MODE_UPPER,i+1))
{ ObjectSet("LINUS"+IntegerToString(i),OBJPROP_COLOR,clrBlue);
ObjectCreate("LINUSZZS"+IntegerToString(i),OBJ_TEXT, 2, Time[i],55);
ObjectSetText("LINUSZZS"+IntegerToString(i),"64-76 Hrs Immunity", 16, "Impact", clrBlue);
ObjectCreate("LINUSZZSS"+IntegerToString(i),OBJ_TEXT, 2, Time[i],10);
ObjectSetText("LINUSZZSS"+IntegerToString(i),"8-12 pips set back", 16, "Impact", clrBlue);
}
else if (High[i]<iBands(symbol,0,240,2,0,PRICE_MEDIAN,MODE_UPPER,i)) {ObjectSet("LINUS"+IntegerToString(i),OBJPROP_COLOR,clrGray);
ObjectCreate("LINUSZZS"+IntegerToString(i),OBJ_TEXT, 2, Time[i],25);
ObjectSetText("LINUSZZS"+IntegerToString(i),"13-20 Pips Slip", 16, "Impact", clrCrimson);
}
else {
ObjectCreate("LINUSZZS"+IntegerToString(i),OBJ_TEXT, 2, Time[i],25);
ObjectSetText("LINUSZZS"+IntegerToString(i),"32/46 Hrs Immunity", 16, "Impact", clrCrimson);
}
ObjectCreate("LINUSZ"+IntegerToString(i),OBJ_TEXT, 1, Time[i],85);
ObjectSetText("LINUSZ"+IntegerToString(i),"Shape short!", 16, "Impact", clrRed);
ObjectCreate("LINUSZZ"+IntegerToString(i),OBJ_TEXT, 1, Time[i],35);
ObjectSetText("LINUSZZ"+IntegerToString(i),"53/63/80=Break", 16, "Impact", clrRed);
}
if (i>0 && dir[i]==0 && RSI2[i+1]>90 && RSI2[i+1]<95 && RSI2[i+2]<RSI2[i+1] && RSI2[i]<RSI2[i+1]){
ObjectCreate("Bacardo"+IntegerToString(i), OBJ_RECTANGLE, 1, Time[i+2], 95, Time[i], 90);
ObjectSetInteger(0,"Bacardo"+IntegerToString(i),OBJPROP_COLOR,clrOrange);
ObjectSet("Bacardo"+IntegerToString(i),OBJPROP_BACK,1);
ObjectSet("Bacardo"+IntegerToString(i),OBJPROP_WIDTH,3);
ObjectCreate("Bacardos"+IntegerToString(i),OBJ_TEXT, 0, Time[i+8],High[i]+90*Point);
ObjectSetText("Bacardos"+IntegerToString(i),"SELL "+DoubleToStr(NormalizeDouble(iHigh(symbol,0,iHighest(symbol,0,MODE_HIGH,6,i)),4),4)+"+", 16, "Impact", clrRed);
}
if (i>0 && dir[i]==0 && RSI2[i+1]<10 && RSI2[i+1]>5 && RSI2[i+2]>RSI2[i+1]+3 && RSI2[i]>RSI2[i+1]){
ObjectCreate("Bacardo"+IntegerToString(i), OBJ_RECTANGLE, 1, Time[i+2], 5, Time[i], 10);
ObjectSetInteger(0,"Bacardo"+IntegerToString(i),OBJPROP_COLOR,clrLimeGreen);
ObjectSet("Bacardo"+IntegerToString(i),OBJPROP_BACK,1);
ObjectSet("Bacardo"+IntegerToString(i),OBJPROP_WIDTH,3);
ObjectCreate("Bacardos"+IntegerToString(i),OBJ_TEXT, 0, Time[i+8],Low[i]-30*Point);
ObjectSetText("Bacardos"+IntegerToString(i),"BUY "+DoubleToStr(NormalizeDouble(iLow(symbol,0,iLowest(symbol,0,MODE_LOW,6,i)),4),4)+"-", 16, "Impact", clrGreen);
}
ObjectCreate("Singende"+DoubleToStr(i), OBJ_TEXT, 1, Time[i], 50);
if (dir[i]>0) ObjectSetText("Singende"+DoubleToStr(i), CharToStr(110), 8, "Wingdings", clrMediumSpringGreen);
if (dir[i]<0) ObjectSetText("Singende"+DoubleToStr(i), CharToStr(110), 8, "Wingdings", clrCrimson);
if (dir[i]==0) ObjectSetText("Singende"+DoubleToStr(i), CharToStr(110), 8, "Wingdings", clrBlue);
ObjectSetInteger(0,"Singende"+DoubleToStr(i),OBJPROP_BACK,1);
if (dir[i]==0 && Low[i]<iMA(symbol,0,240,0,MODE_SMA,PRICE_MEDIAN,i)-20*Point && Close[i]>iMA(symbol,0,240,0,MODE_SMA,PRICE_MEDIAN,i)-10*Point
&& (RSI2[i+2]>22 || ExtATRBuffer[i]>68) && High[i+2]<iBands(symbol,0,240,2,0,PRICE_MEDIAN,MODE_UPPER,i+2)
&& High[i]-Low[i]>120*Point
){
ObjectCreate("Frogger"+IntegerToString(i),OBJ_TEXT, 0, Time[i],Low[i]-40*Point);
ObjectSetText("Frogger"+IntegerToString(i),CharToStr(241), 36, "Wingdings", clrBlue);
}
if (dir[i]==0 && High[i]>iBands(symbol,0,240,2,0,PRICE_MEDIAN,MODE_UPPER,i)+20*Point && Close[i]<iBands(symbol,0,240,2,0,PRICE_MEDIAN,MODE_UPPER,i)-10*Point ){
ObjectCreate("Froggeri"+IntegerToString(i),OBJ_TEXT, 0, Time[i],High[i]+90*Point);
ObjectSetText("Froggeri"+IntegerToString(i),CharToStr(242), 36, "Wingdings", clrBlue);
}
if (dir[i]==0 && High[i]>iMA(symbol,0,240,0,MODE_SMA,PRICE_MEDIAN,i)+20*Point && Close[i]<iMA(symbol,0,240,0,MODE_SMA,PRICE_MEDIAN,i)+10*Point
&& RSI2[i+2]>22 && (RSI2[i+2]<78 || ExtATRBuffer2[i]>68) && Low[i+2]>iBands(symbol,0,240,2,0,PRICE_MEDIAN,MODE_LOWER,i+2)
){
ObjectCreate("Froggeri"+IntegerToString(i),OBJ_TEXT, 0, Time[i],High[i]+90*Point);
ObjectSetText("Froggeri"+IntegerToString(i),CharToStr(242), 36, "Wingdings", clrBlue);
}
if (dir[i]==-1 && RSI2[i+10]>92){
ObjectCreate("Froggeri"+IntegerToString(i),OBJ_TEXT, 0, Time[i],High[i]+170*Point);
ObjectSetText("Froggeri"+IntegerToString(i),CharToStr(242), 36, "Wingdings", clrRed);
}
}
}
return(0);
}
//+------------------------------------------------------------------+
void deletetxt1(string text){
for(int iObj=ObjectsTotal()-1; iObj >= 0; iObj--){
string on = ObjectName(iObj);
if(StringFind(on, text) == 0) ObjectDelete(on);
} }
double findAvg(int period, int shift) {
double sum=0;
for (int x=shift;x<(shift+period);x++) {
sum += High[x]-Low[x];
}
sum = sum/period;
return (sum);
}
double ChoppinessIndex(int period, int bar)
{
double Low0 = 0, High0 = 0, Close1 = 0;
double TrueRangeLow = 0, TrueRangeHigh = 0, TrueRangeSum = 0, Input = 0;
double PeriodTrueRangeLow = 999999999, PeriodTrueRangeHigh = 0, PeriodTrueRange = 0;
for(int k=bar; k<bar+period; k++)
{
Low0 = iLow(NULL,0,k);
High0 = iHigh(NULL,0,k);
Close1 = iClose(NULL,0,k+1);
if (Low0<Close1) TrueRangeLow = Low0; else TrueRangeLow = Close1;
if (High0>Close1) TrueRangeHigh = High0; else TrueRangeHigh = Close1;
if (TrueRangeLow <PeriodTrueRangeLow) PeriodTrueRangeLow = TrueRangeLow; // find true low of period
if (TrueRangeHigh>PeriodTrueRangeHigh) PeriodTrueRangeHigh = TrueRangeHigh; // find true high of period
TrueRangeSum += TrueRangeHigh;
TrueRangeSum -= TrueRangeLow;
}
PeriodTrueRange = PeriodTrueRangeHigh - PeriodTrueRangeLow;
if (PeriodTrueRange==0) PeriodTrueRange = MathPow(10, -12); // avoid possibility of division by zero
Input = TrueRangeSum / PeriodTrueRange;
return ((logN(Input, 10, MathPow(10, -12)) / logN(period, 10, MathPow(10, -12))) * 100);
}
double logN(double x, double base, double epsilon)
{
double integer = 0.0;
if ((x < 1) || (base < 1)) return(0);
while (x < 1)
{
integer -= 1;
x *= base;
}
while (x >= base)
{
integer += 1;
x /= base;
}
double partial = 0.5;
x *= x;
double decimal = 0.0;
while (partial > epsilon)
{
if (x >= base)
{
decimal += partial;
x = x / base;
}
partial *= 0.5;
x *= x;
}
return (integer + decimal);
}
double StdDev(int shift, int samples)
{
double x0=0, x1=0, x2=0;
for (int m=0; m<samples; m++)
{
x0 = ExtMapBuffer[m+shift];
x1 += x0;
x2 += MathPow(x0,2);
}
return(MathSqrt((x2-(x1*x1/samples))/(samples-1))); // minimum samples is 2, enforced in the init section
}