An investigation into what makes or breaks a turn that just left a powder box.
An istant rejection would result in a channeling move initially.
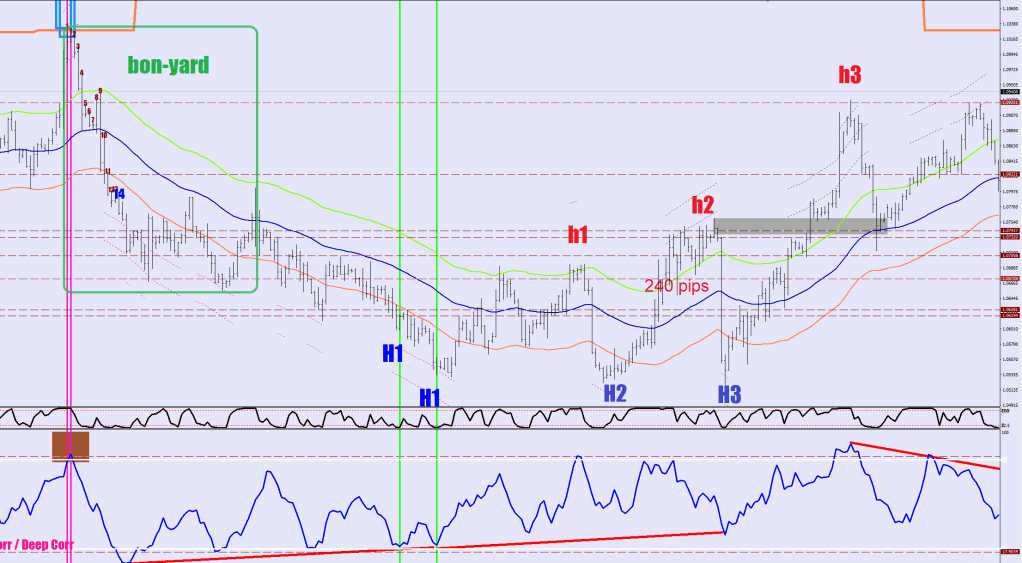
The goodies are burriend in the bon-yard.
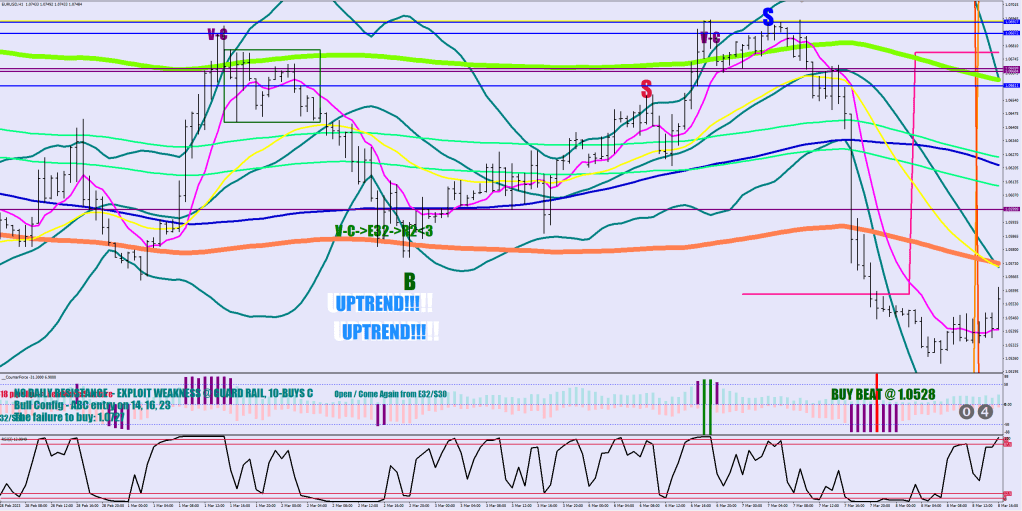
This however is not the very thing I’m after today. It is the H2-h2 swing with that gray box at the end. If the market was to continue chasing a new box, the h2 end would remain untouched.
The next image will make the point for me.
The H2-h2 span may actually be the shortest, hence the Wave 3 numbering would mess things up badly.
The reason this ended up not being a reversal is that the h3 swing low was made higher than where the h2 was at. Confirmation? How about price hooking back up to the upper guard rail (new box)?
Also there is that piece of information, the 460 pips. You are not likely to retrace all of that. The weekly S3 / R3 displacements are at 415 pips.
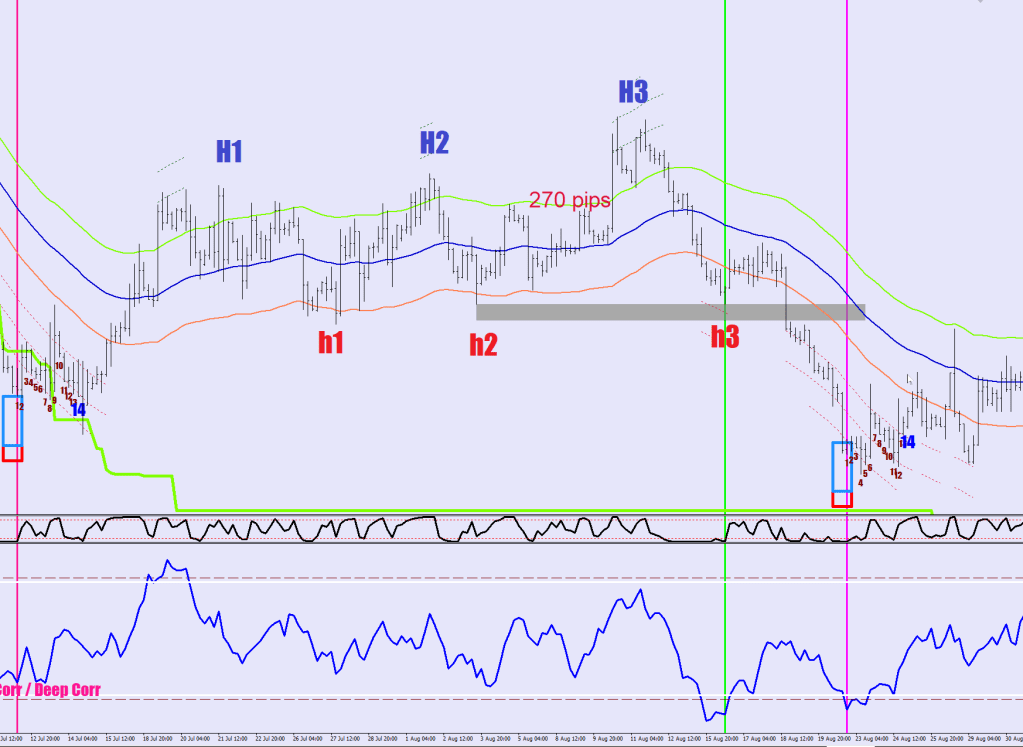
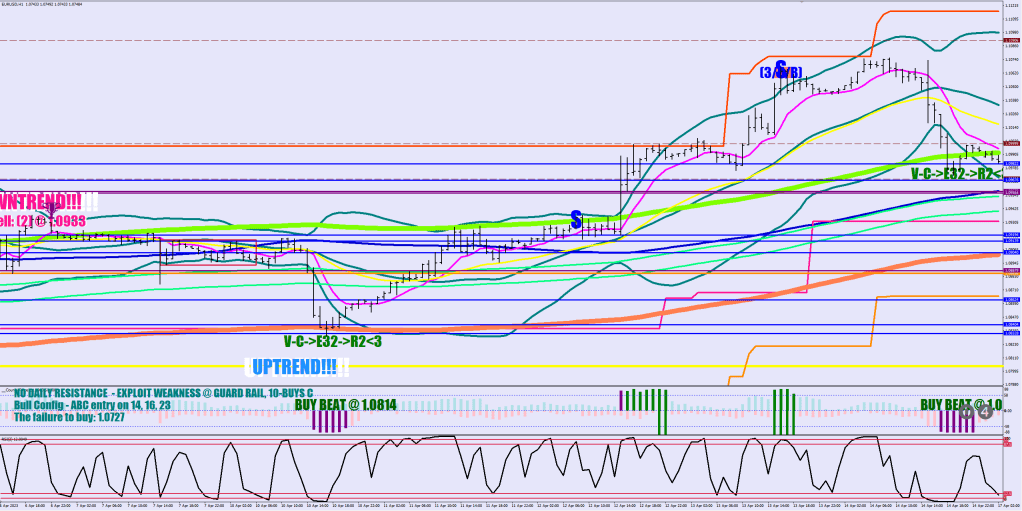
3 more images, the first one had a reaction off the h2, but then made the break.
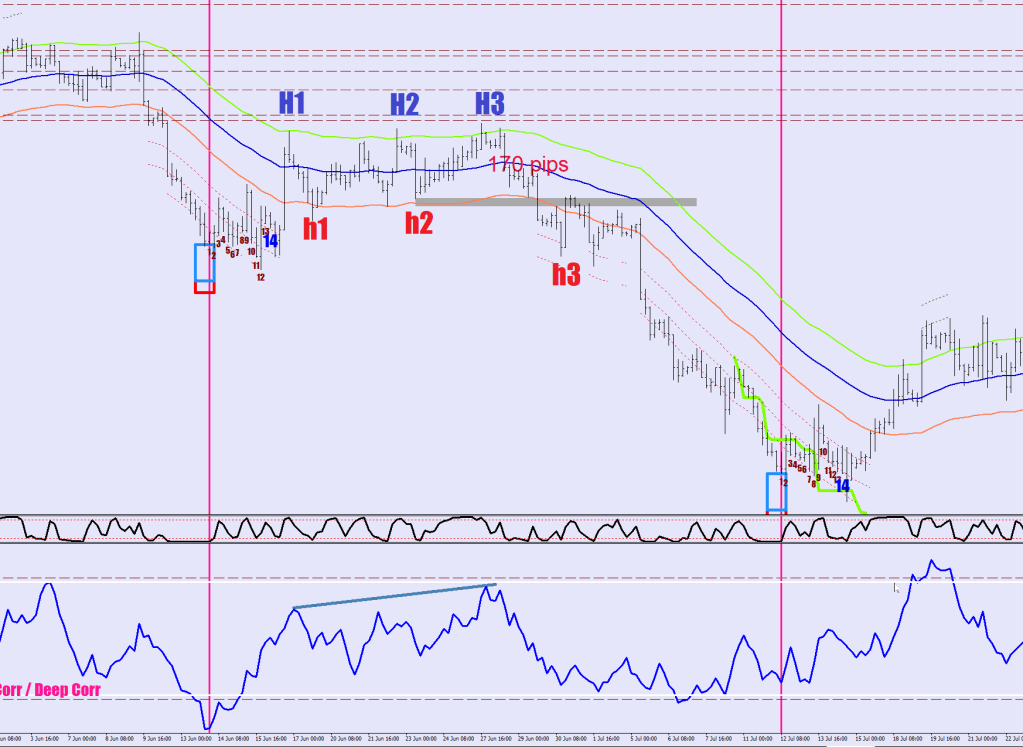
The next one did a back test soon after the break.
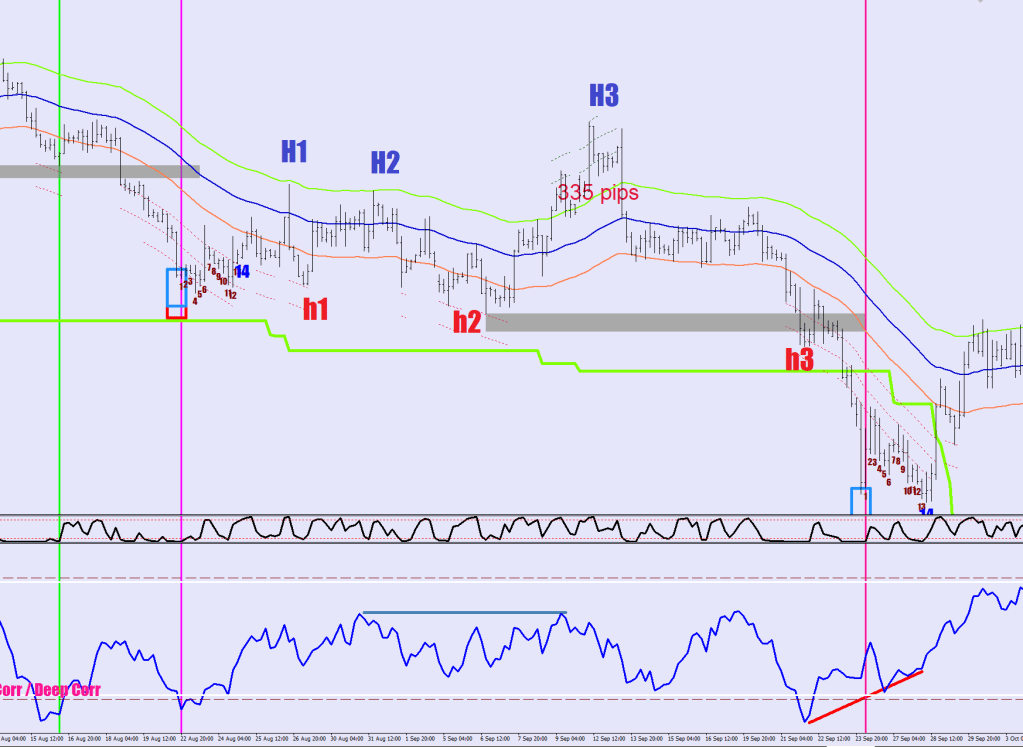
The last one is the closest to what is happening right now.
335 pips VS 300. There was a back and forth around the h2.
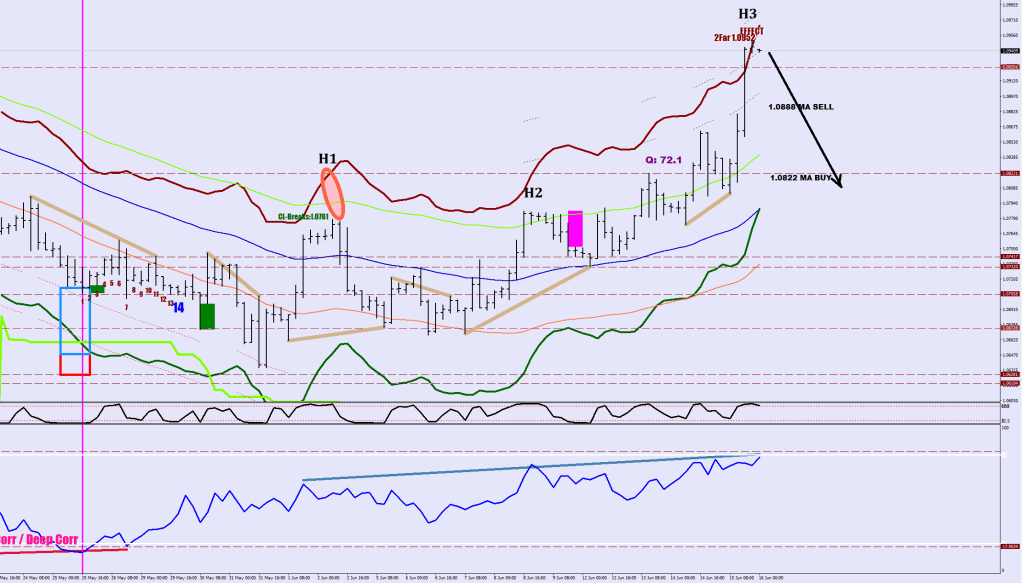
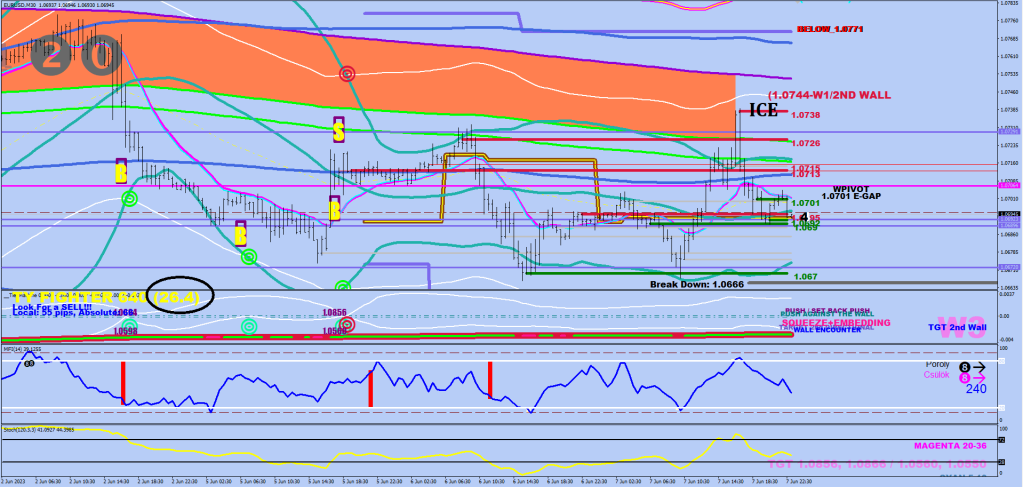
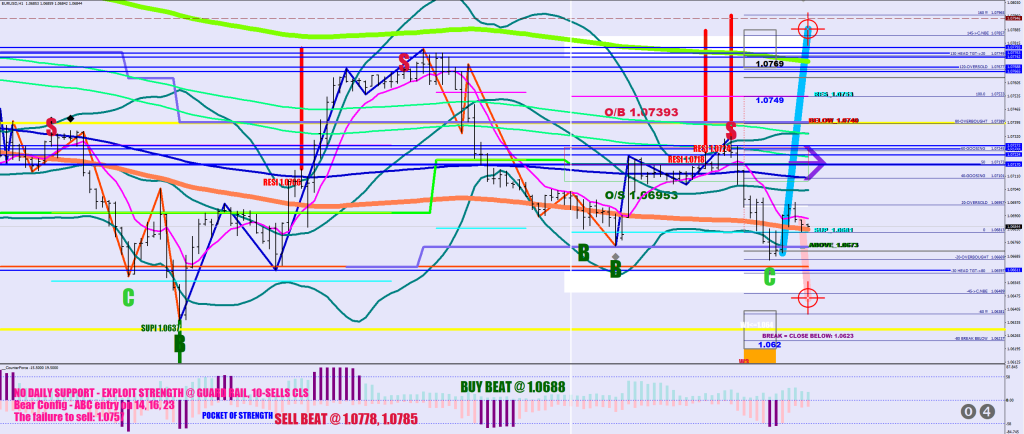
You already recognize the gray box. I drew in a red one as well, since the h2 would need to receive some pressure before the decision would be made. If price bottoms in the 1.0770-1.0740 zone and then tags the Upper Guard rail, that would be a confirmed reversal.
If it pushes through the 1.0732 h2 low convincingly (25+ pips), the market would have started a new quest for finding a holy powder box.
I needed a breath of fresh air in the clean water.
There was a guy calling his taxi service to the Bay Area Rapid Transfer Humphrey Go Bart.
Emeryville’s Emery-Go-Round was just a weak rip off.
So, Humvee three then. Dago-bart. Fine tuning.
We have found going into the stats, that the counter directional H3 is expected to reach 100+ pips stretch from the Guard Rail.
Powder box counter moves

H1 - GR / L1 / GR scare
H2 - GR / GR +
H3 - GR (only if H1&H2 were GR) / L2 / L3
Don’t be skewed by the blocks that I got. How exactly to time a perfect entry / exit?
I would propose looking at a 7-sample hourly MFI. Once a fractal prints under a deeply ovebought / oversold condition, I would rotate out / reverse position on a beat in excess of 10 pips. And add some more at 16.
If you needed a confluence of resistance, weekly R2 and the brown trendline was it.
The R2 has been at that level for the last 3 weeks. I’m not plotting it over the current bar for better visuals.
Having the right market model makes you for instance stop looking for more upside once the H3 has printed.
Please keep your personal longing
I was looking for a picture of me riding on the sail boat that used to belong to Errol Flynn, but could not find one. Anyways, speaking of New Zealand, there are a lot of silly extreme sports over there. Feel free to look up boom-netting. Wasn’t much fun.
The devil’s in the retail.
Want more geographical stuff? Bank of America sent my credit card to Gabon, cause whoever heard of Great Britain as a country?!
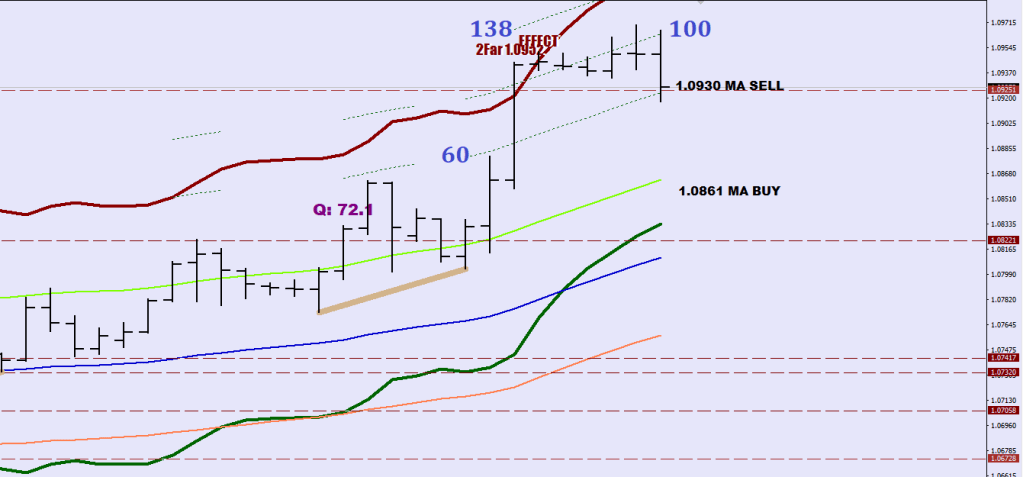
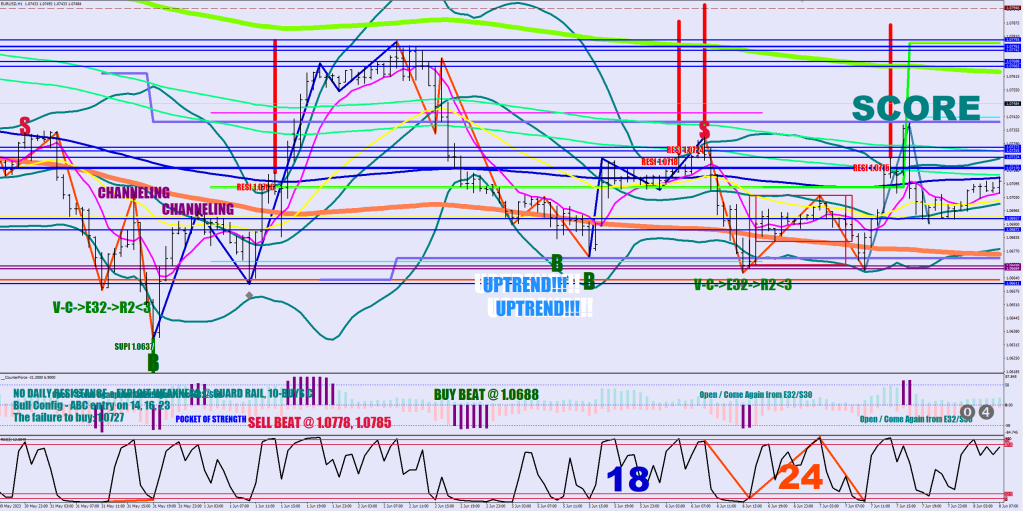
Channeling is keeping the price on one side of the 9-DAY EMA, a correction is slipping to the Guard Rail on the other side, a deep correction is going a further 60 pips. Extra deep would be 100 – that’s the second interruptd line out.
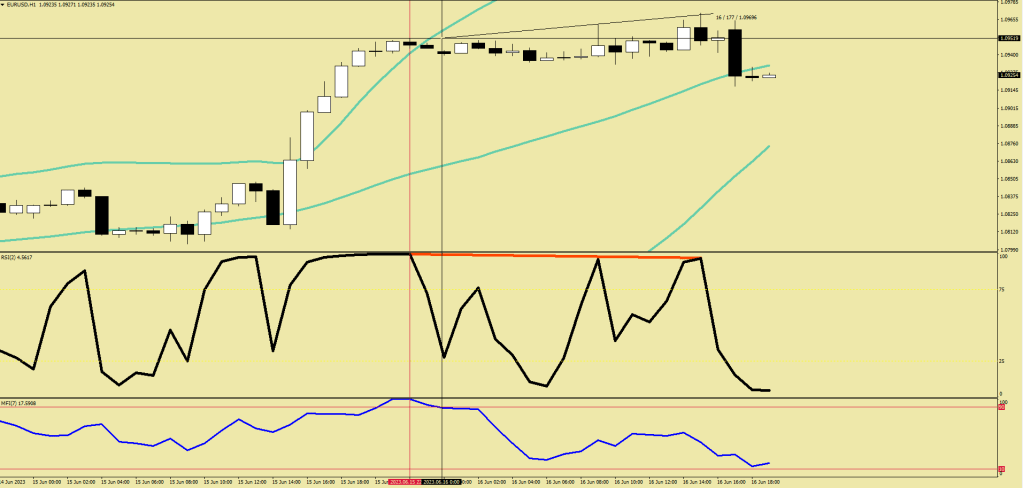
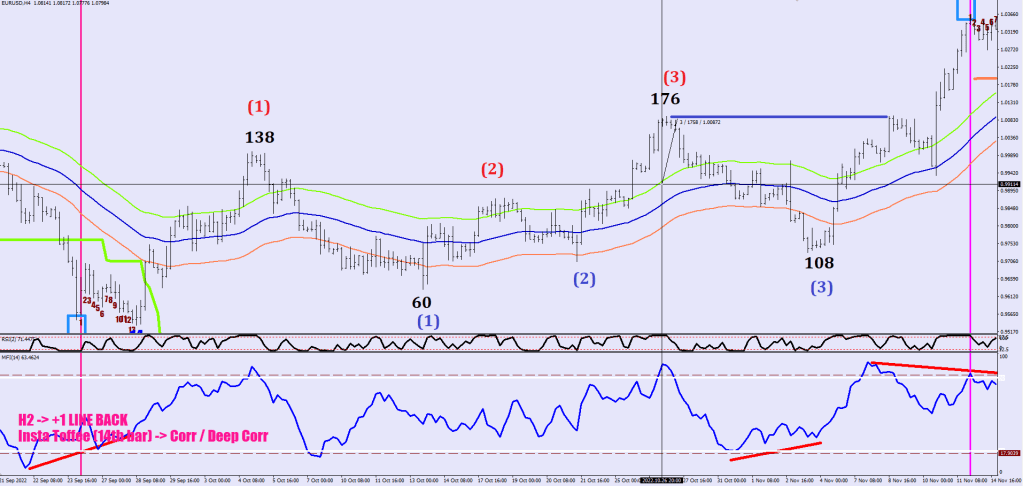
Now, let’s talk 4H money flow.
Notice the continuation divergence. The money flow is increasing from Hump 1 to Hump 3. It also never reaches ovebought.
Now, let’s see the next one. This one has a reversal divergence, & Hump 3 hits the Extra Deep Correction level. As soon as this happens, price resumes with the original trend.
After this there was a continuation divergence again, and no oversold.
Reaching the 3rd line is still in the Extra Deep Correction field, but yet another reference line 100 pips out.
This tide-in, tide out (continuation divergence followed by reversal divergence) is basically the same mechanism that I referred to as “loneliness and disregard” which have to do with expanding / contracting volatility.
Now, the present.
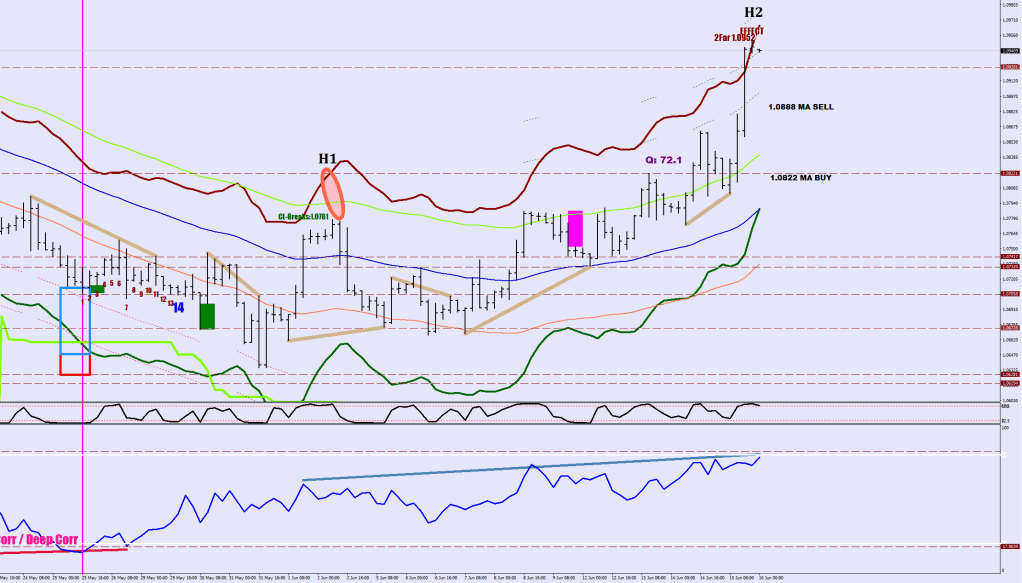
Looks like a cup in need of a handle.
Continuation divergence. Today the Hump 2 reached into Extra Deep Correction depth. H3 should start from the Orange line, which is the opposite guard rail… That is of course if the tag of the E-9 was not the separator moved out one line to fit the shape. Then that section right before the Magenta square was an H2 (with the Khaki RSI2 continuation divergence auto plot). That would mean no more humps needed on the upsdie.
I would suggest that the down move would have to fake out the last continuation divergence up. Ultimately we could have a move below the Lower Guard Rail by 0-60 pips and that could represent the higher low for reinstating the uptrend. The move from there would be matching this current swing high.
The reason that I was one step ahead to finding the sollution was my intuition of wanting to find a working market model.
Image shows how a turn occurs after the 3rd Counter-hump, the black numbers represent pips. The 3rd directional move would fail to top the stretch made by H3 during the shake. Otherwise it’s just wall to wall Anderson.
It’s no secret that our world is in darkness tonight.
It is hard to find something that you cannot phrase a question for. I.e.: how many ears do we need?
Now that I found you,, things will never be the same again.
We’ve got tonight, who needs tomorrow, we’ve got tonight, why don”t you swallow?
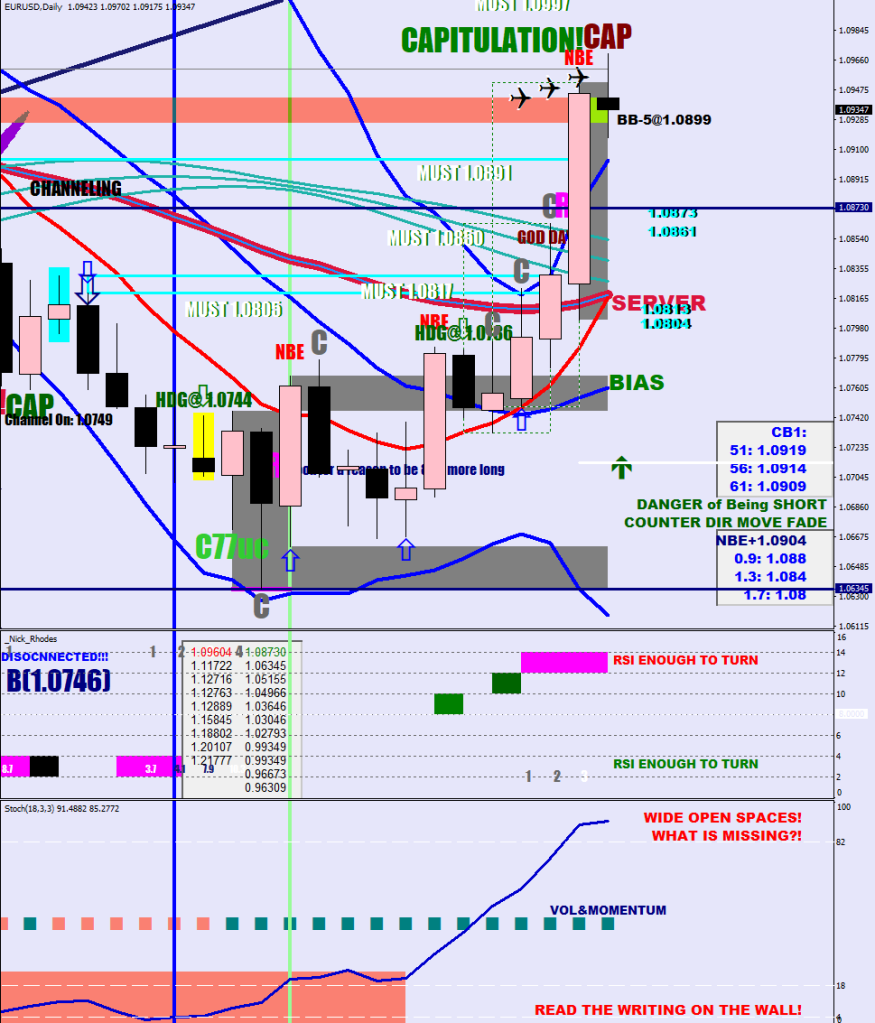
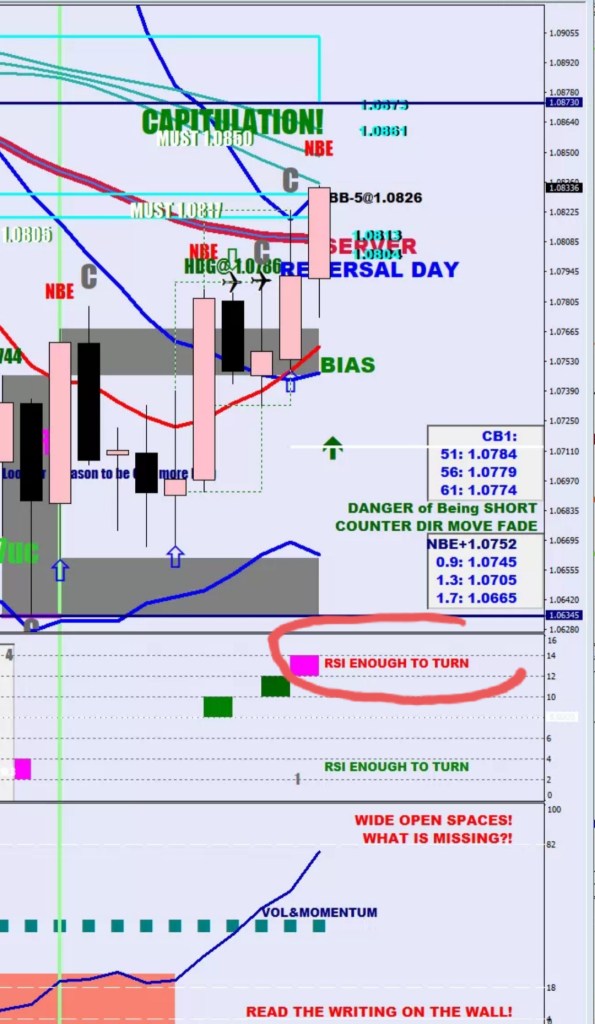
I did mention that after a black bart on Nick Rhodes means that the upper Bollinger (19) is going to be hit within 11-19 days before the lower one. It was 16 days. I mentioned that there would be a reaction of the upper wick of the pro volume candle (further diminished by the following day’s destruction of some of the orders).
After the H2 is over (likely is soon), price would come back to the lower guard rail.
I’m trying to grasp the concept of an official starting point of a trend utilizing the halo of the Green River (E-9 Daily).
If it isn’t obvious by now, I just won’t take textbook definitions and explanations made by others. I have to figure out for myself. For real.
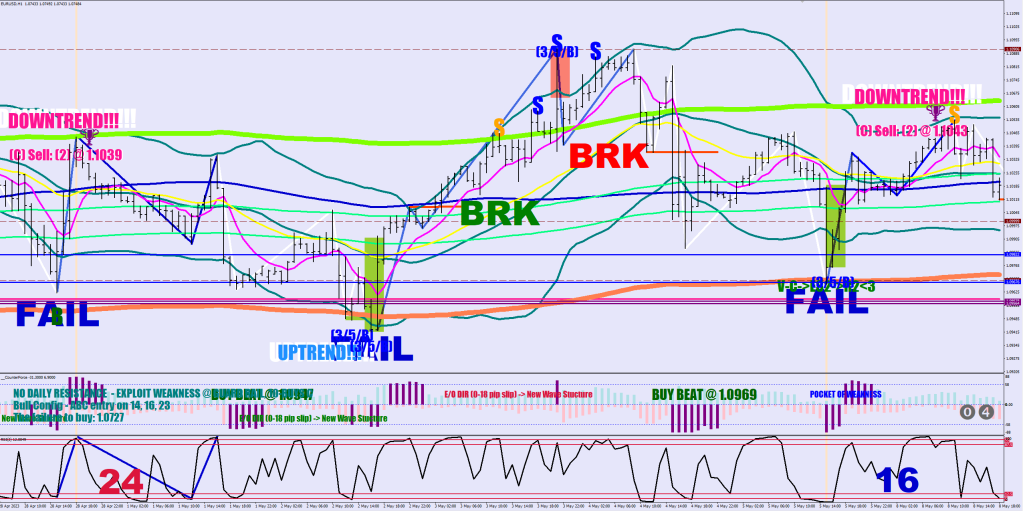
I want you to concentrate now on the UPTREND prints. They are not the mirrored condition of the DOWNTREND prints, which I had made earlier. The latter had filters in the shape of Bollinger Band (30 sample) and a swing high.
The UPTREND is looking for an RSI2 within the red band, a close within plus minus 10 pips of the lower guard rail and 800+ points volatility within the last 24 hours relative to the candle’s low & the results are interesting to say the least.
Yes, the whole wind is coming from the idea that Channeling is keeping out, so the keeping in may be a function of nearly the same location.
Give me a valid reason why the blue oval is not the mirror fake out of the other oval.
Give a reason why the price would not be able to get away from the MA band by 725 pips at least like it did on the last two occassions beyond the 59 EMA.
What is the reason for me still working at this seemingly chaotic Volume & Momentum daily combo. I think the 8-days of green sequence downflip can be commented out now.
It is interesting to see that those single green squares (lifts) got aggressively killed by Pro Volume (cyan shading) coming in on the next day. Upper 19-sample Bollinger tag may be as little as a day to two days out. Perhaps a reaction from the first pro candle's upper wick, but the second wick is definitely in the cards as well.
Give a reason why the second daily close above the E-9 (Red) has any bearish implications.
Insert some silly stuff here, like “I wanna fart like an eagle, to the sea…”
To appreciate the difficulties of coming up with a direction-logic with a multitude of signals, inluding volume, candle sequences, MA and oscillator filters, take a look:
I have had a few different names for the Two Sticks. Stretch / Fail. Open / Overheat, 109 ERROR (the purple 109.5 displacements seem to have to be always in the way of this one), but I definately wanted to include in the name the fact that a new-charge is going to come from the Simple 30 / Exponential 32 combo. This is looking like a Wave 2 down after a Wave 1 up, very much so.
2. Hell Froze Over
The buffer beyond the E-9 band is the moat. The area is between the 30-minute 712 Median and the 414 High / Low depending on direction holds cold water. It freezes over if the width of it drops below 27 pips. This has just happened. A moat can be crossed without sinking below if it is frozen.
3. Black Bart Numeristics
I have pointed out the stats of the “Black in Magenta” prints: after a black print, the 19-sample daily Bollinger Band would be tagged on the upside before on the downside, and would be done so within 12-19 days.
The Upper Bollinger is just coasting into the resistance wick of the first daily pro-volume holding candle. This may not be a coincidence.
4. Ticking
The last piece of evidence is the max pain that has not been budging a bit. With 7 trading days remaining, we are still 300+ pips shy from this number. There is tremendous distance potential and very limited time before slipping into the future.
Tag um Tag, Jahr um Jahr, wenn ich durch diese Straßen geh Sehe ich wie die Ruinen dieser Stadt wieder zu Häusern auferstehen Doch bleiben viele Fenster leer, für viele gab es keine Wiederkehr Und über das was grad noch war spricht man heute lieber gar nicht mehr Doch ich frag ich frag mich wer wir sind Wir sind wir Wir stehen hier
How does Crypt face trade on Tether basis when most exchanges de-listed all USDT pairs?
(Not that I ever cared to trade crypto.)
– How does one not get a margin call at a draw down of 60 million? Where did the initial capital come from that had to be 85 million plus?
– Why have I never met someone in commodoties trading to fill me in on dynamics such as “when the price of oil is high, they can just give away the natural gas?”
– Which broker can afford to dish out 180 million without going bankrupt?
– Why is he distinguishing between futures and forwards?
What if KLF did not stop making music?
What if Terence Trent D’Arby did end up becoming more famous than Michael Jackson, like he said he would?
What if there was a sequel made for Kefren’s Desert Dream for real?
I suspect I ended up in an alternate universe.
This is a journey, what’s going on?
Anyways, the lesson today is about persistence. Persistent weakness / stength has to be compensated for by a reversal divergence.
Persistance has a correlation with staying outside (expanding on) the current volatility curve. 3 hours or more is where persistance may become relevant.