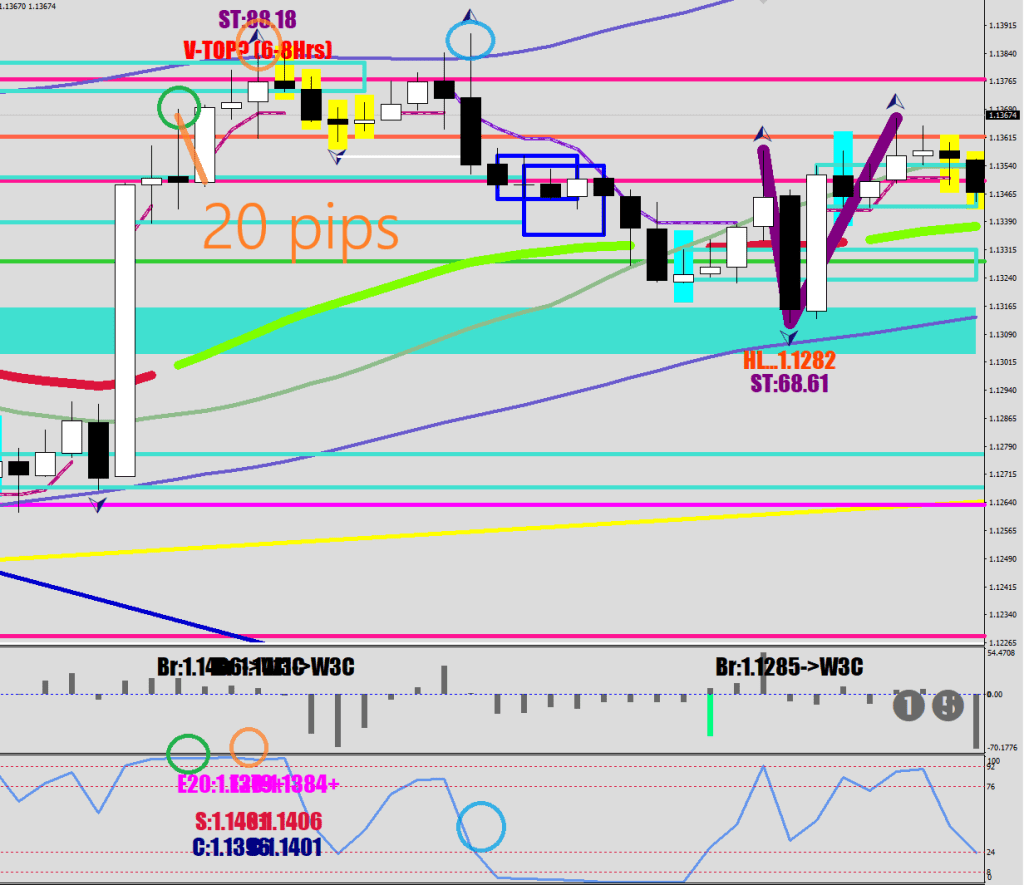
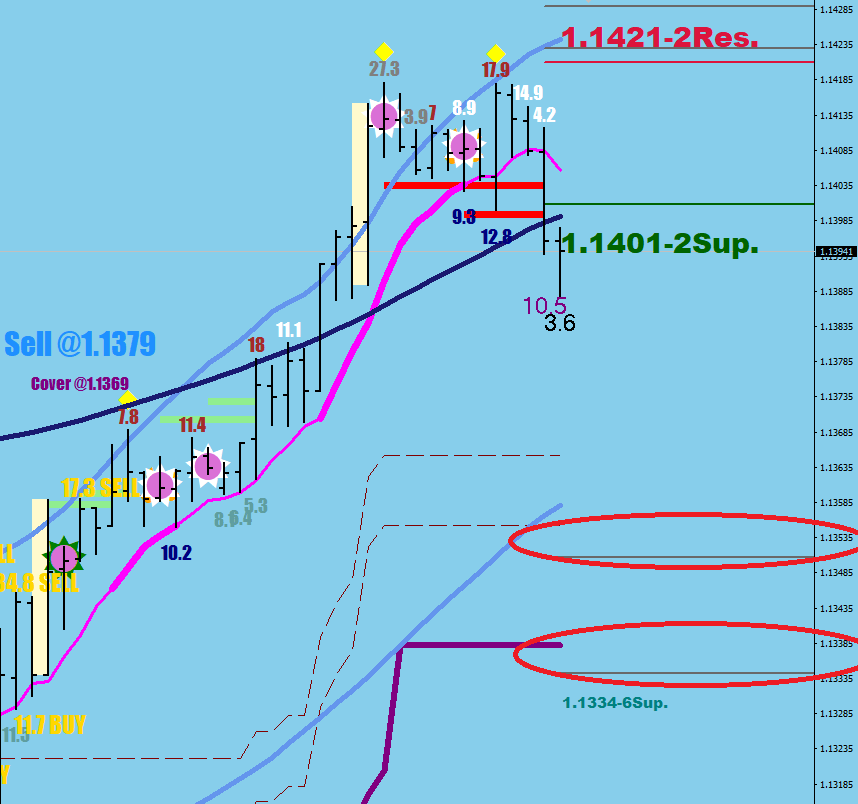
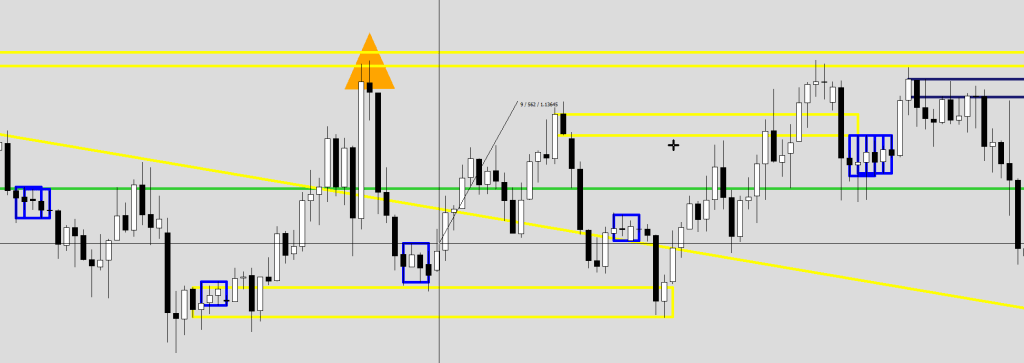
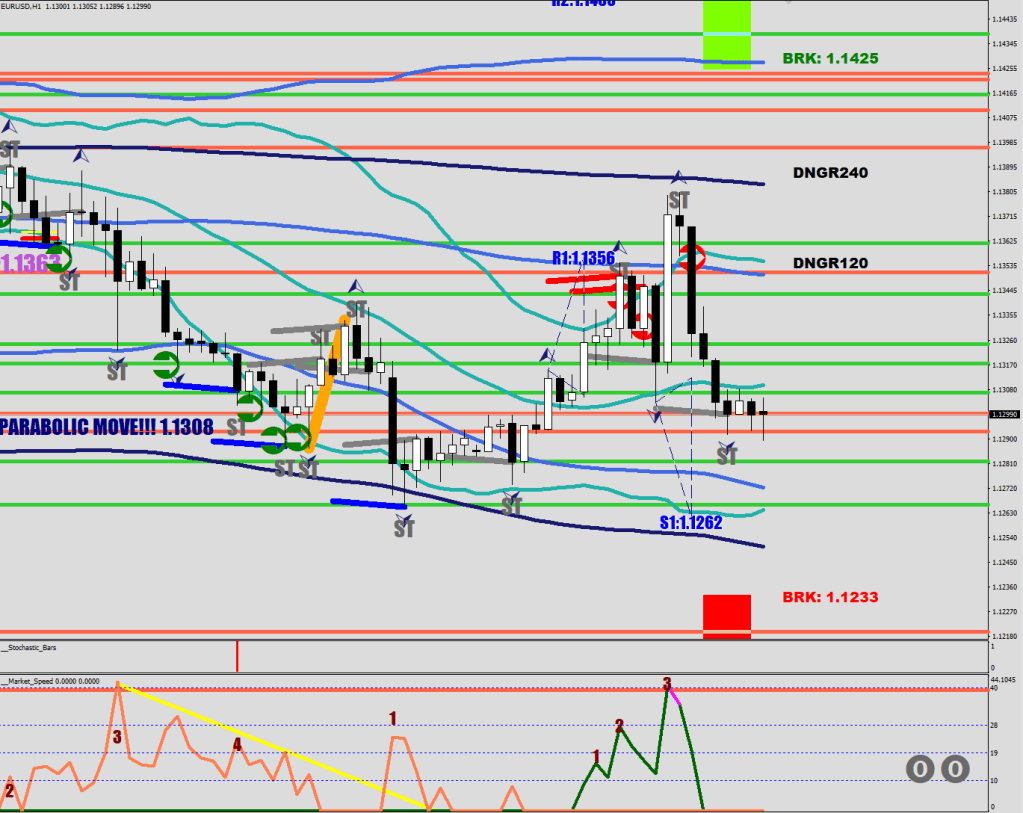
A terminal sequence can look like the picture above.
The green circle is the Escrow high, with the RSI2 printing in the last 3%.
The following, Adjustment high (orange) is expected to stay within 20 pips, and would see a pullback prior at a minimum 17 pips, but often 37, and can be as much as seventy-something.
The coda to the sequence is the Thrust. In the picture above, the move did not qualify to be called a Thrust based on my filters (46 pips within 4 hours), but it was an echo move nonetheless.
///Thrust up
High[i]-Low[i+1]>460*Point || High[i]-Low[i+2]>460*Point || High[i]-Low[i+3]>460*Point || High[i]-Low[i+4]>460*Point
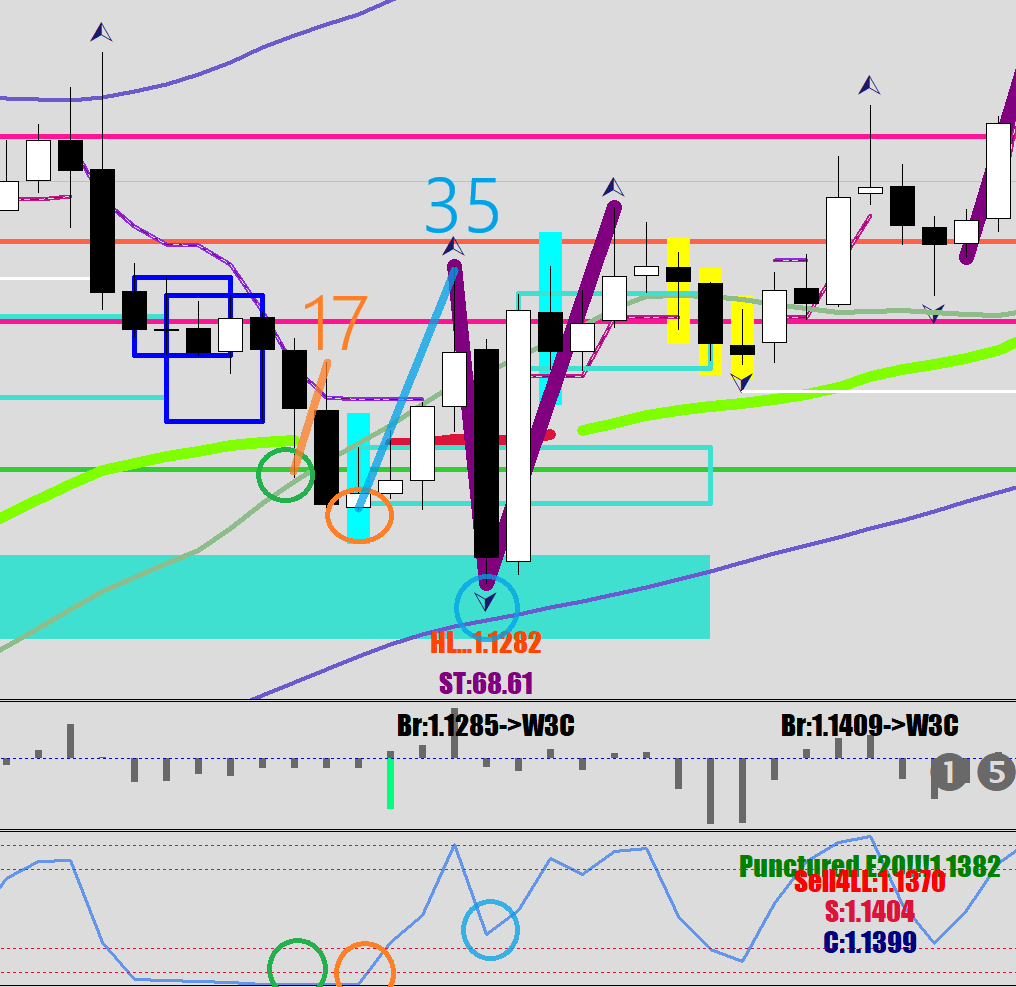
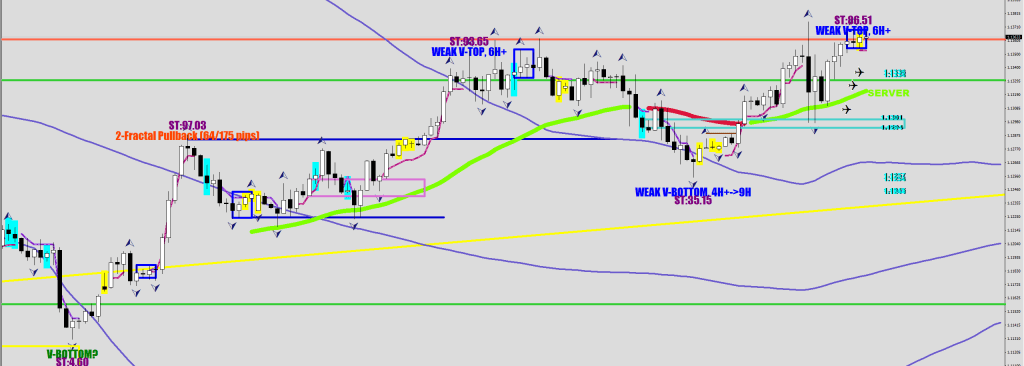
2 more examples to start to get the hang of it
Escrow, adjustment, echo
That black doji I sometimes refer to as clutch, particularly if it is preceded by 3 candles of the opposite color.
The following sequence did come with a Thrust, and after the adjustment low the pullback was 35 pips.
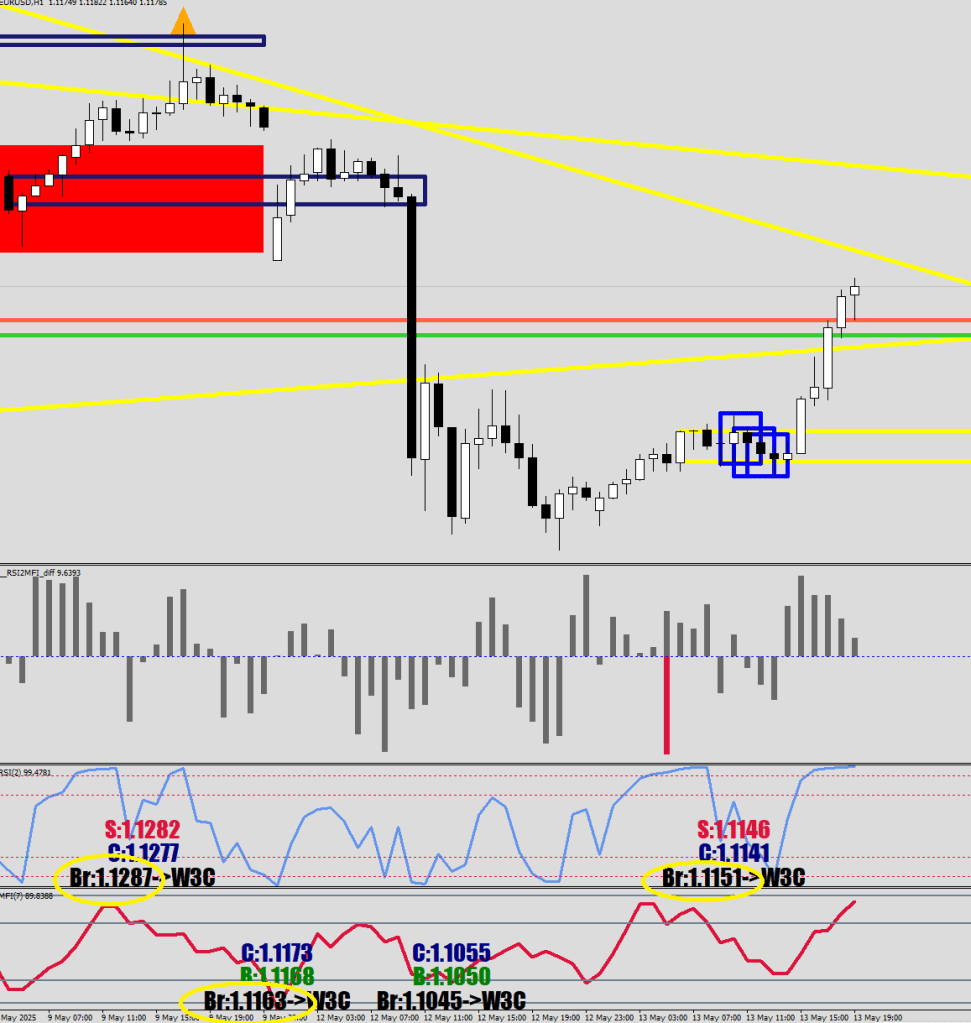
This brings us up to real time. We have seen the Escrow, the Adjustment, and now the 3rd fractal is printing.
Album #71. Hitting 1100 songs soon on the Topic alone.
///V-top
 if (iFractals(symbol,0,MODE_UPPER,i) && High[i]>iBands(symbol,0,30,2,0,PRICE_MEDIAN,MODE_UPPER,i)-100*Point && High[i]>iLow(symbol,0,iLowest(symbol,0,MODE_LOW,11,i))+720*Point && RSI2[i]>96)

in English, the high would have to be at most 10 pips below the upper 30 sample BB, the high would have to be 72 pips higher than the 11-sample low, and the RSI2 reading was already discussed
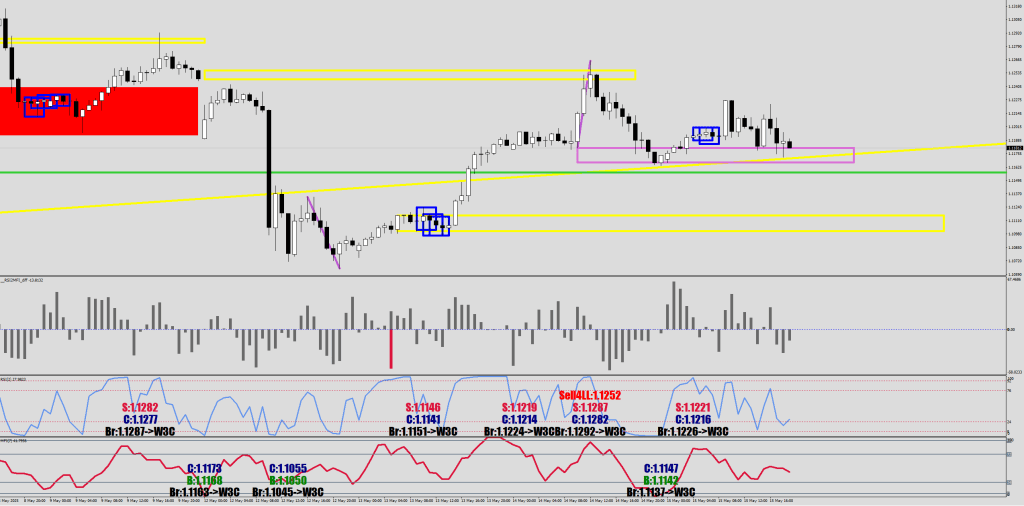
I did not include the RSI2, but the candle before the one doing the back test of the cyan candle’s body was below 3 print.
The second example is a flip over. Note that the 100-delay 120 BB was where the price launched from, and after an RSI2 embedding, the last candle before the backtest (I’m talking the big black from the opposite direction) had an RSI2 above 97. A further lesson would be that an instant adjustment high was made, which is virtually a commitment for a breakout.
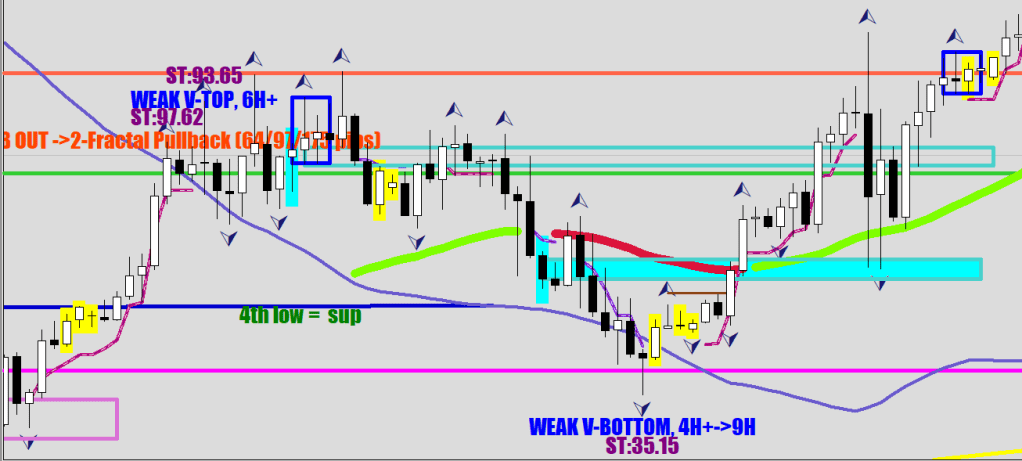
Two more backtests on the 3rd image. Note that the rectangle is a bit wider than the 1H candle’s body for a hit to be called.
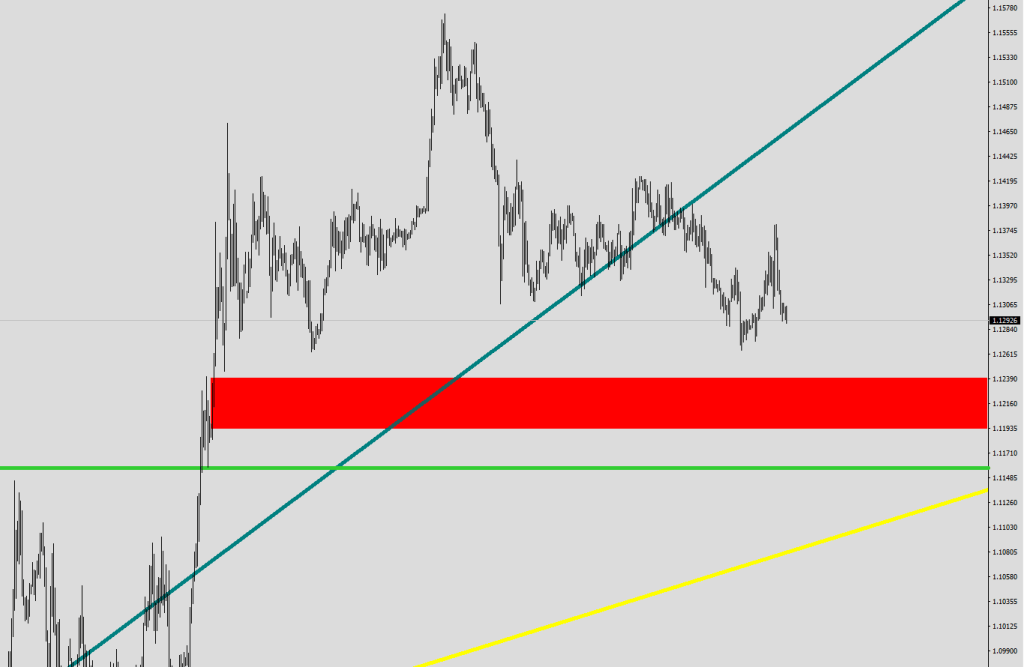
Is this gonna flip? I think not. The BB displacement has been missed.
There was a drive to the downside. A Money flow acceleration (Orange Diagonal) and an LL print.
There can only be one of two things next. A Thrust that can get as long as 164 pips or another LL failure.
I made these 17 tracks yesterday. Most proud of the LL Cool J one, “I Flow Around”, Track 3.
another one says Dollar new lows (300 pips up per Euro)
Which is it then?
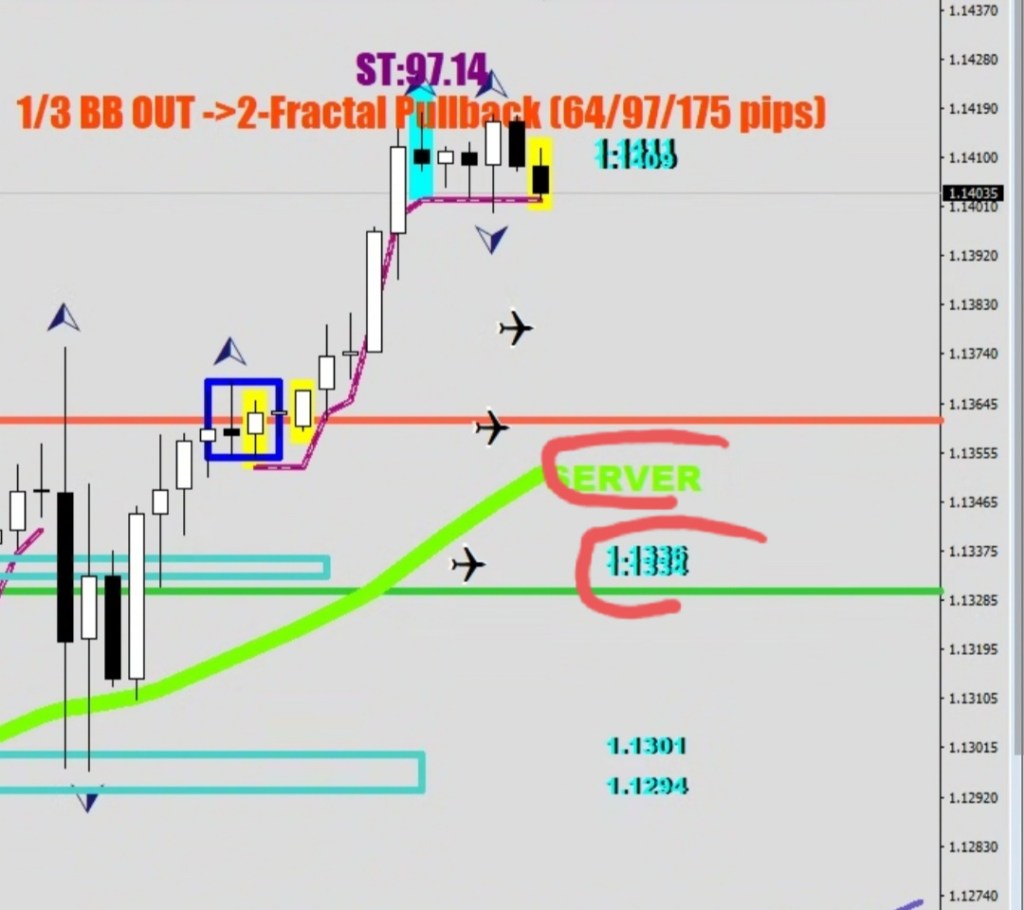
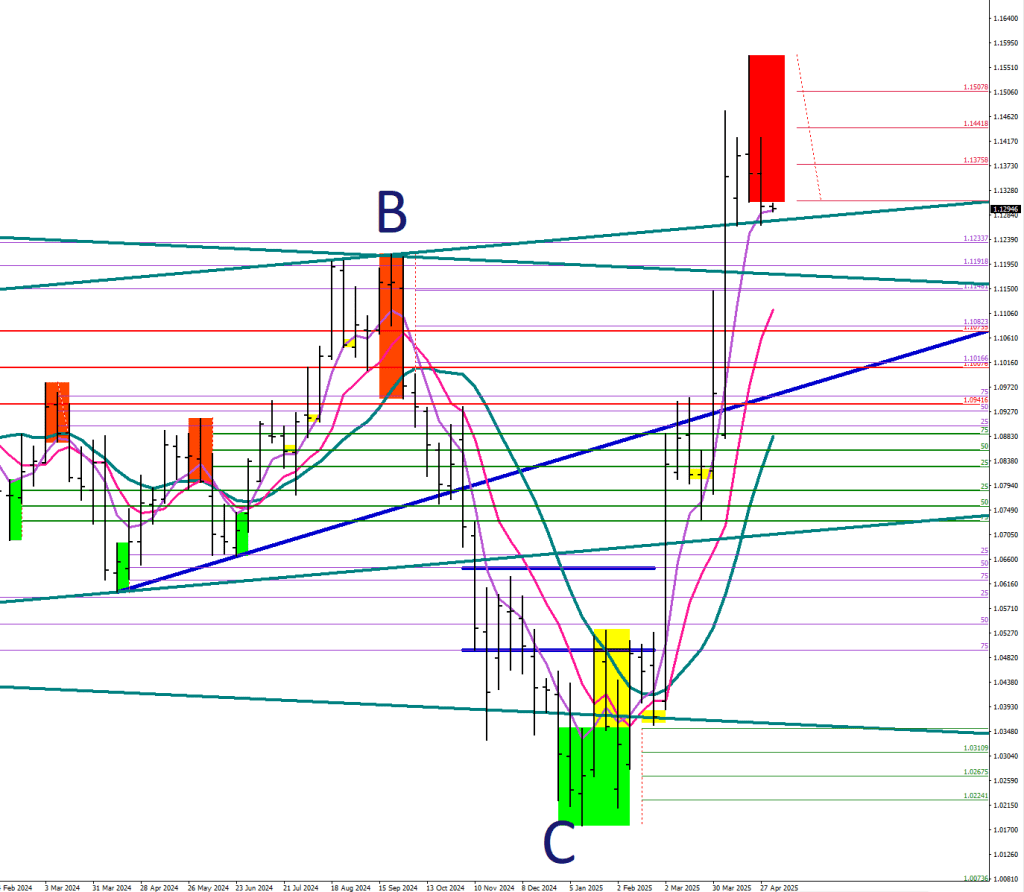
Do you see that cyan highlighted pro volume candle?
Carried out to the right are 2 numbers, the open and the close of that day.
1.1363 was tested in the last 3 days 5 times. The close on Friday was 1.13633, but the volume fell off a cliff and the inventory was 100% long at the end – I think they would regret it.
Either way, play it like this: watch the first 4 hours. If you get closes above 1.1363, go long. If not, start shorting on the close of the 4th hour, 2 AM GMT.
1: The trendline. 2: The Server (E-44) 3: The stronghold of the professional shorts. X: All of the above
How do you think the professionals (cyan highlights) would react?
1: Say thank you, I can put on a larger size at a discount. 2: Call Mommy, fold and run for the hills.
Something has changed; the downside would be cut short, but not here.
It is not the first time I had this idea about keeping in/out. The BB in the image is a 120-sample HL2 with a 100-hour delay. I think, this news flipped the game from keeping out to keeping in. 1.1050 I believe is the next point of call still.
Managed to collect enough images for album #66. #68 already has 40 minutes of new material.
I’m not sure what you are going to be doing with all of this, but I decided to share; this is what I am currently preoccupied with.
Those orange triangles mark up stair-stepping breakout failures.
If I were screening for an apprentice, I would ask, What is 17 pips for the Euro?
The answer, of course, is that it is the size of one step. If someone said it meant about one-half of the Euro’s fluctuation size, I would probably pass them still.
When the RSI2 hits in the last 2%, you get the following values: 17 pips out is the next step. 22 pips out, strong fade, 27 pips out, a stair-step breakout is occurring. In the next 4 hours an adjustment can be made to the calculation’s base value, and there are MFI(7) filters applied.
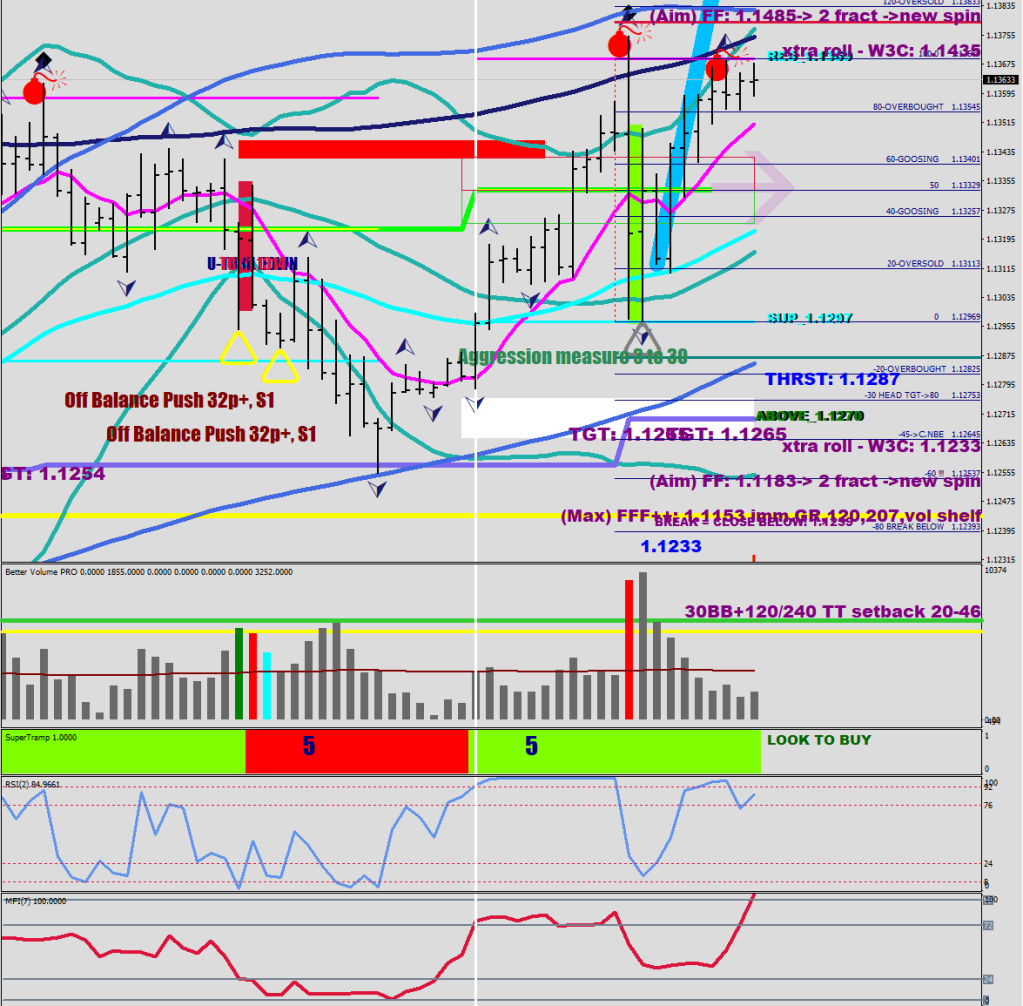
The professional volume prints (cyan) are all on the upside.
The upper trendline is about to be cracked. The next two weekly levels are 1.1234 and 1.1192.
Hmm… 1.1233 again – as for a volatility breakout potential. Of course, the market cannot consolidate if they want to keep that in place. W3M is at 1.1211 – a testament to the 3-day volatility collapse.
It is a wave 5 down in my opinion. The how low starts below 1.1262. The strong move down is looking like a money flow acceleration, meaning that you should see a lower low first (13 pips on average) followed by a thrust to the downside.