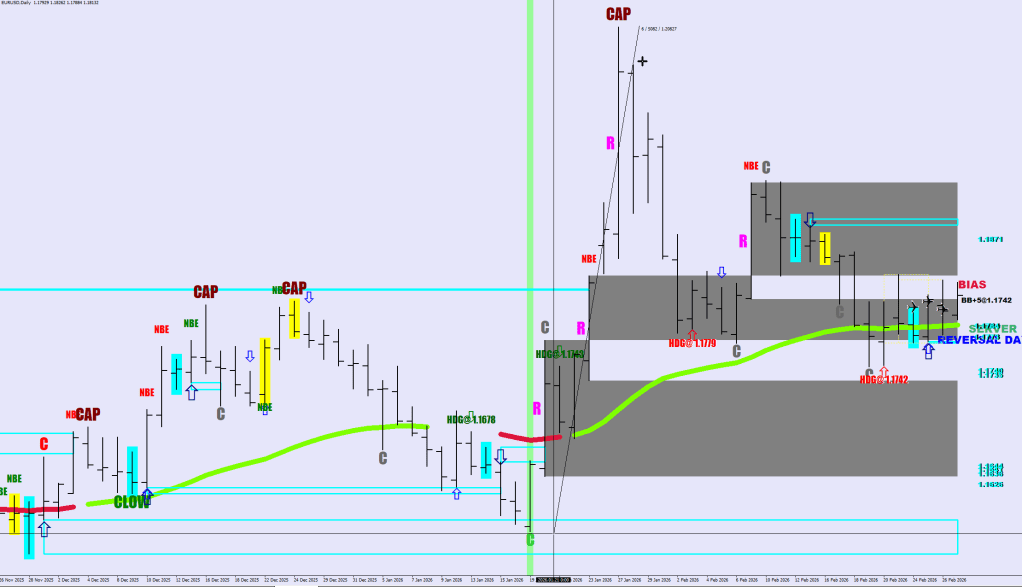
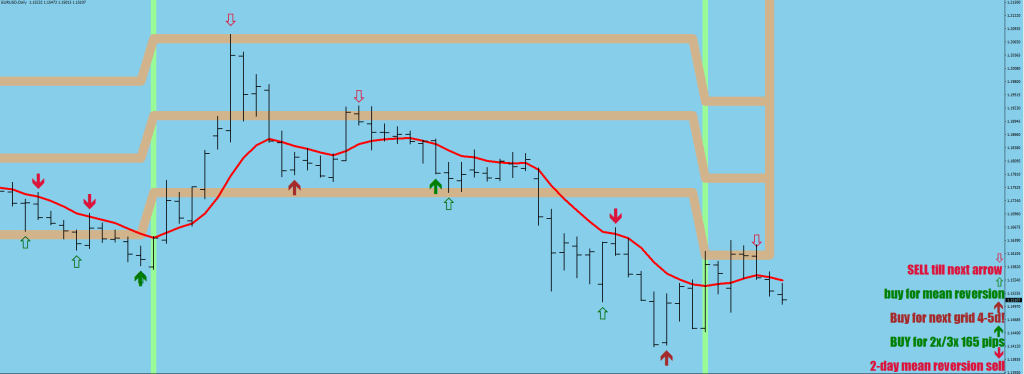
For me, things start with market models.
I have given you one in the last post.
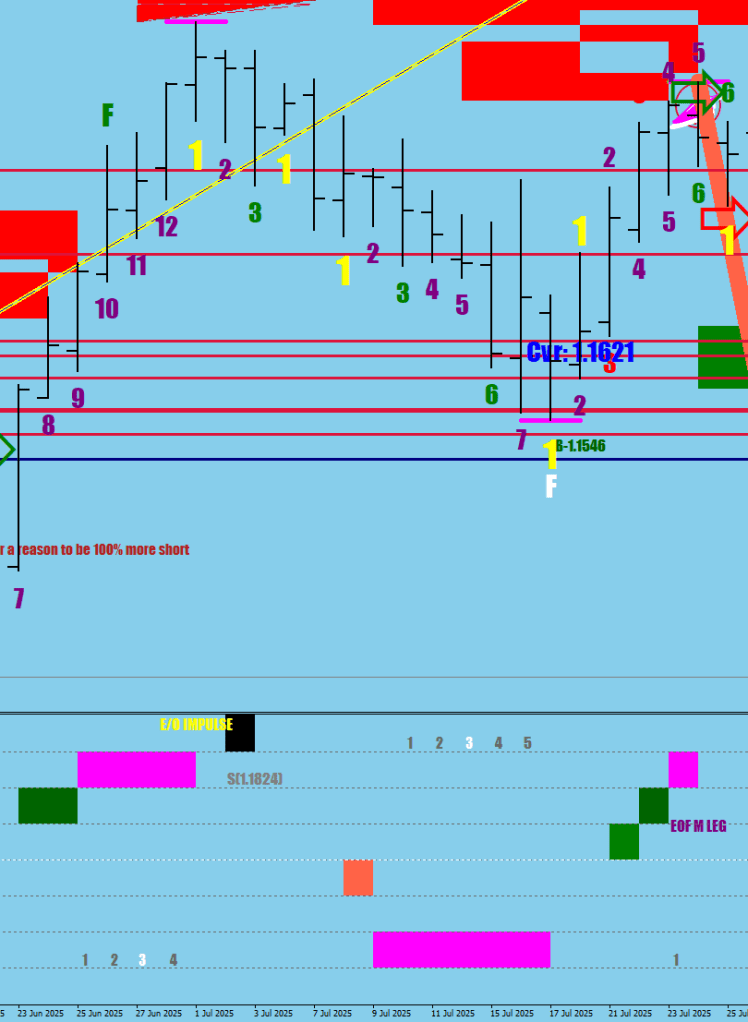
No, there is no low made yet.
To me, there is nothing technical about drawing lines. Technical starts with deriving values (quantities) and starting to associate meanings to different values. These values would be time frame and instrument dependent.
Gonna go with large steps from here.
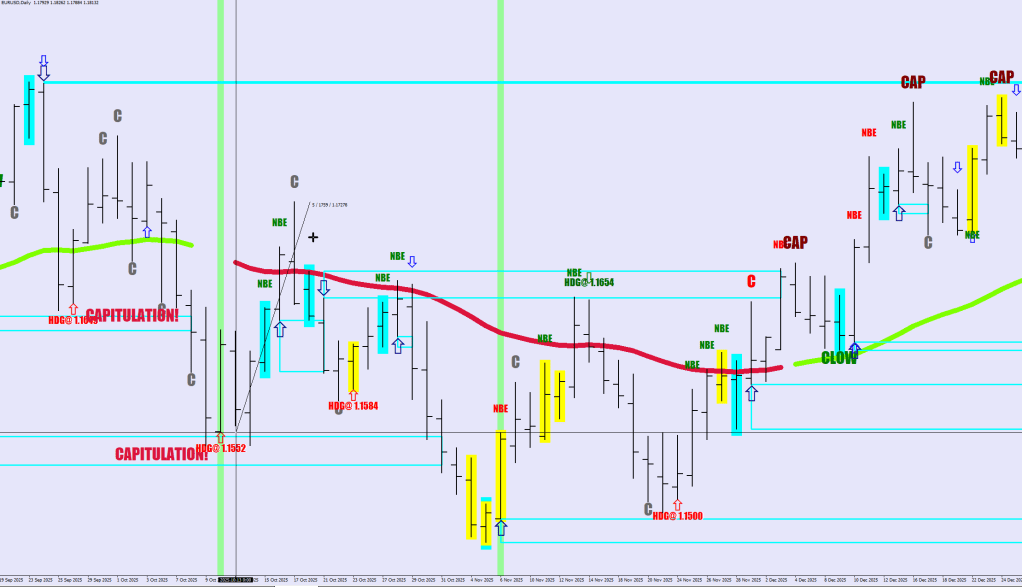
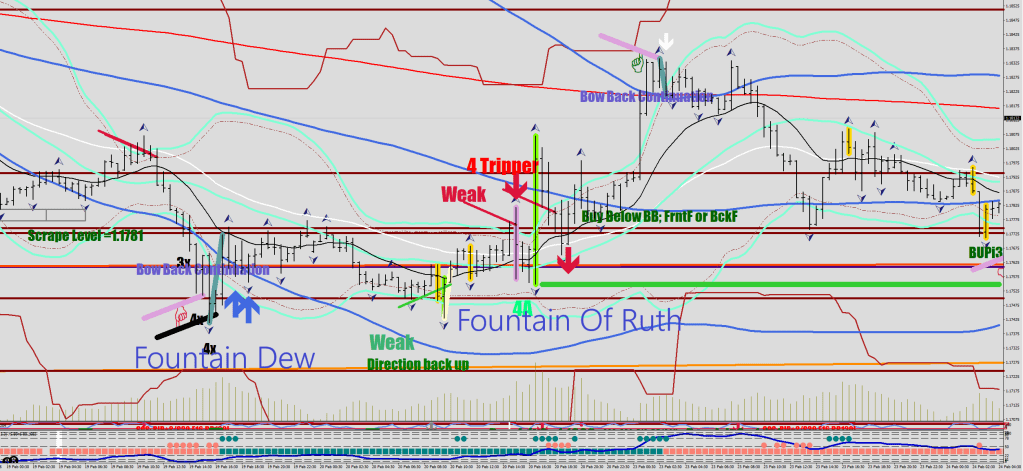
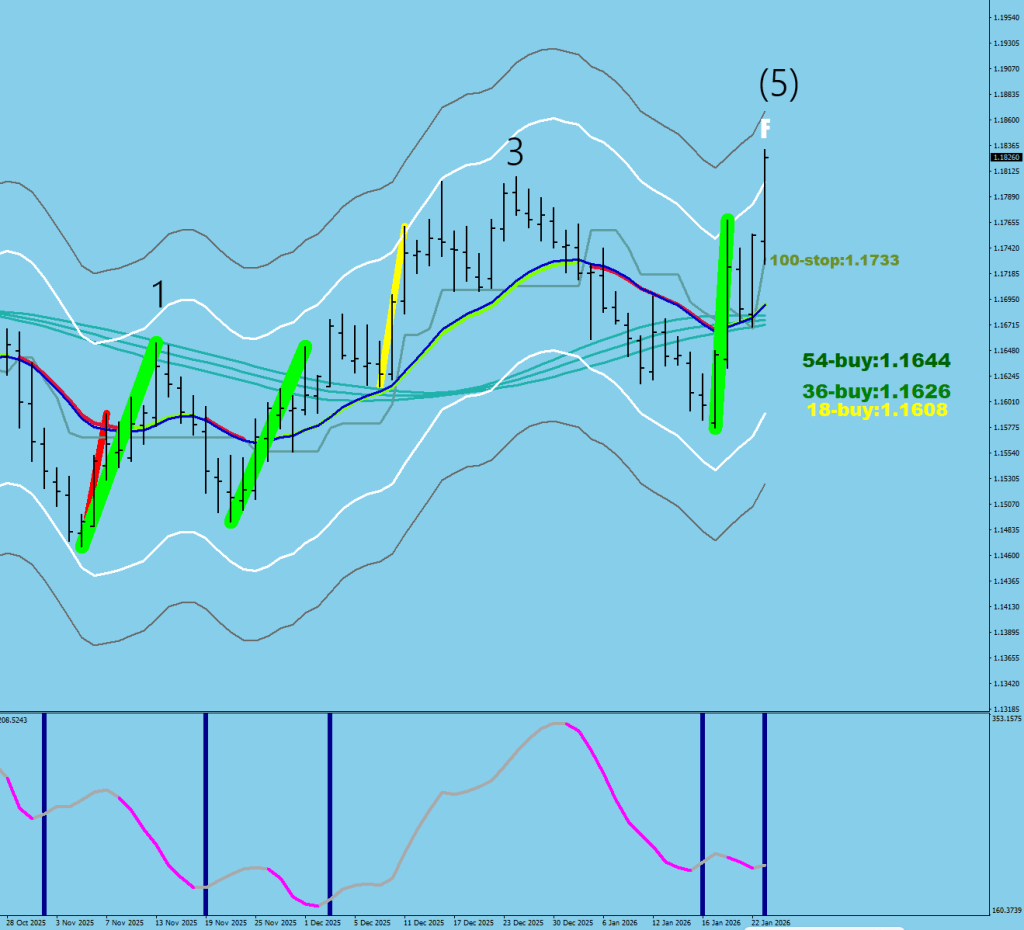
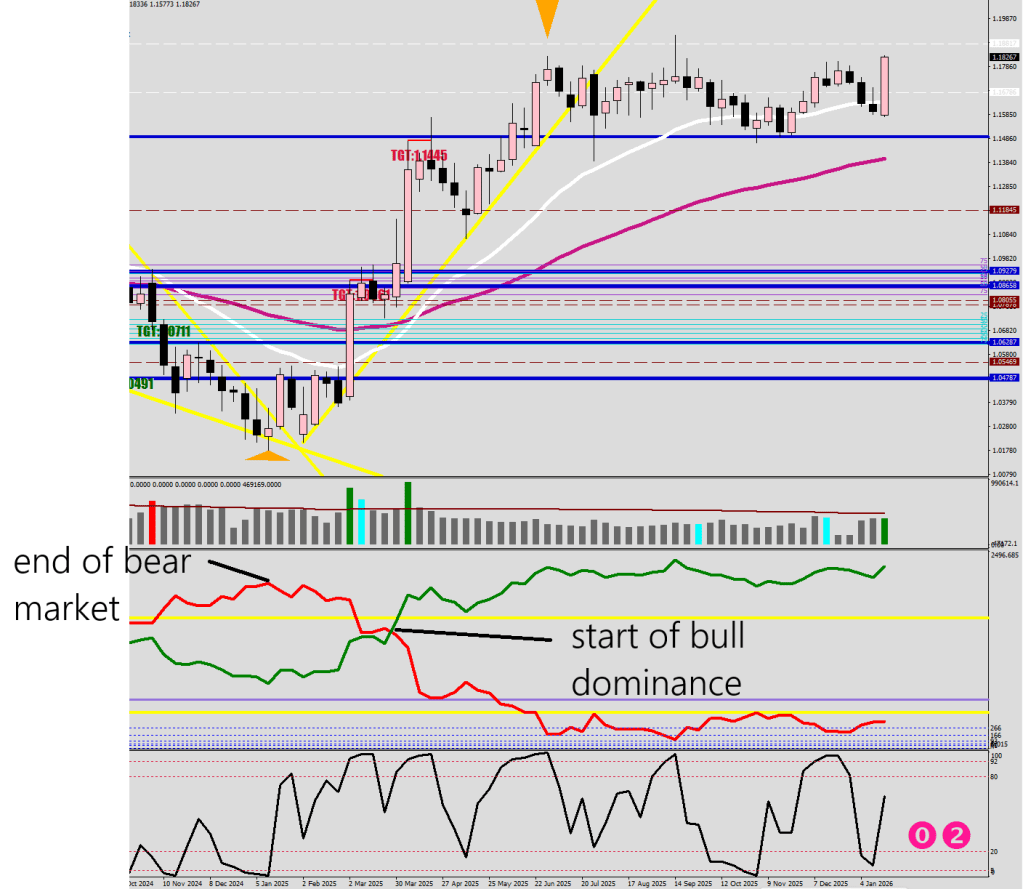
There is another market model here blended in with some holistic stuff.
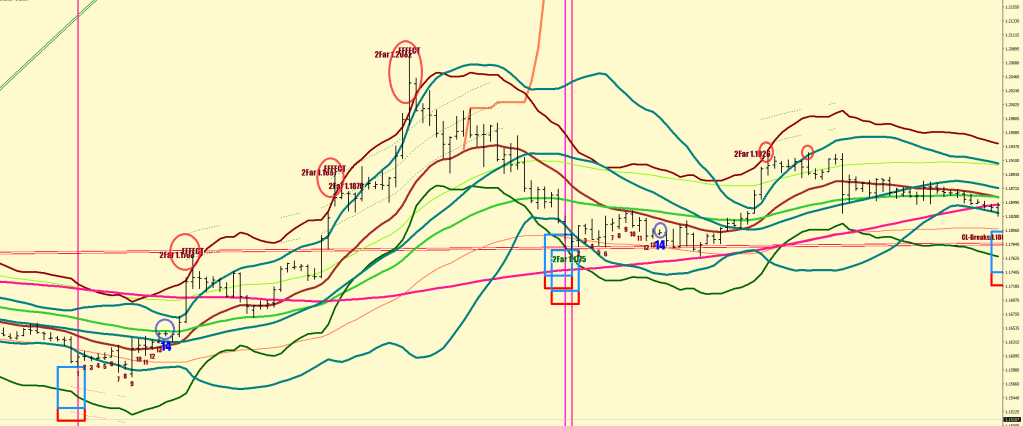
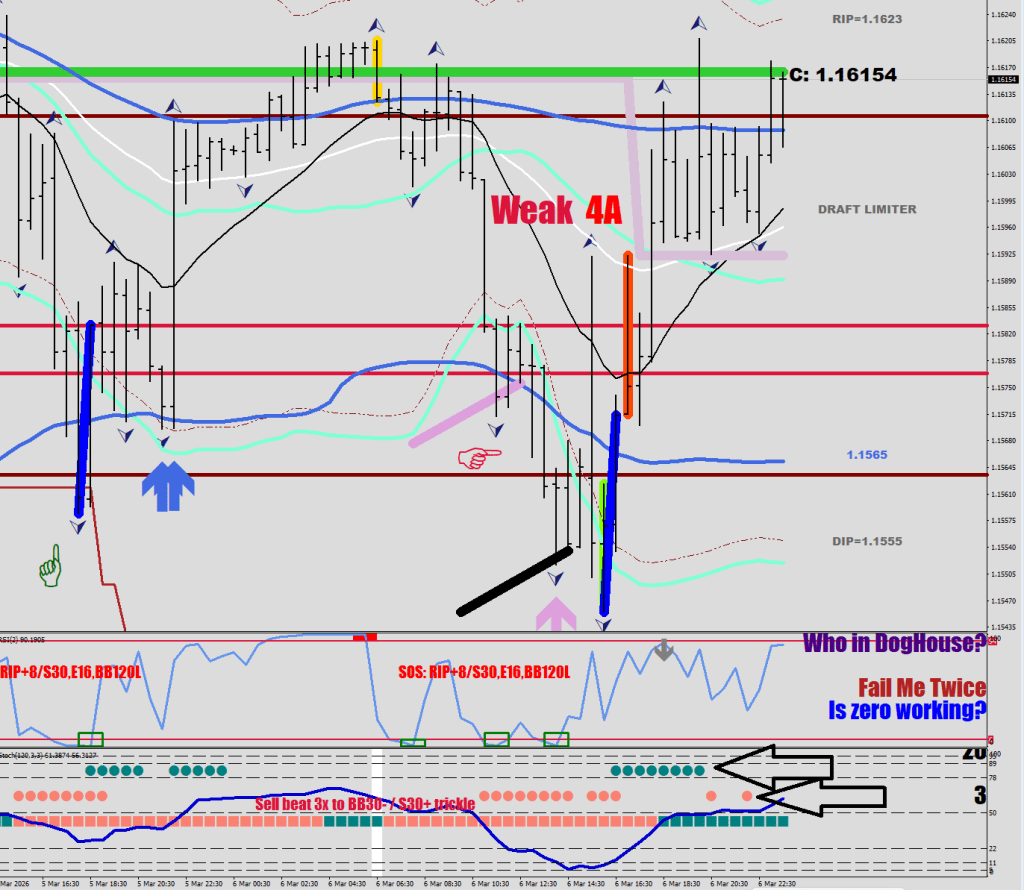
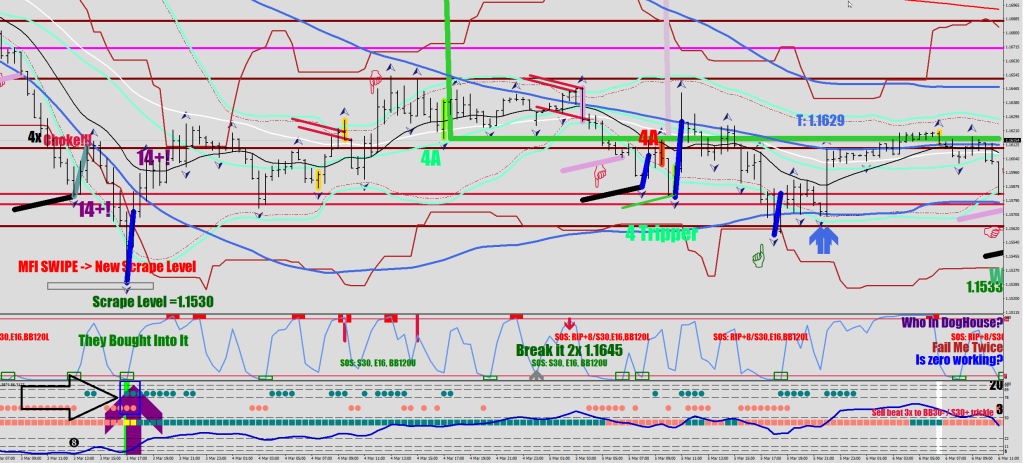
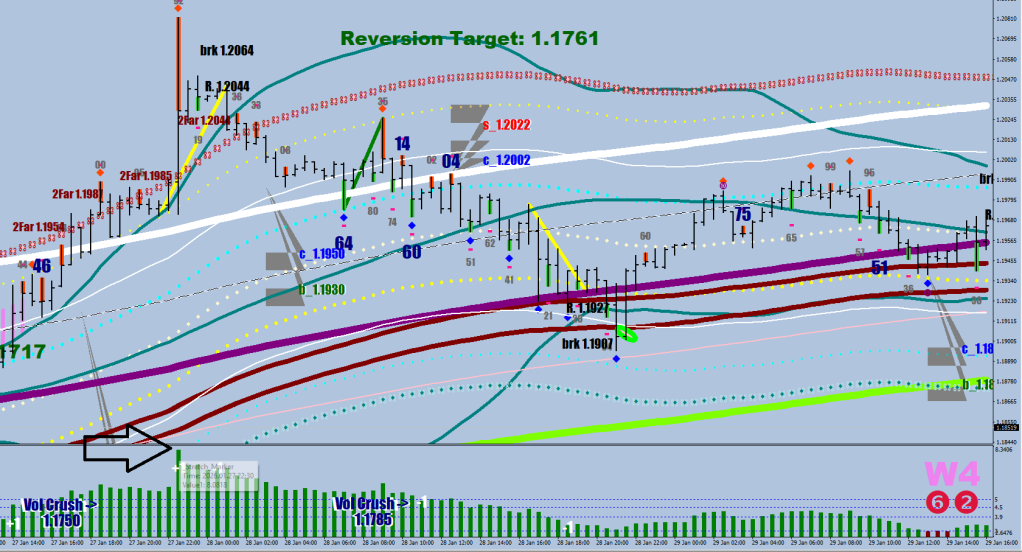
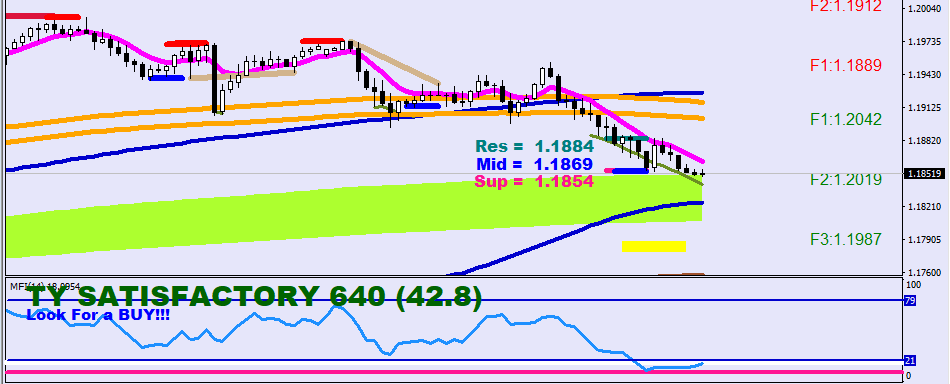
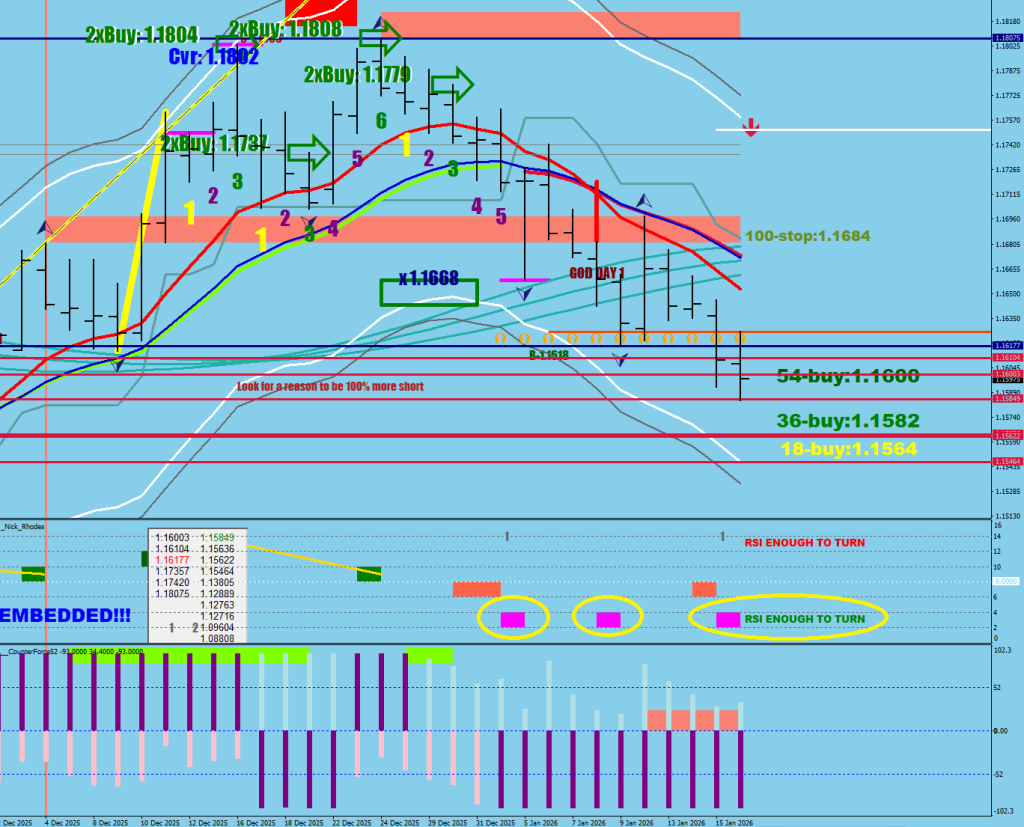
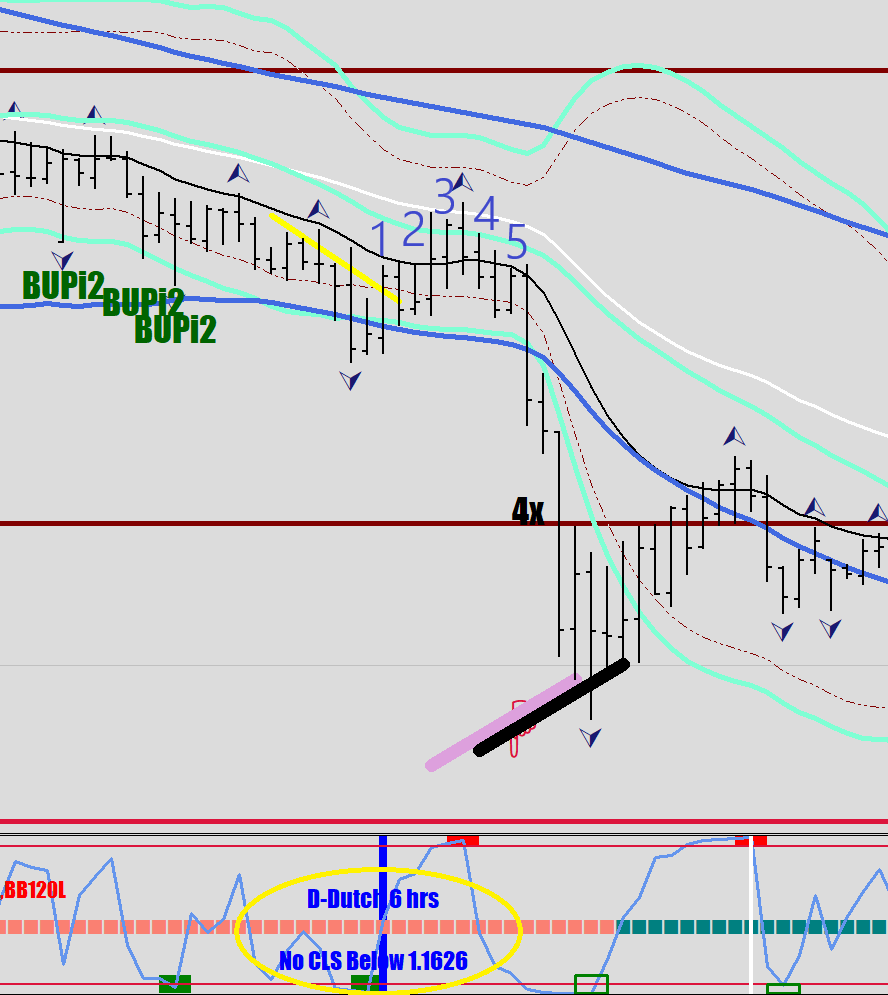
This is a 4-hour chart, which I barely ever use, since I have not made too many indicators for it.
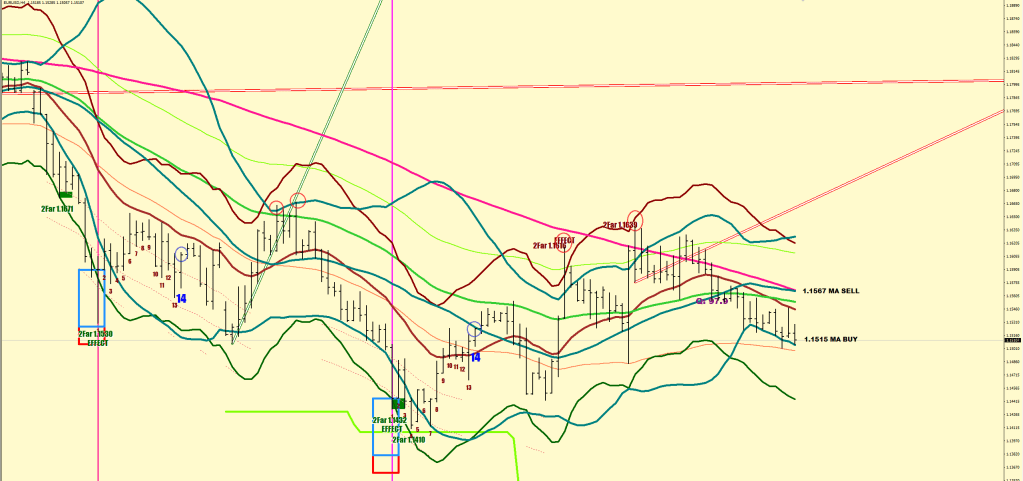
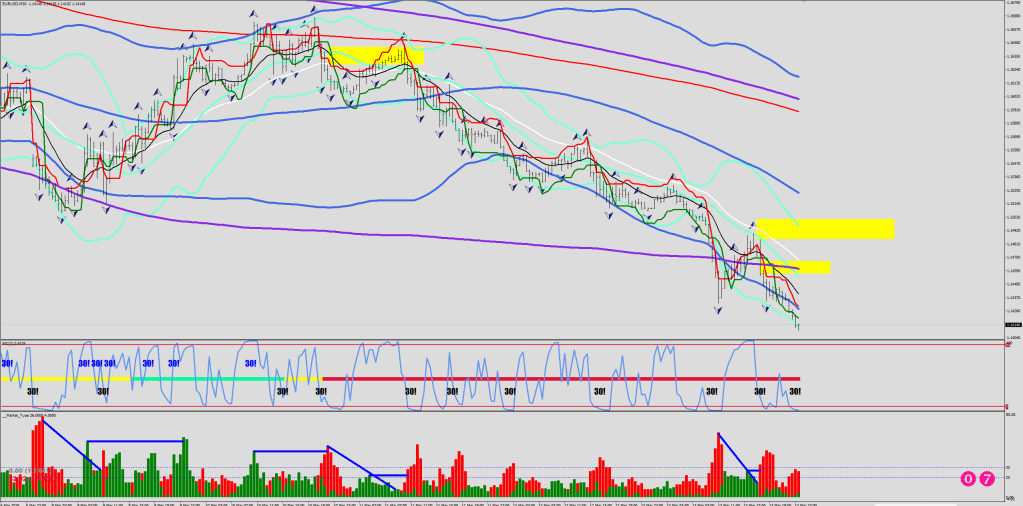
Now, to ease you into the whole thing, you should only notice some blue squares and some circles first.
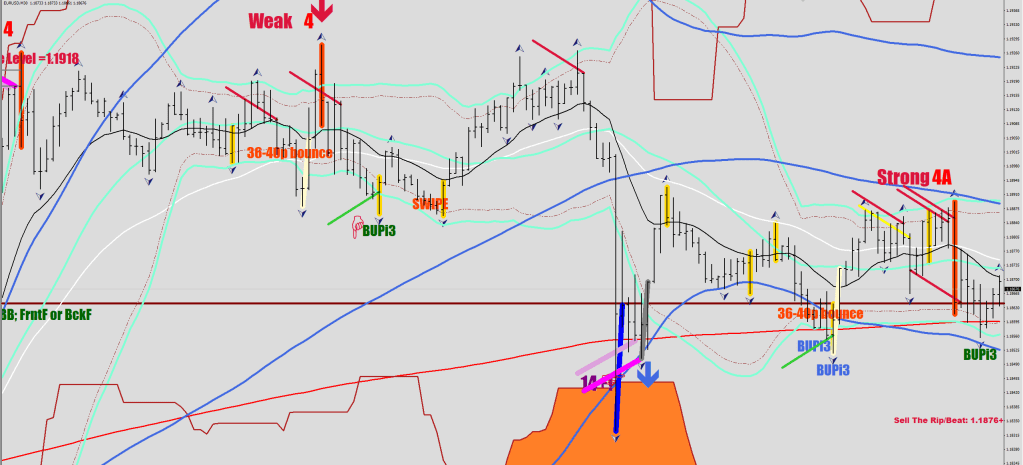
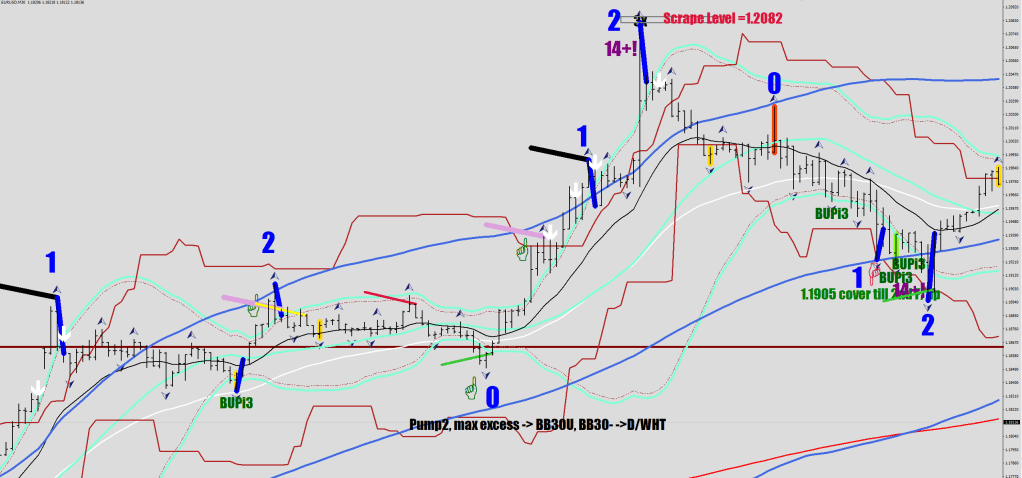
The Dodger blue box is a perceived important swing low in progress. The red extra is a bit of a moratorium area. The 14th candle’s close relative to the box (blue circle) is the m.o. of how things would progress from here. A mere close above the box would result in a move that would fail the upper Bollinger (30 sample, HL2) before continuing lower.
A strong close outside the box is projecting a move that is going to fail 3x at the brown line before proceeding lower.
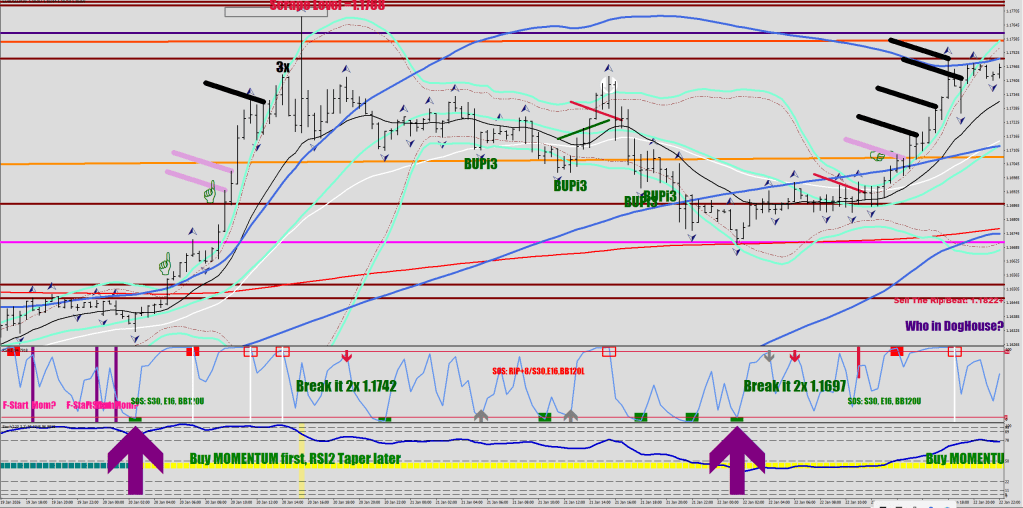
There are two triggers for the box to be invoked; on the downside, these are tied to either an RSI sequence outside the bumper line, and the guard rail
if (i>0 && Low[i]<guardraild[i] && Low[i]<lowerbumper[i] && iRSI(symbol,0,2,PRICE_MEDIAN,i+1)<1 && iRSI(symbol,0,2,PRICE_MEDIAN,i)<1 && iRSI(symbol,0,2,PRICE_MEDIAN,i-1)>iRSI(symbol,0,2,PRICE_MEDIAN,i))
or without factoring in the bumper line, below the guard rail and a Money Flow V print with RSI2 hitting an absoulte low.
if (i>0 && Low[i]<guardraild[i] && iMFI(symbol,0,14,i)<iMFI(symbol,0,14,i-1) && iMFI(symbol,0,14,i)<iMFI(symbol,0,14,i+1) && iMFI(symbol,0,14,i)<25 && iMFI(symbol,0,14,i)>12 && iRSI(symbol,0,2,PRICE_MEDIAN,i)<.5)
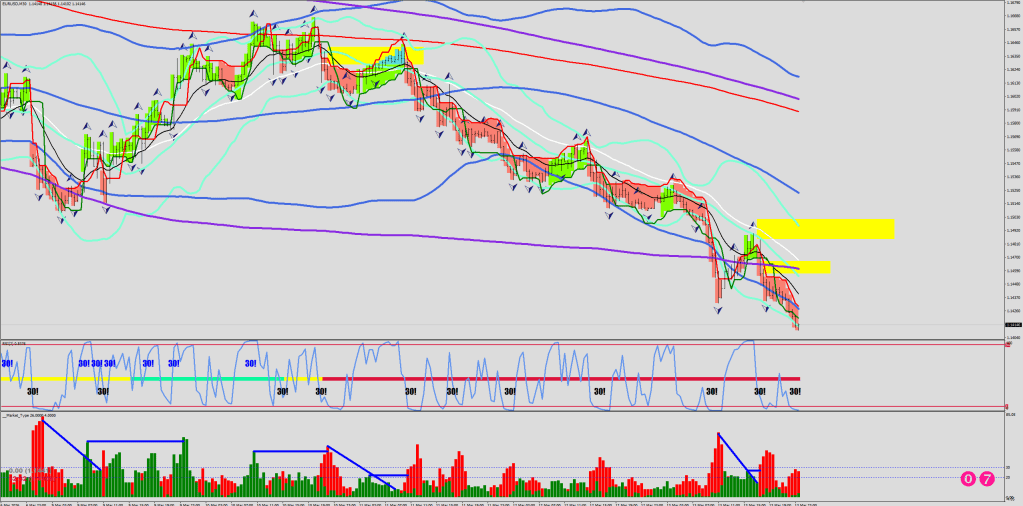
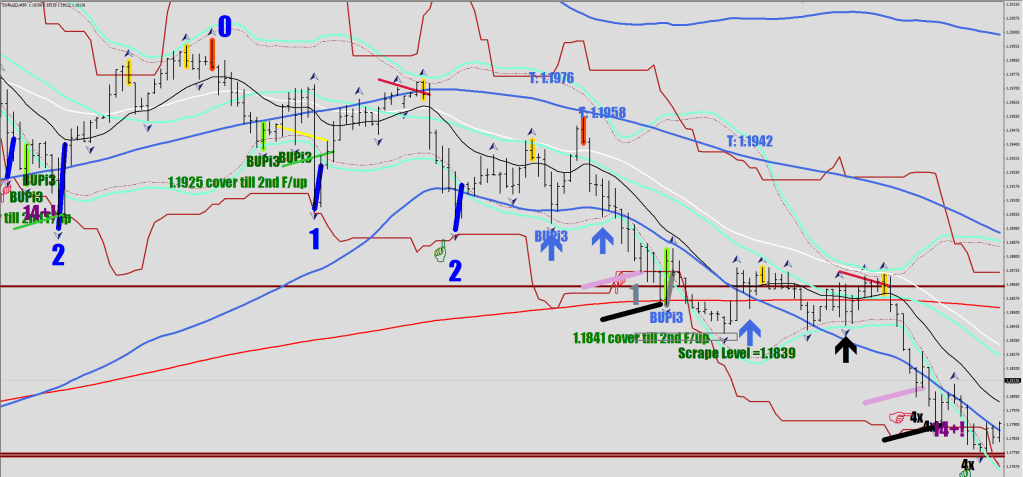
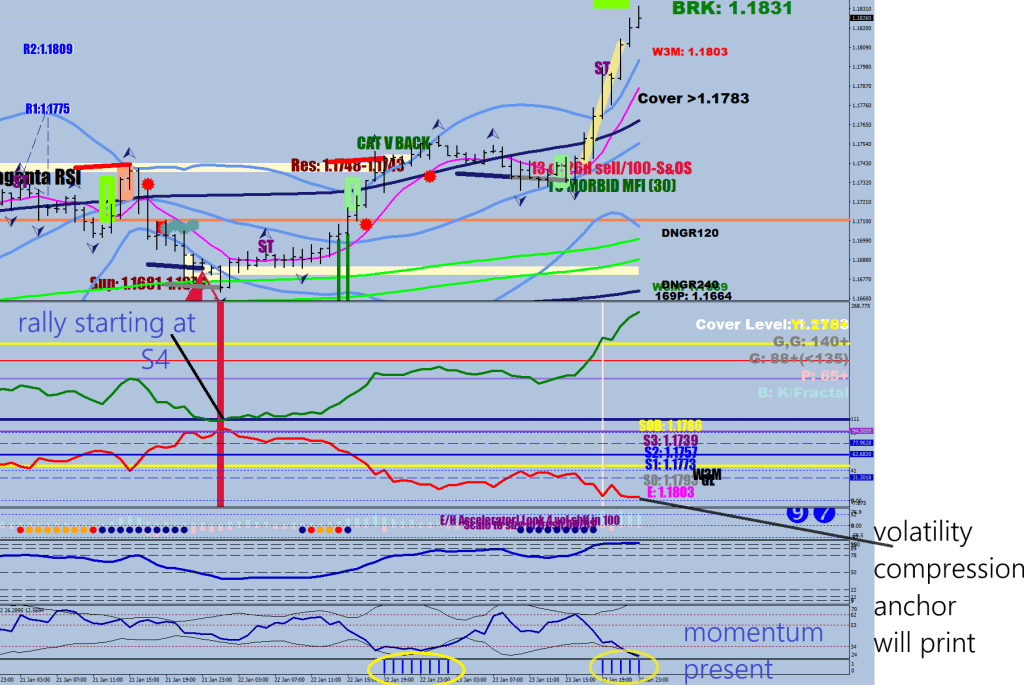
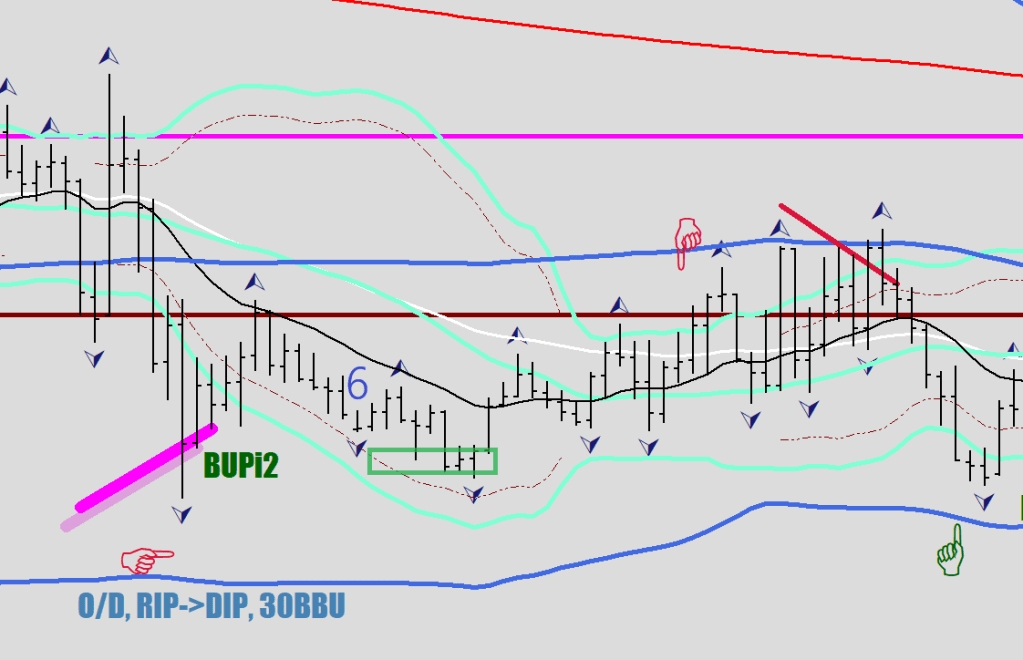
The brown line (overdrive line) is a displacement of the 8 EMA (4 hours delay) by 902.4 pips on the upside
 E32L[i]=iMA(NULL,0,8,0,MODE_EMA, 1,i);
 ODU[i]=E32L[i]+FMax*23.5*Point;
So, based on this little rant 1. the current low has not been confirmed, but 2. there should be another near miss of the overdrive line before continuing lower.
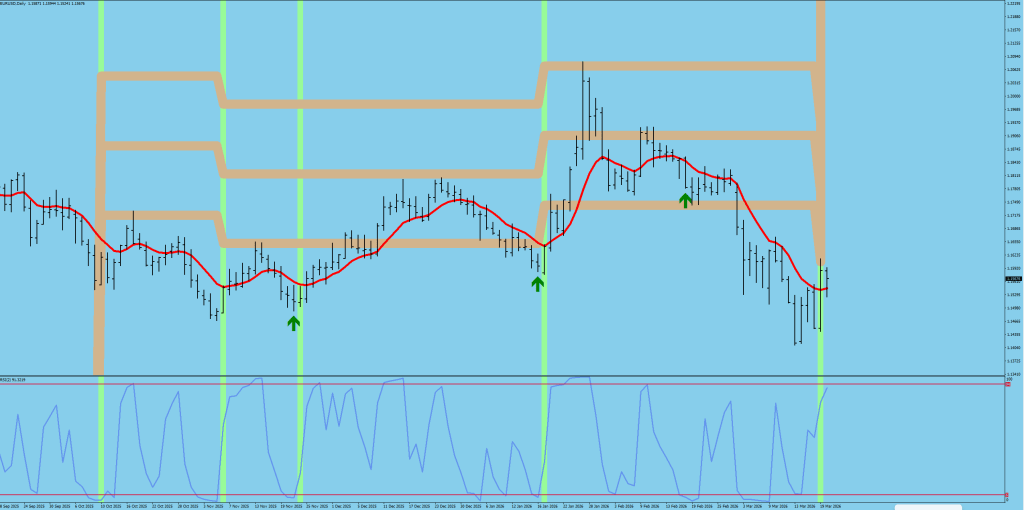
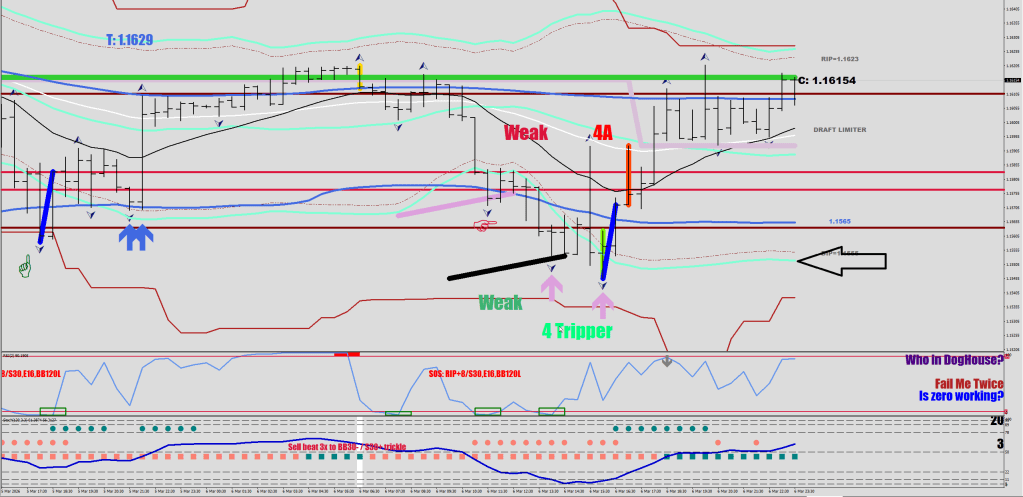
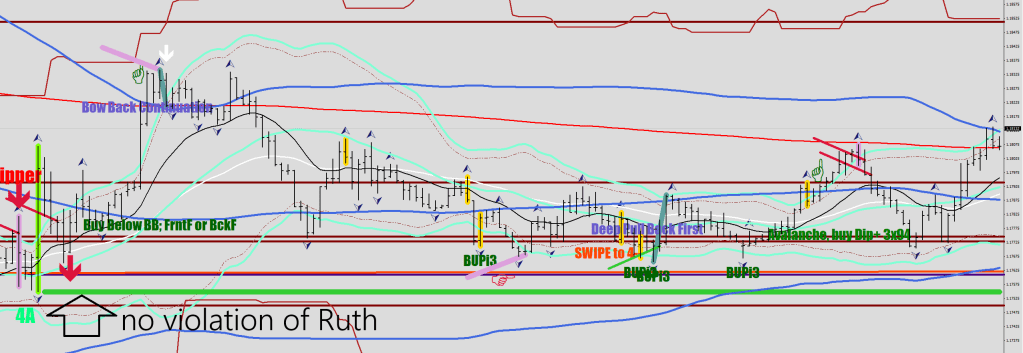
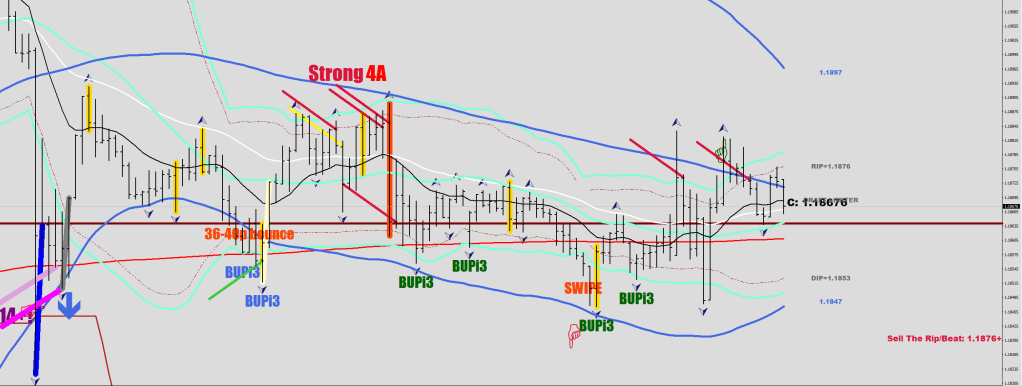
The other market model here is the Green River (9-day EMA Band = 52 EMA on 4-hour) with the Guard Rails (1 fluctuation maximum displacement in each direction).
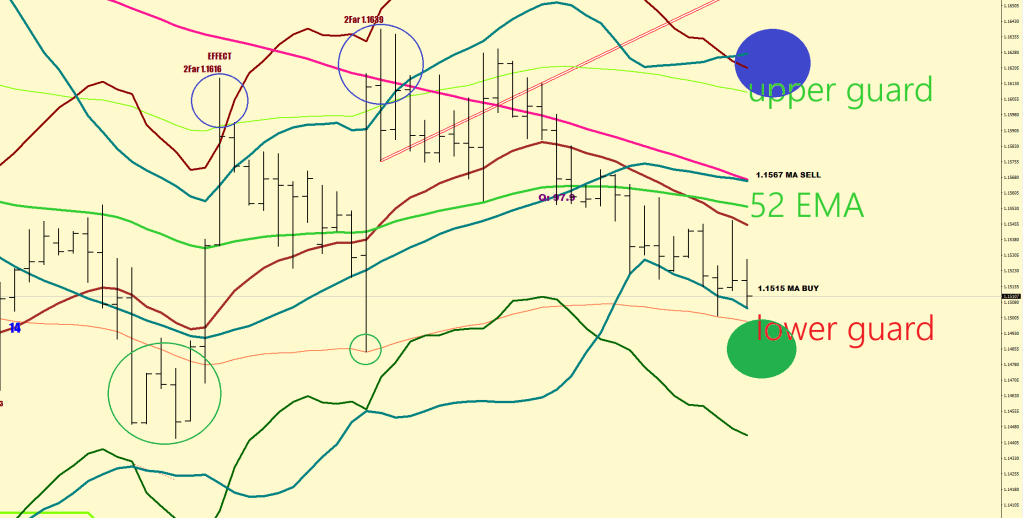
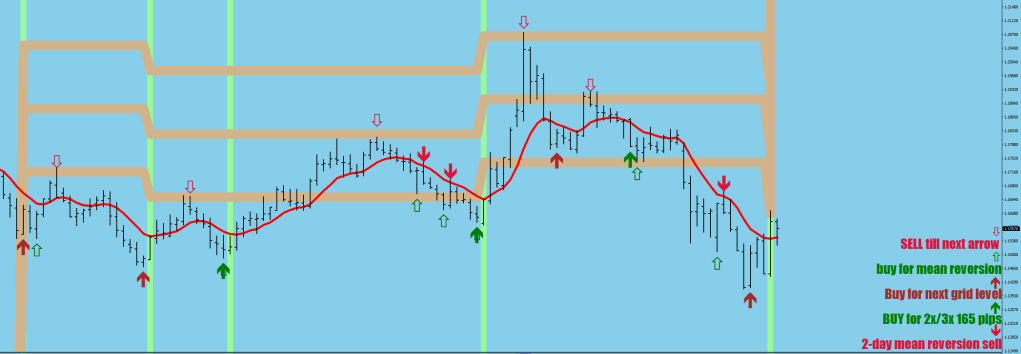
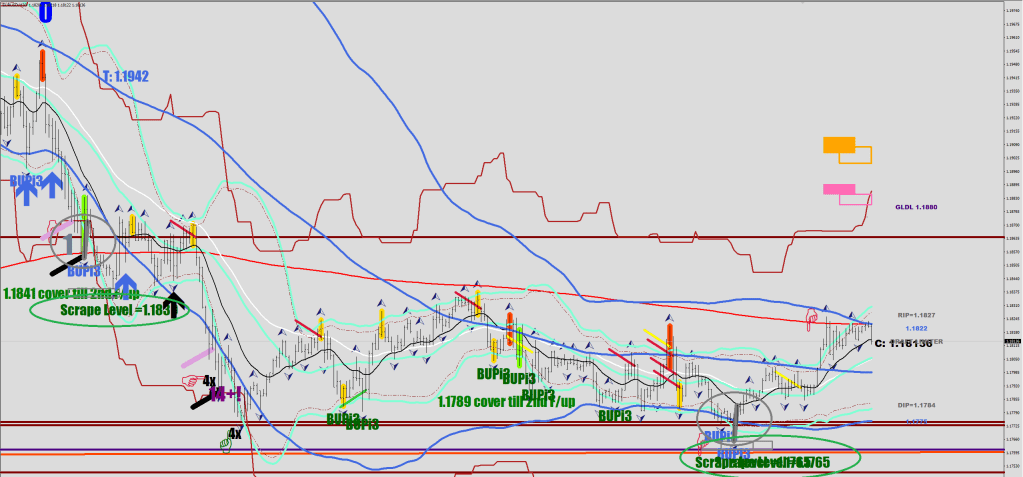
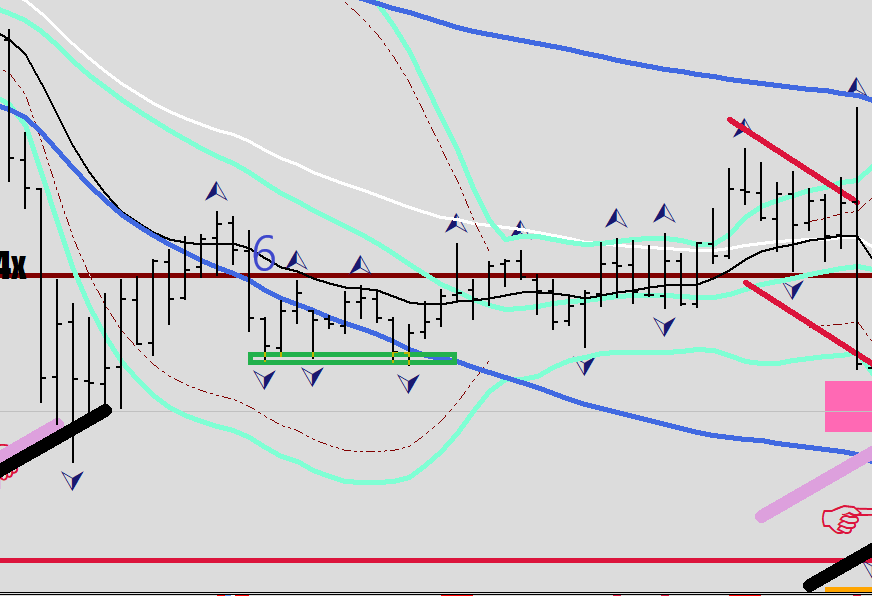
The third encounter with the overdrive line is projected outside the upper guard rail, of course, not before finalizing the low in the green circle.
It is scary how many things you need to pay attention to that you do not even have a clue about.
But what else would I be using my brain for? Making music can become too easy. Trading never does.
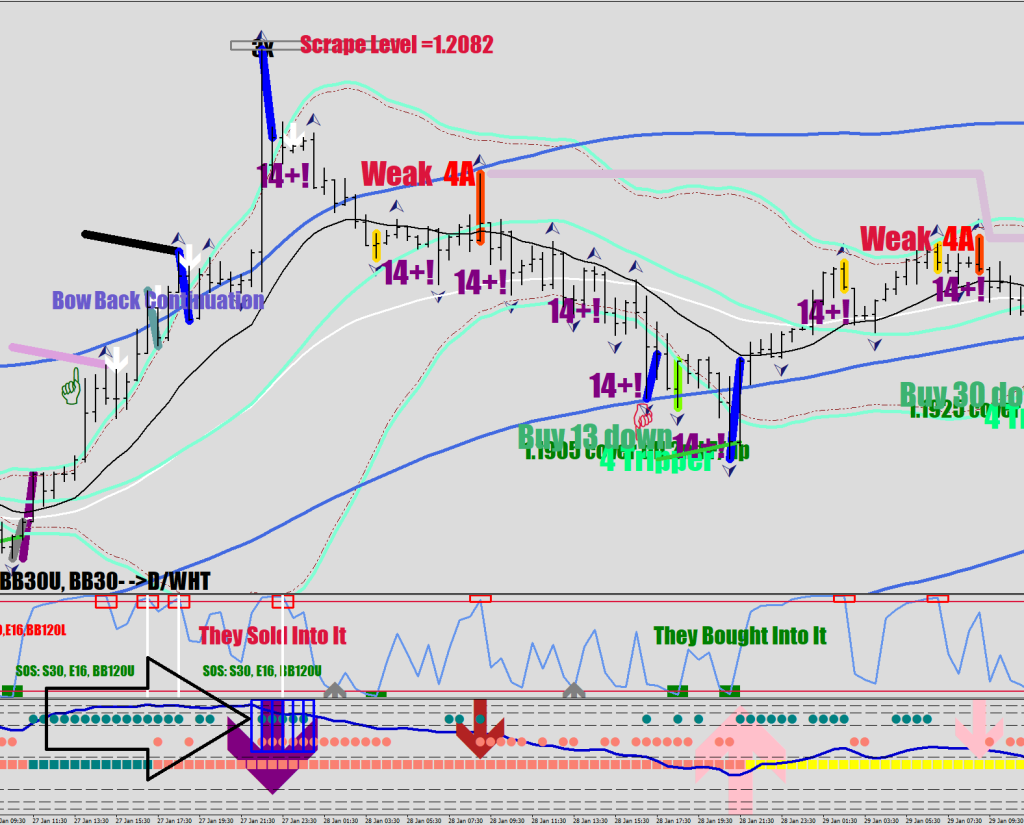
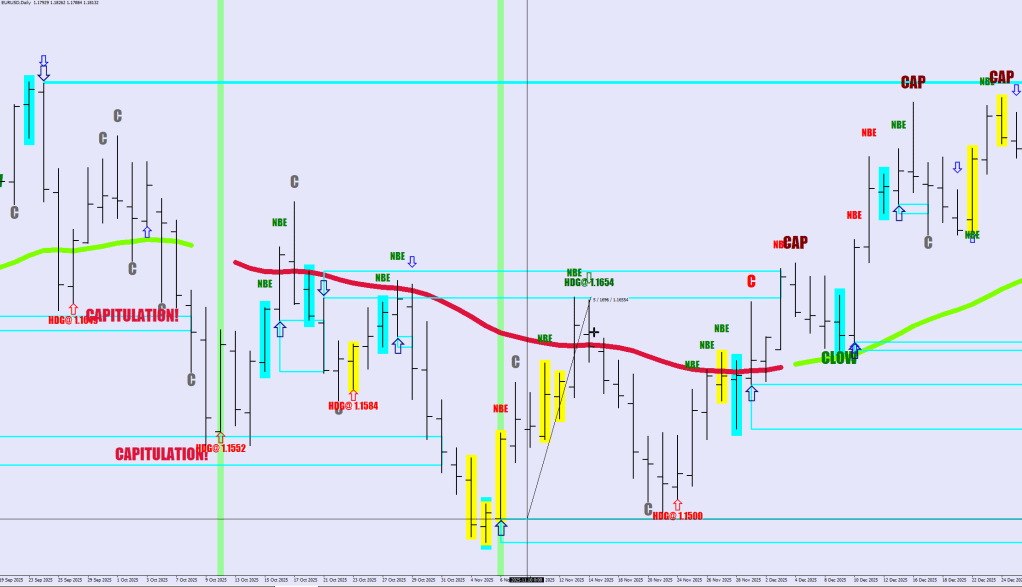
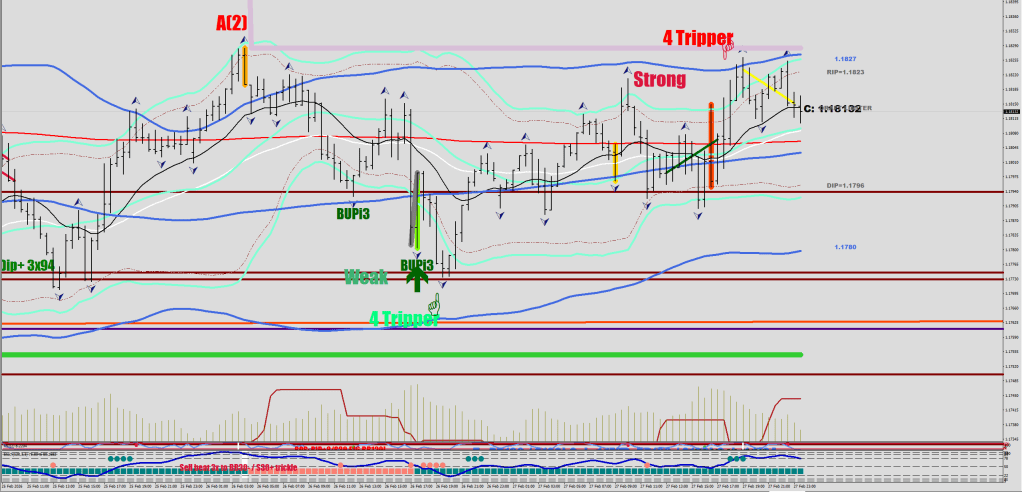
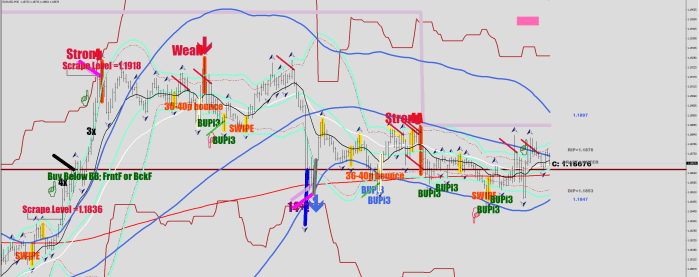
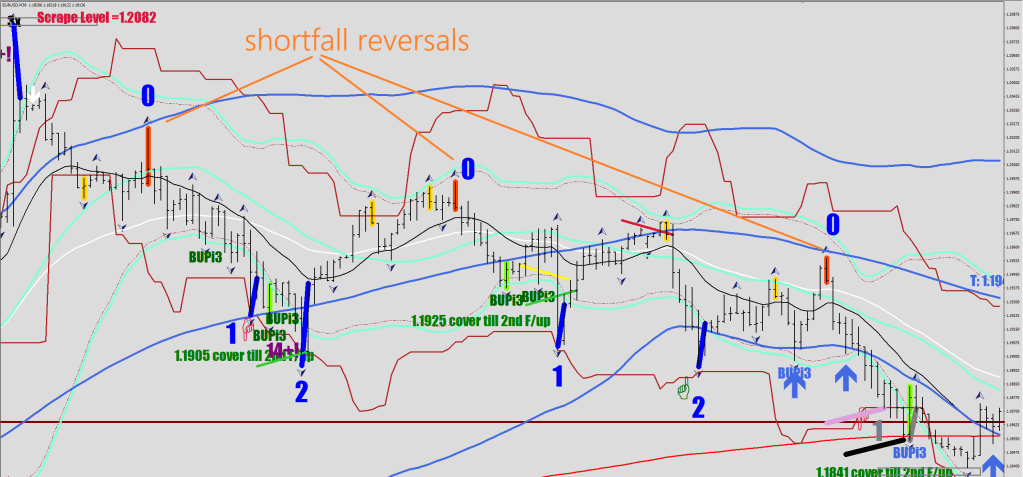
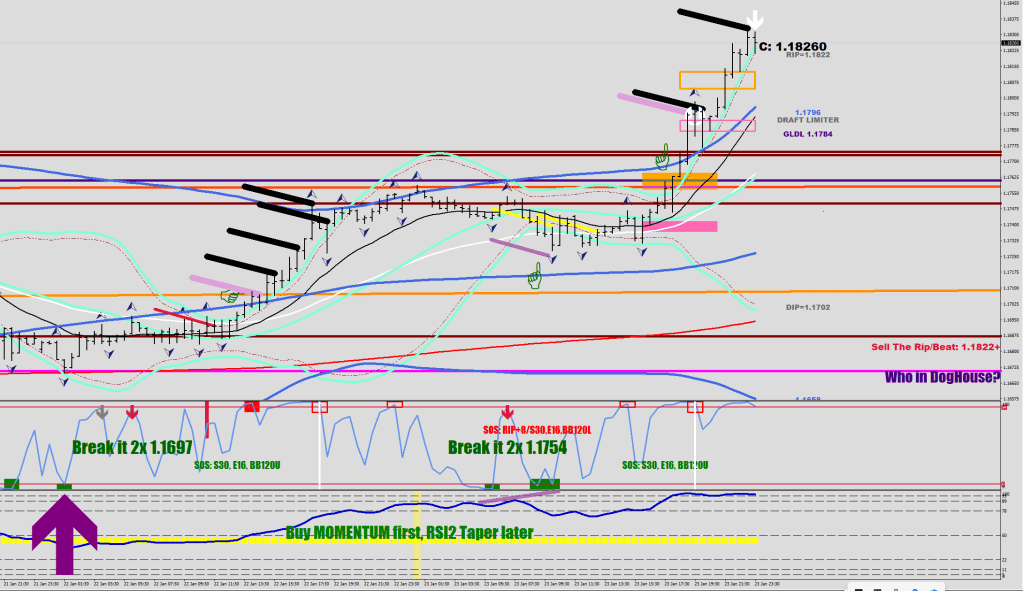
With a different skew, the strong close outside resulted in having to fail the overdrive 3 times.