I have mentioned before the need to push against something.
Here’s something interesting that seems to happen outside the hourly 120 BB.
For sufficient traction for another leg the price has to push back inside the 120 BB by 3-24 pips.
With extra abundant volatility (Election night) there are two lifelines to be had. The 30-sample BB and the 8 EMO. Once these two were utilized, the reaction from the BB was a mere 43 pips, and the next entry was a bona fide rally.
Notice how the lifelines resulted in incremental beats, the total progress was 32 pips out of the two independent price reversals.
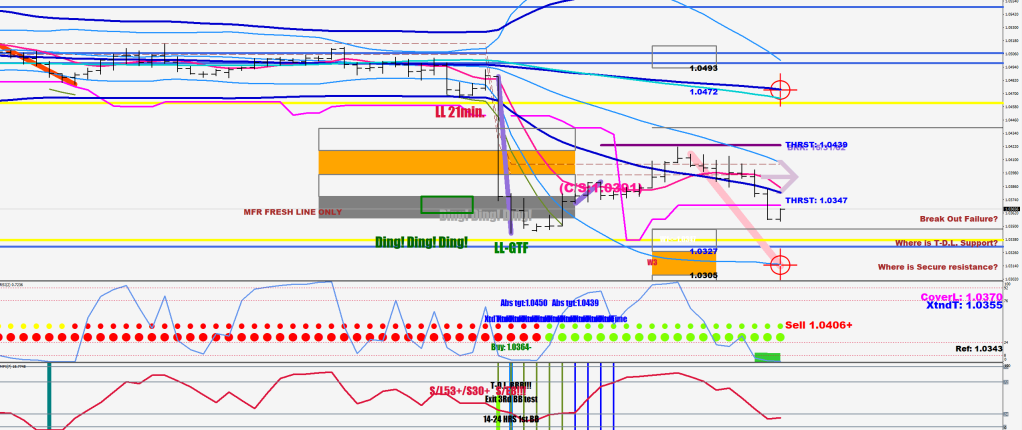
So my expectation here is a move back inside the BB by 3-24 pips.
Quasi having to balance out the hedge/overhedge. C/S stands for Continuation Sell. The 8 EMO plus 7 pips that is. A second highlight for the same area.
Yeah, this is a sell – you have a Red 9, but that does not mean at market.
I would try the red highlight instead.
There are two ways to finish this off.
The common way is a capitulation move, that is an LL fractal print about 16 pips lower, then a move back to/beyond the 8 EMO and a thrust that can be 70-90 pips lower than the swing high before the LL print.
The second way is a choke. After the LL print the price gets bent back down before the 8 EMO and makes a lower fractal 3 hours later another 8-16 pips lower.
I have scaled back in according to the plan. Missing only 0.5 lots.
The MFI went temporarily way too oversold. Two divergences would mark the end, the last leg should not get below 24 on the MFI(7).
First, there should be a lower low, followed by another brief touch of the 8-EMO before the risk of a bigger thrust becomes exponential.
Since the BBs started expanding, I don’t think it will be a small beat this time. I’m thinking 50-70 pips, which would mean 1.0280-1.0260.
I have pimped out the program from the last post with a counter, last week’s pivot, and some numbers. Ci means the level of consolidation (53+ means full), C just stands for the current price in large so that I can see it from the bed, and the Delta is the risk for 10 pips.
To better understand what an acceleration is, here is some finger practice.
An acceleration has 3 basic criteria.
A 7 Sample money flow below 19 or above 76
A 10-sample range of 46+ pips
the push has to occur against the upper 30-sample BB or the 30 SMA
It goes without saying that a Thrust requires an acceleration beforehand.
Examples.
In the first example, the push happened against the Upper BB. In the second example, the push was against nothing (furthermore was outside the 240 BB as well), in the third example, the time factor was the main culprit. Within 10 hours it had to have a peak at the upper BB or the 30 SMA. A return to the 80 SMA is a disqualifier, not a start, but rather an end of something.
The idea behind the purple thingies is that an acceleration could occur against them, but if 9 hours later the price is still not outside the light gray band, you must buy.
I’ve noticed some useful things about monitoring for 30-sample BB width on the Daily.
 ExtATRBuffer[i]= (iBands(symbol,0,30,2,0,PRICE_MEDIAN,MODE_UPPER,i)-iBands(symbol,0,30,2,0,PRICE_MEDIAN,MODE_LOWER,i))*10000;
 if (ExtATRBuffer[i]<ExtATRBuffer[i+1]) ExtATRBuffer2[i]=ExtATRBuffer[i];
 if (ExtATRBuffer[i]<ExtATRBuffer[i+1] && ExtATRBuffer[i]<360) ExtATRBuffer3[i]=ExtATRBuffer[i];
Green vertical: the flip in the expansion/start of contraction (bottoming/topping action).
Blue vertical: the flip in contraction/start of expansion (break out).
Purple = highlight of the contraction.
Magenta = less than 350 pips, contracting phase – possibly the end of a move/deep pullback.
Kampec Colores.
Onto Roultette.
Now, another thing seems to work well during the loss of volatility phase.
Talking the black horizontal arrows and the Buy/Sell For 16 Pips plots.
The whole thing revolves around the prior idea of the market switching off around the 8-hour EMA of opens. (The dots show the hourly history).
3 closes on one side red/green. Offbeat: black.
2 blacks in a row is a trigger for the potential turn. Low-risk entry with getting in on the 2-sample high/low and riding for 16 pips at least or getting stopped out in the money. A second pending entry 5 pips out for a second dip and 21 pips or more to be had.
(Listen Without Precipice)

Still-pictures set in motion

A white shark's Christmas

Mrs
May is in disarray

(What am I gonna get for Baby Shark this year?)

Running out of Free-tossing bodies

The fridge is full of salt

I need to fix my teeth too

Bear claws would be nice

(I'm dreaming of white surfers)
[coughing, choking sounds]
(Last Christmas I gave you some frisbees…) (I ain’t never gonna swim again the way I swam with you…) Let’s smoke some puffer fish And get “drown” on it (’cause I’m hunting high and low…) [A-ha music runs]
[coughing, choking sounds]
(Last Christmas I gave you some frisbees…) (I ain’t never gonna swim again the way I swam with you…) Let’s smoke some puffer fish And get drown on it (’cause I’m hunting high and low…) [A-ha music runs] Let’s do this in up and arms with Mommy Shark!
[chorus]
I’m dreaming of a white surfer … Last Christmas I gave you some frisbees … Bear Claws and Turkish Delight … A shark can dream, can’t I?
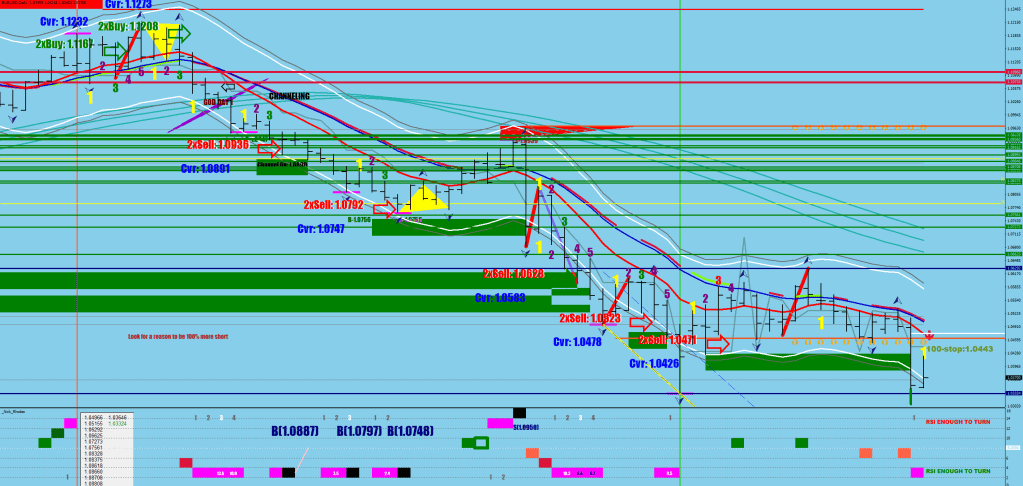
A market that is hitting the upper white band (2.8x stretch from the E-9) on the upside but not touching the lower one is an uptrending market.
A fresh-out condition (F) may be the start of a full turn or a correction. An F gets voided (not white) if in the following 3 days the volatility extreme gets exceeded.
A reversal requires the re-visit of an F 3 times in a row, then a break and a close outside of the box drawn.
A major top/bottom stats with the proof of a counter-directional volatility. This is a clearly visible ABC move (off #1 – on images 1 and 3). The A would miss the opposite band by 56 pips, the B would miss the band on the side of the F by a little less (say 42, 36 in these examples) and the C would miss the opposite band by even less than A did. The second F is #2 the 3rd F print requires another ABC move, but way smaller in amplitude. Nevertheless, the size is such that it should take a minimum of 3 days to print with the B falling shy of the F, and the C2 falling shy of the “A2” (a contracting pattern), then #3 would be the undercut of both 1 and 2.
There are measurements that are relevant. You should remember them.
For instance, it is possible to anticipate ahead of time the location of the first HH or LL after a section of acceleration. Fade heavily 10-13 pips out. If you want to make sure to get some fills, put out something at 4, 8 pips.
Similarly, with the knowledge that a thrust is bound to follow the HH/LL print you can be in the move by at least taking on a full hedge (if you have holdings in the other direction) 25 pips out and keep on adding (overhedge) all the way to 49 pips.
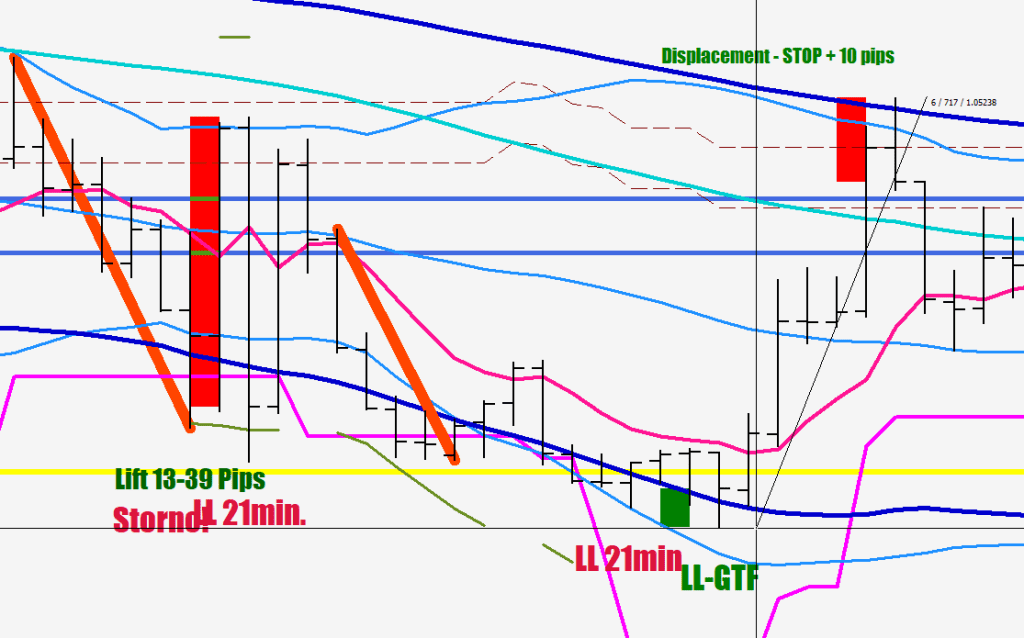
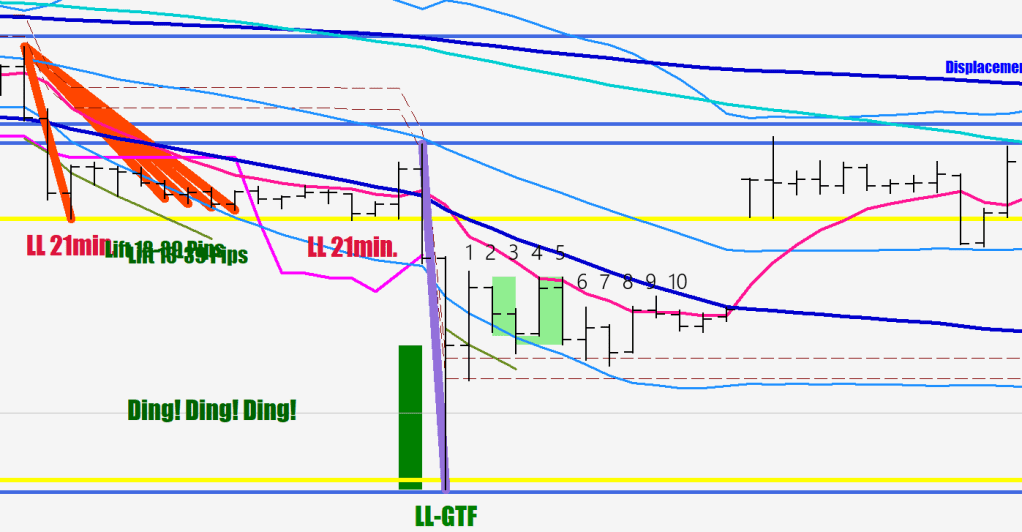
LL 21min. calls for a minimum of 21 pips retracement.
An LL GTF is good for 50-80 pips.
What is the practical use of an expression like “nothing goes up in a straight line”?
Once there was a downside Thrust (pruple), the first le up sould be at least 50pips, most likely would fall short of the 80-pip line, and in an absolute extreme there should be a 45-pip pullback after a 100-pip leg up – meaning that you would at a mimnimum get back the money for anything that was opened 65 pips off the bottom, and the trade is not likely going to go against you more than 15 pips.
See, this is an environment that you can plan in ahead by having some statistical understanding.
Once the price has diverted from the 8 EMO a great deal, after crossing it, you start to count the following hours. By the 10th hour you should have the lowest low that the first deeper correction will make. One shallow correction would be followed by one deep. Actually, the example I brought has the lower BB for a substitute of the 8 EMO, because of the peak volatility at the end of the last leg down.
The stretch multipliers are in fluctuation maximum from the E-9 band. A 4.5x stretch used to be normal volatility years ago. Now these are rare reading.
See, even time can be useful for knowing when to cut holdings. Particularly right before a 60-pip gap up.
I’d say, scaling out of shorts during the 10th hour is a sesible move.
They tried some pilot buy at the Goosing level, but ultimately price has made it to the support level relative to the consolidation mean.
This does not look bearish. An uncomfortably deep bow back.
It won’t be bearish until a new acceleration gets printed. And for that the MFI would have to go below 14. Sure, it could coast lower in the next hour. When that happens, you can always hedge yourself back at the 8 EMO.
17 was the low reading. Funnily, the money flow did not get oversold enough to qualify.
There could be a bow back bending the price back from the daily E-9 or a bit beyond (red line), these triangles (yellow) take 3 or 4 days to print, meaning a higher low near here on Tuesday, but a visit of 1.0460+ is very likely first.
…cry wolf, time to worry…
After the post there was a 14 print, and now the acceleration has been confirmed. It is most likely a trap, because the entire push is happening outside the 240BB.
Plotting BB rejections starting now. First pass at the filters. (Green and Red rectangles). The idea is to define risk and have something to hinge the size on. I plot the rectangles one candle back to see the actual candle better. Real-time/repaint is what I went with, as 1 hour later, the price may have gone too far already.
If the next hour does not make a lower low, the Thrust is in, and it is the thick kind outside the 30 BB and the 120 BB.
The acceleration takes the 7-sample MFI below 14. The LL makes an MFI reversal divergence, but it is still in the oversold zone. The Thrust does not get into the oversold zone (24).
The (last) THRUST is 2-6 hours long continuous buying/selling (typically 2, 3 or 5).