The right shape makes a high in 18 hours and breaks it by hour 19/20.
Examples:

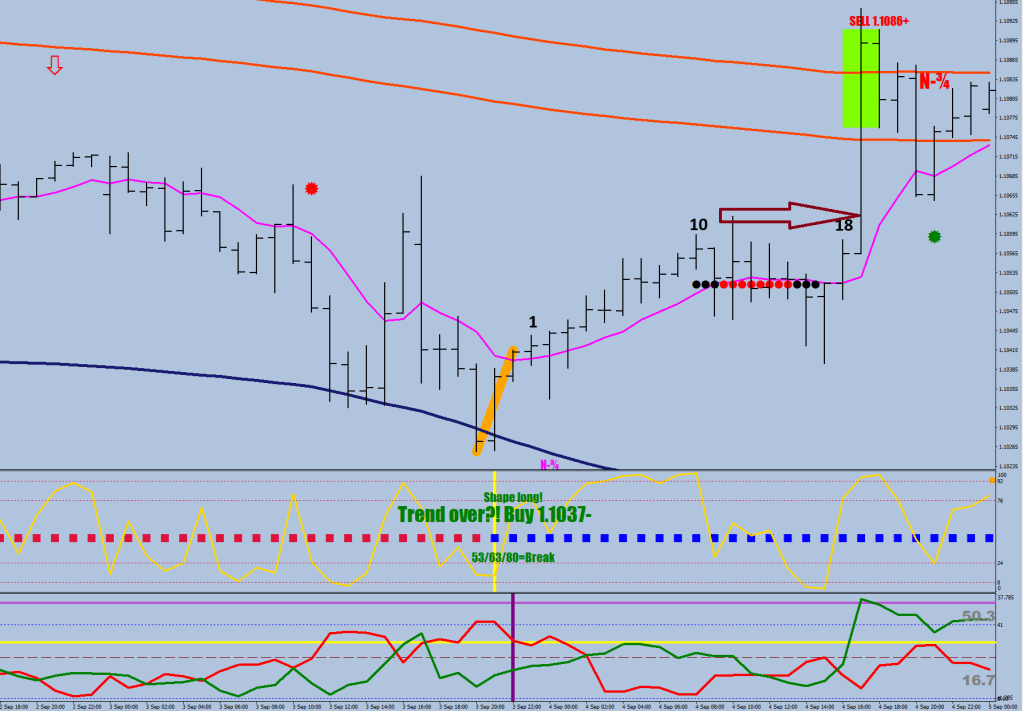
The wrong shape does not make the break.


The right shape makes a high in 18 hours and breaks it by hour 19/20.
Examples:
The wrong shape does not make the break.
Here’s where I was wrong:

From trending mode, the market cannot switch to neutral. It takes on a senior trend coat.
In a senior downtrend add size at every M-D pair, trail the excess
Close some beyond 42 volatility / 42 volatility undercut
Do not predict a shape, but if it prints, go with it
The turn can fail at 53, 63 pips out (20 hours)
At 80, the turn is carried out.
M-D examples


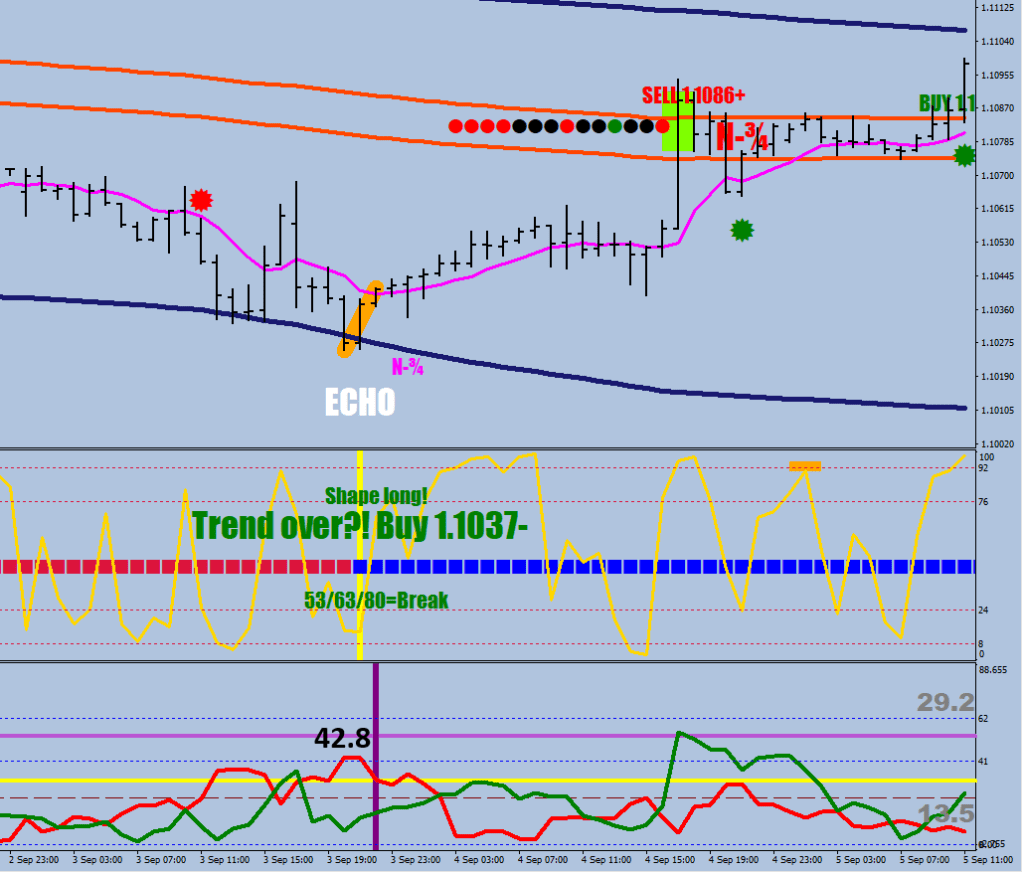
The dip below the BB did happen. The 42-pip leg did appear even with keeping the 10-sample.

The money flow did go oversold on the 30-min. A bit too low at that.

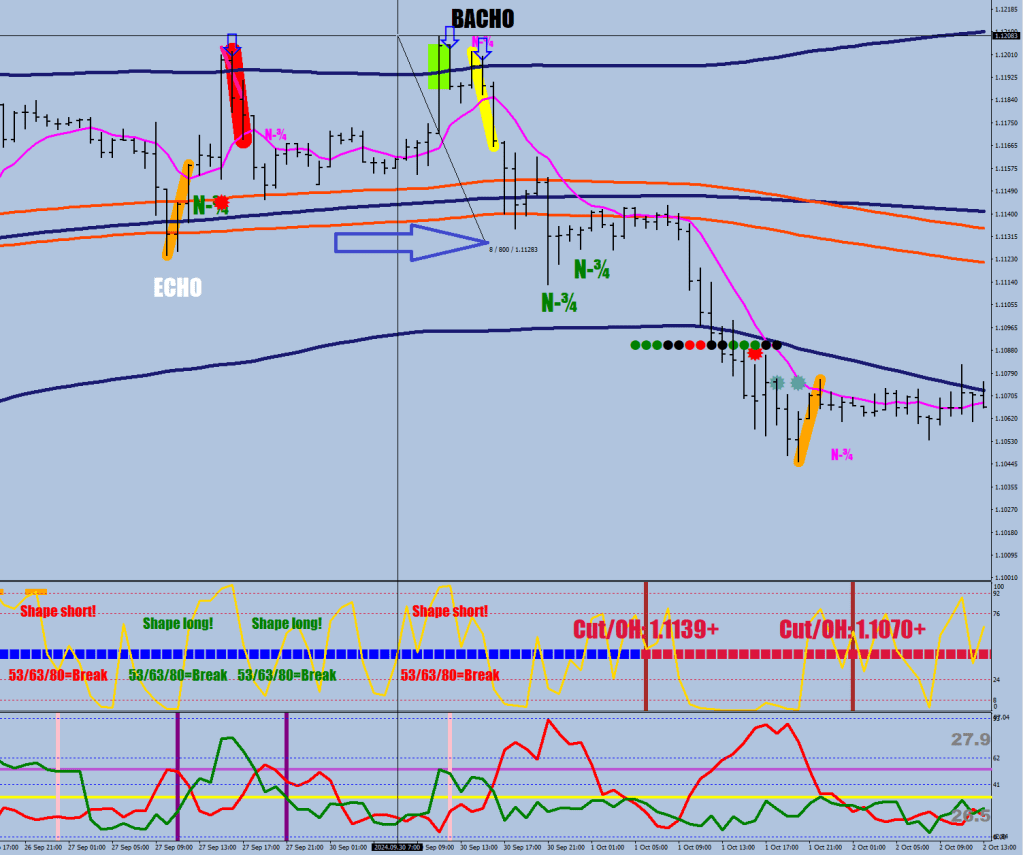
If the current hour would close above the 240-BB (or one following) there would be a window of opportunity to print a shape. Let things develop. 53-pip or 63-pip up the shape could fail (count out 20 hours) upon breaching 80-pips, the breakout may be on, and a pull back to say 60-pips would be a buy.
…

Back in the eighties, some Volvos had a button on the stick shift, it was called the halver.
So, I drew these first.


(as you can see a money flow reversal zone was printed by the last money flow extreme, 1.0876 has been called in since)
Then I updated the shape’s filters on the downside because I thought, what if you don’t get 52 pips?
So the discount’s criteria was that the price dipped below the 240-BB.
///shape long
   if ((ExtATRBuffer[i]<52 && ExtATRBuffer[i+1]>52
   && ExtATRBuffer2[ArrayMinimum(ExtATRBuffer2,10,i)]>2
   && ExtATRBuffer[ArrayMaximum(ExtATRBuffer,10,i)]<64)
   || (ExtATRBuffer[i]<42 && ExtATRBuffer[i+1]>42 && Close[i+2]<iBands(symbol,0,240,2,0,PRICE_MEDIAN,MODE_LOWER,i+2) ))
The last time we saw a triple divergence was with Wave 3 on the way up.
There was a higher high made later, but Wave 4 made it to 175 pips in 7 trading days. Important stats.
Now, the slight problem is that time has slowed down. If I want to see a minimum 42 pips, I can by the doubling of the sample size and measure from that swing high.

The dilemma is that I can almost show for the 42, but why is this staying off the 240-BB? Is this some relative weakness? Would this dip happen still? Hanging out till LaGarde speaks?
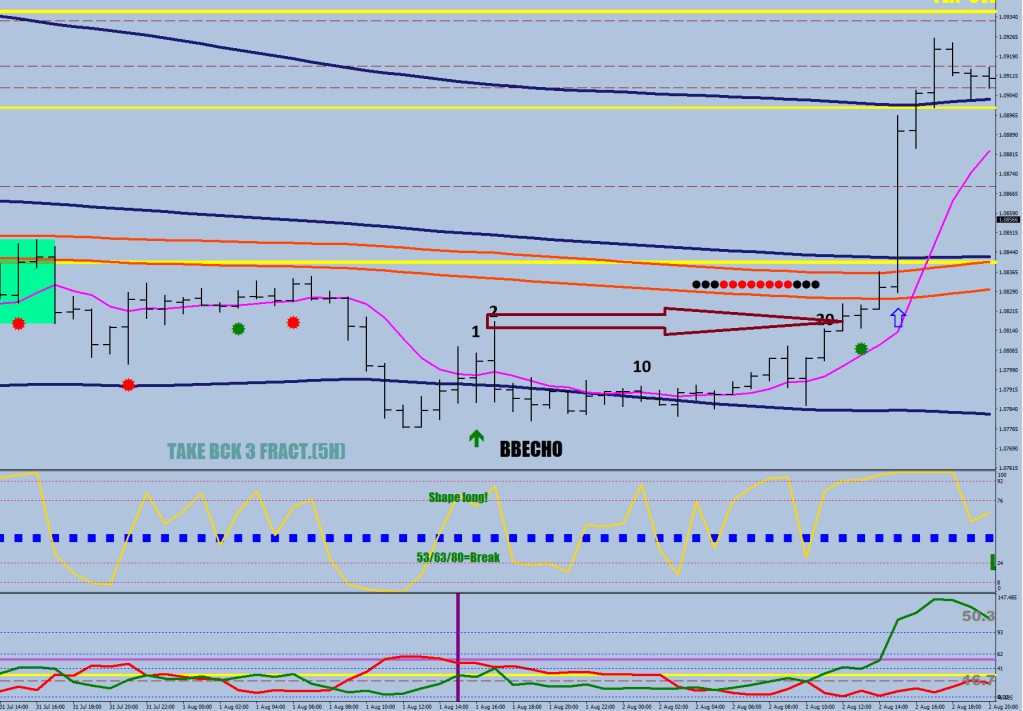
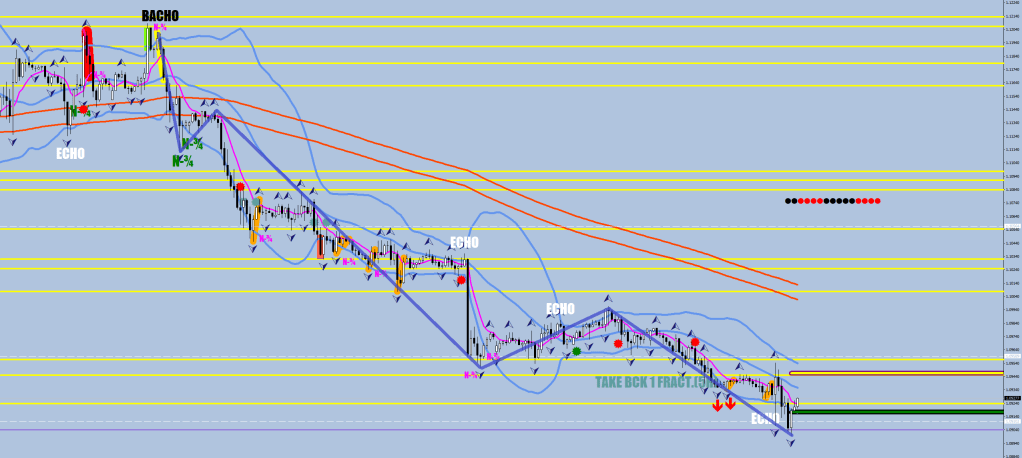
The Yellow Sun is hinting that there may be an Echo start pending in the next hour. That would leave a 10-pip moratorium field beyond the low that forms a fractal.
The dumbest thing I have ever heard in this life was this guy saying that time does not exist in the market. Tell it to someone who makes their living on Theta decay. What do you put on an indicator’s X-axis?
Sure, this has been asking for the ball for a while…
…but the 53-pip last leg was missing for a Shape to start an upside move.
You can always draw a line at a different angle.

As it turns out, volatility is the very thing you should be trading. The low is very, very close.

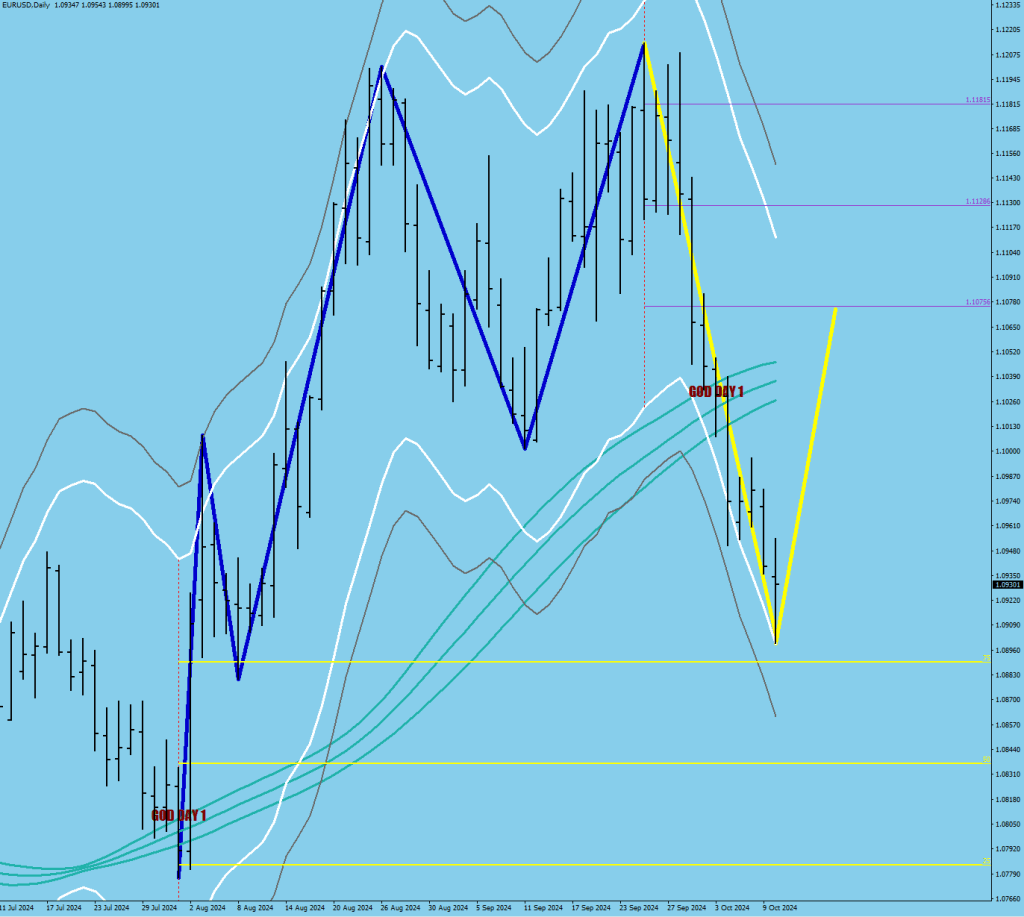
The bottom of the cover box is 1.0850 – probably gonna be missed. A double divergence is forming, the S-20 probably gonna get tagged next as a wave 4 up. Gonna be around 1.1030 tomorrow.
…only a matter of punching the ticket now.

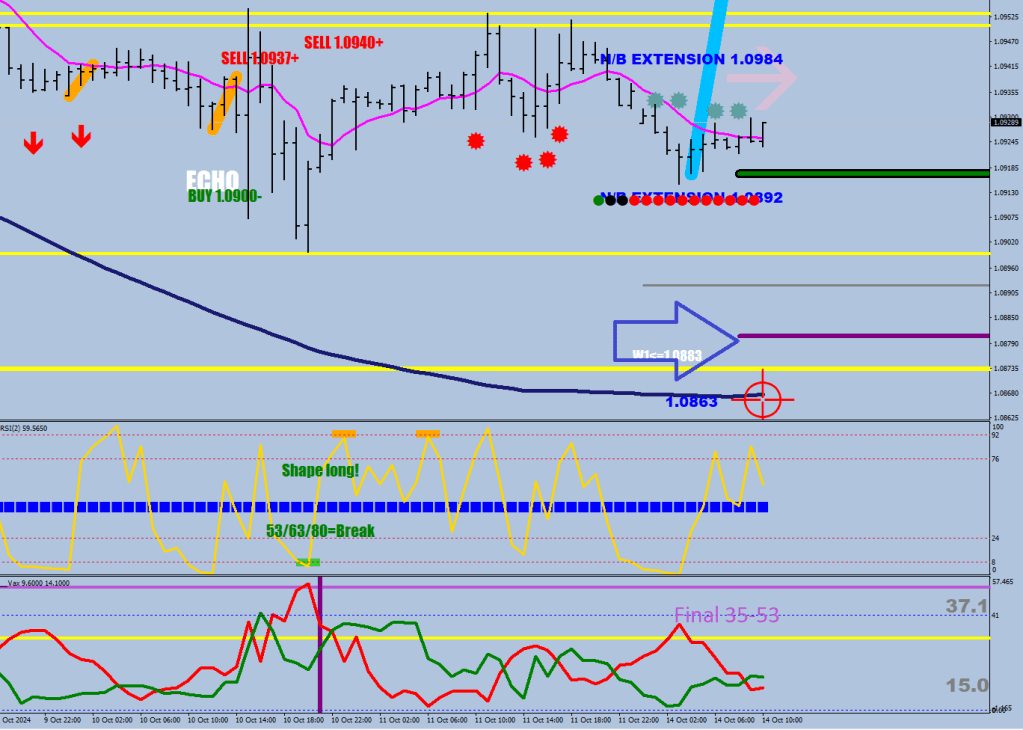
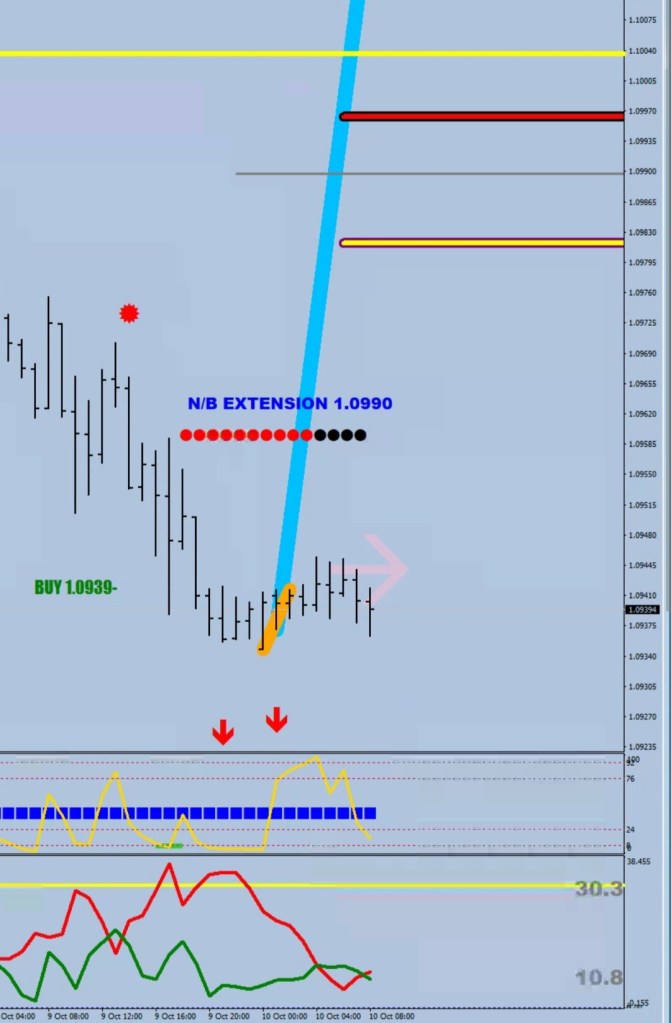
The answer to what finally brings on the turn. To be exact, a shape that makes a break at 80 pips.
That would mean 1.0980 if this shape were to do it.

Frankly, I don’t think that this is the Shape, since it is too high up from the 240 BB.
Some examples of how this happens.


Been trying to get the filters right.
 ///shape long
   if (ExtATRBuffer[i]<52 && ExtATRBuffer[i+1]>52
   && ExtATRBuffer2[ArrayMinimum(ExtATRBuffer2,10,i)]>2
   && ExtATRBuffer[ArrayMaximum(ExtATRBuffer,10,i)]<64)
A couple of albums are out this weekend.
…
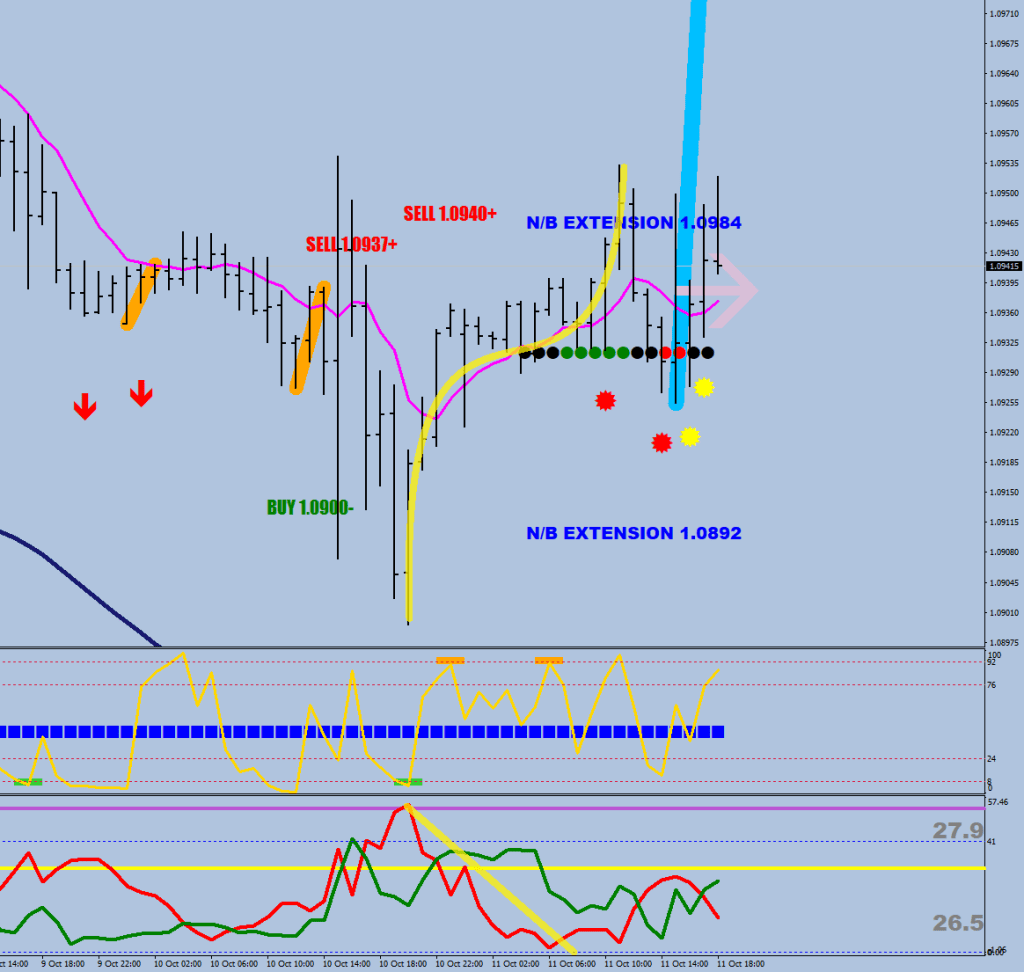
currently, the price would have to make a 52+ -pip 10-sample drop for the needed directional volatility burst to trigger the possibility of the next shape print. 1.0880-
tensharp[i]=iLow(symbol,0,iLowest(symbol,0,MODE_LOW,10,i))+520*Point;
if (Close[i]<iMA(symbol,0,240,0,MODE_EMA,PRICE_MEDIAN,i)) tensharp[i]=iHigh(symbol,0,iHighest(symbol,0,MODE_HIGH,10,i))-520*Point;So how do you become a Kai Volatility Supervisor?
You plot the volatility and you start staring at it. It is almost like a door supervisor. Trust me, I have a license for that.
You need to be staring at it until you turn purple or the volatility line turns on the purple marker (53 pips).
Then the coming volatility crush is likely to draw the “shape” without fail. A long play this one is.
Prior examples:

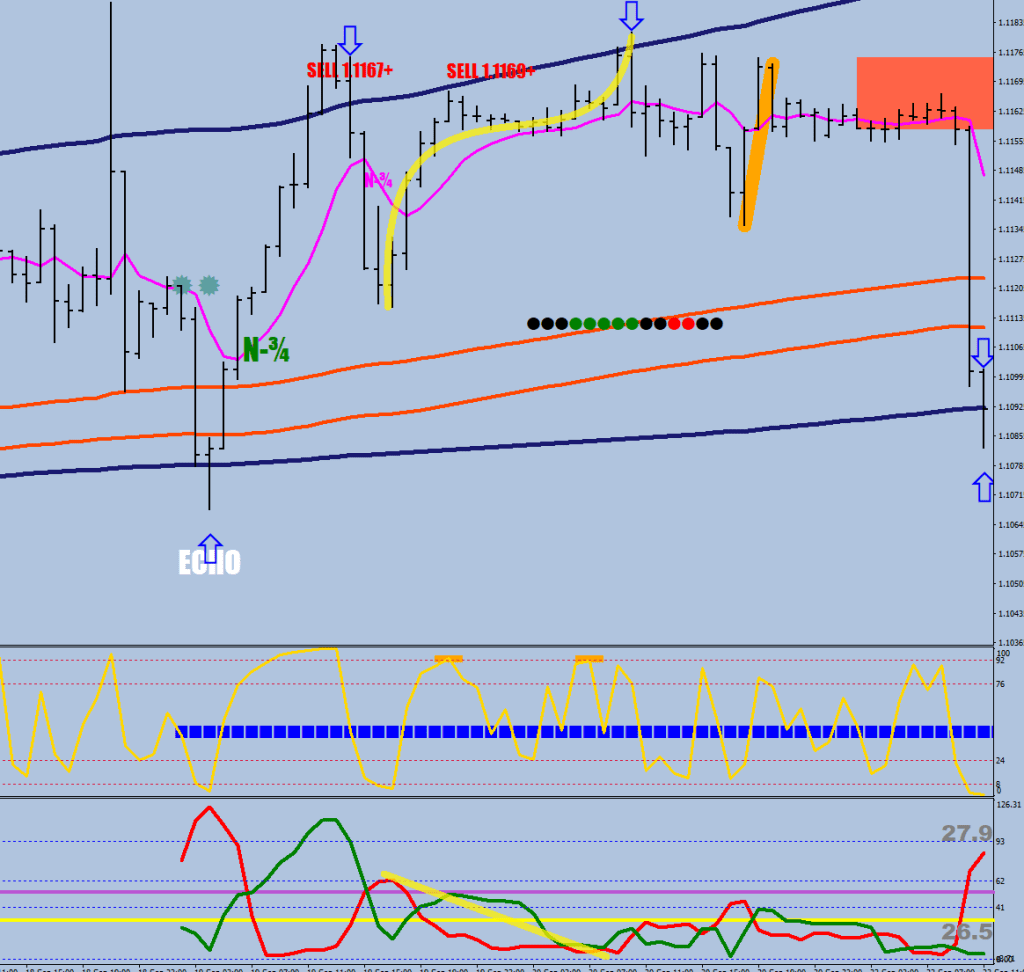
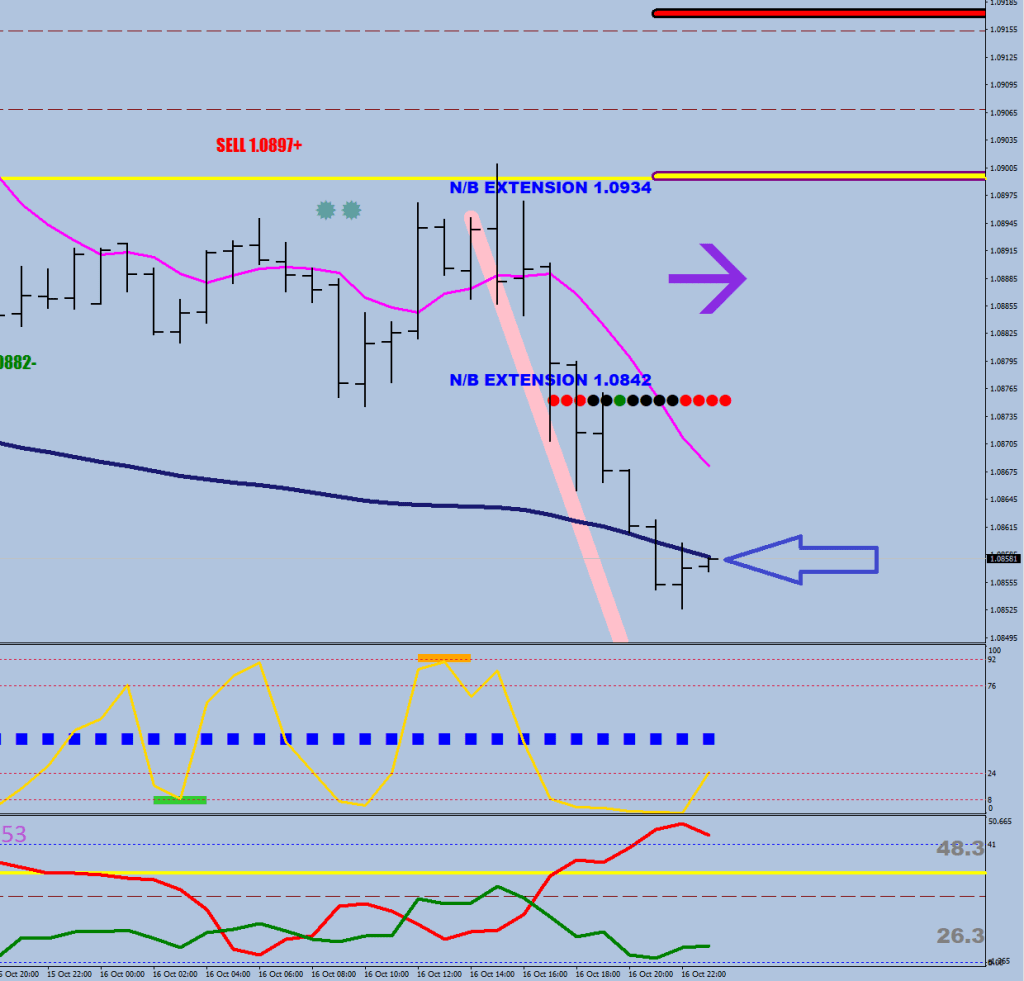
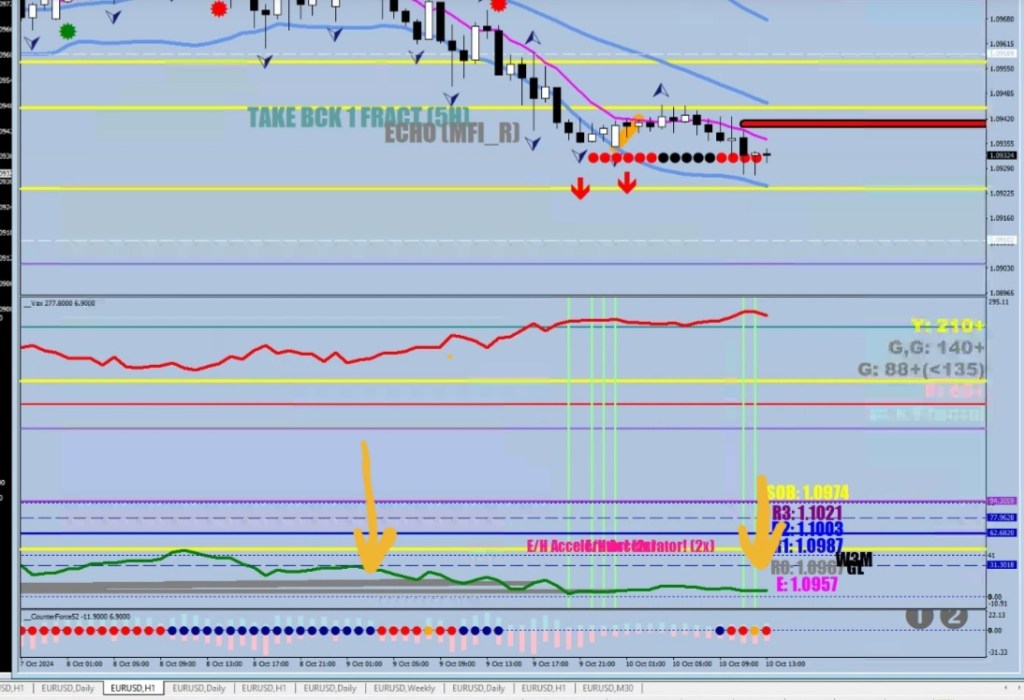
Now, as for some actuality, something fishy is going on. See, the SOB has only been violated today (blue marker). This normally results in a move down (bungee I call it) that is 70-86 pips, after the upside is failed.

Actually, it may just be printing an Echo on the upside. The only thing preventing currently is that the last hour wasn’t fully above the 8 EMO. The next hour could trigger an Echo plot if it were to make a higher high and close down 1/3 of the candle. At this point, I’m thinking of not going into the weekend unhedged.
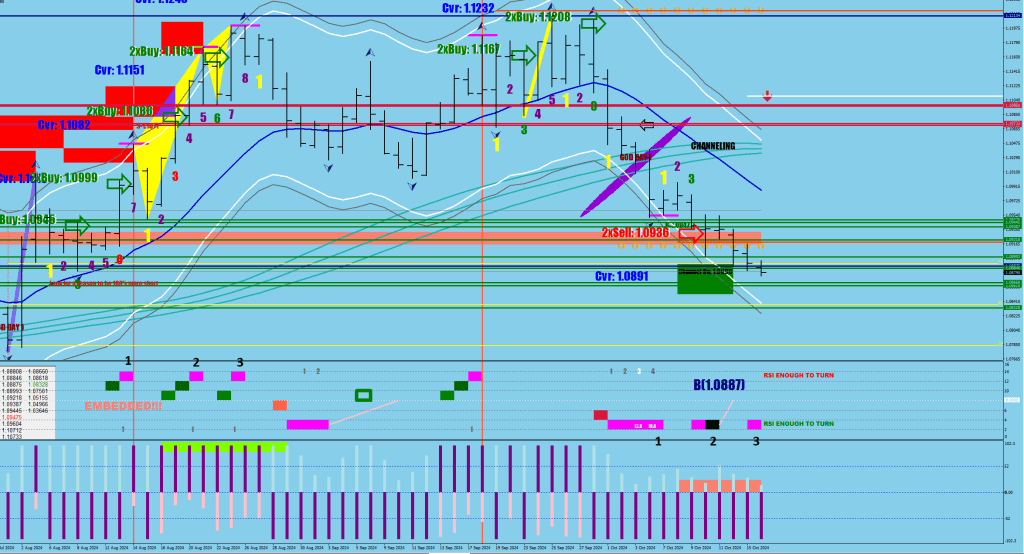
This was your 5 waves down. Now you should be looking for an ABC correction.
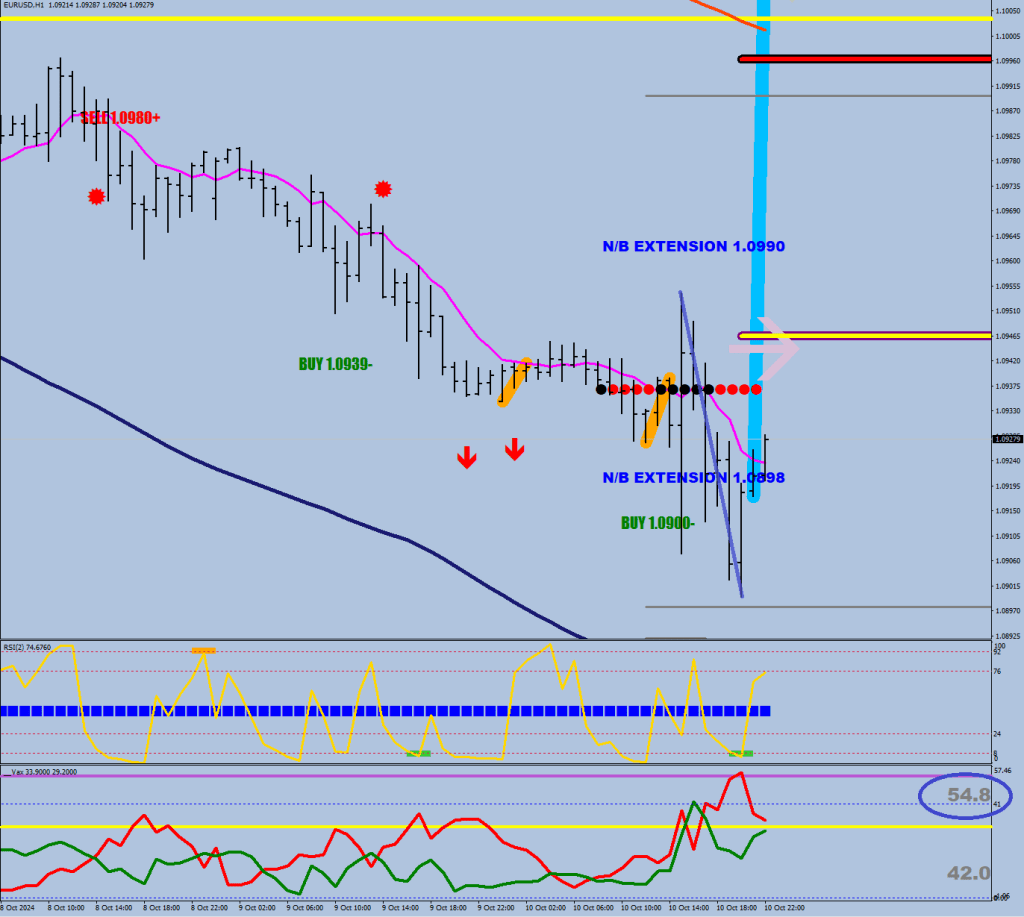
I said the last leg was going to be 35-53 pips? I was wrong. It was 54.8 pips long.
For sure, the E-9 is a plausible target (i.e. mean reversion).
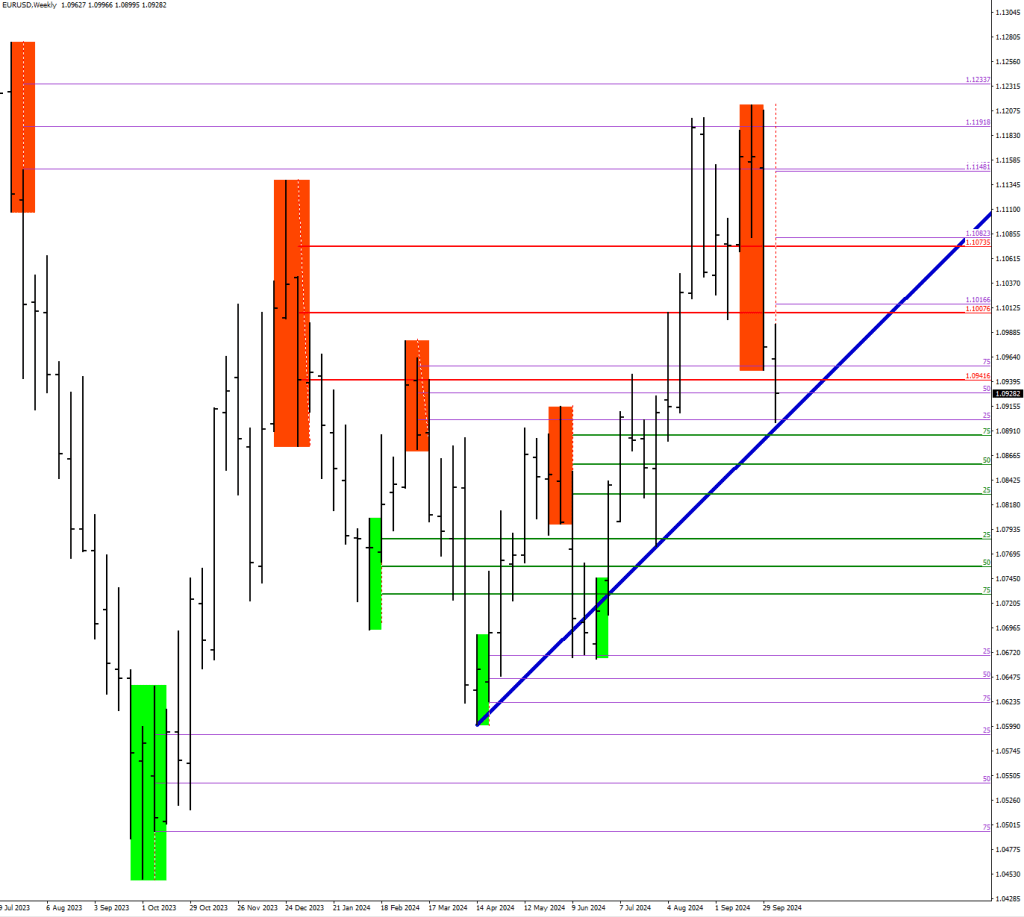
I still like 1.1075 for a maximum target on the upside.
Ok., make that 1.1060 then.

This is the main reason it is wise to keep track of the counter ditectional moves.
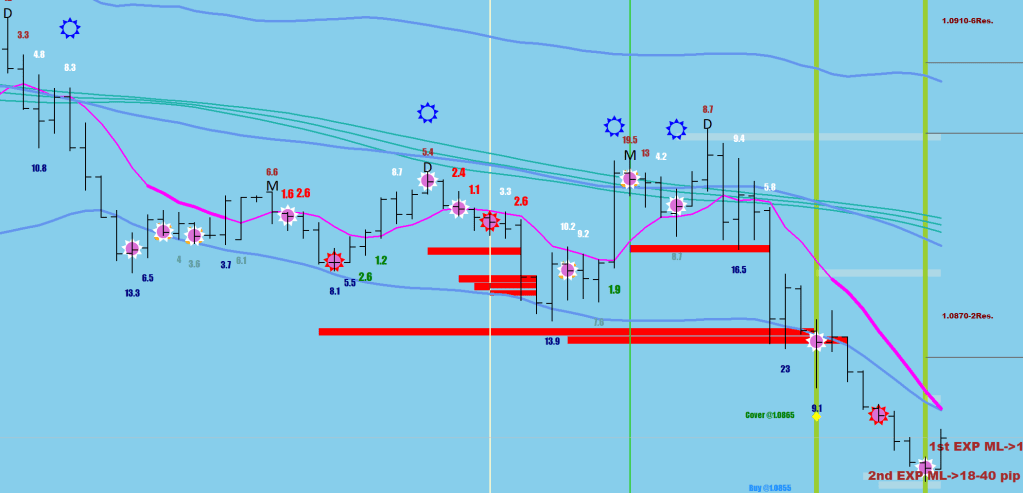
A wave 5 of Wave 5 slam dunk is to be expected 30-31 pips from the last low made.
The first arrow shows the last time this size of a counter move was allowed for.
I list the level as E.
The last leg dow should be 35-53 pips long from the E entry.
The levels are settled.
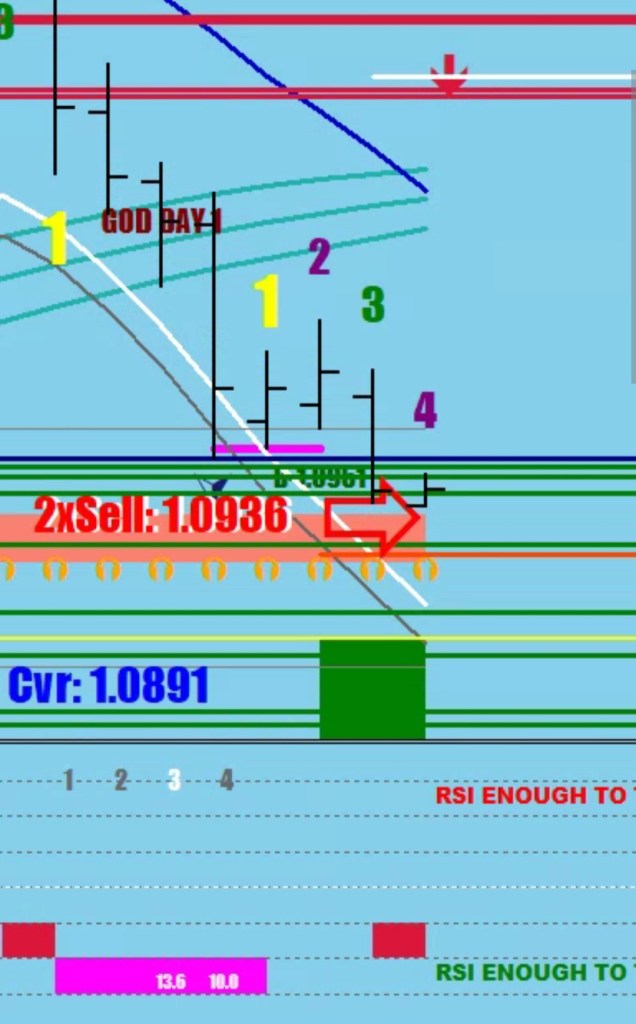
1.0936 -> 1.0891
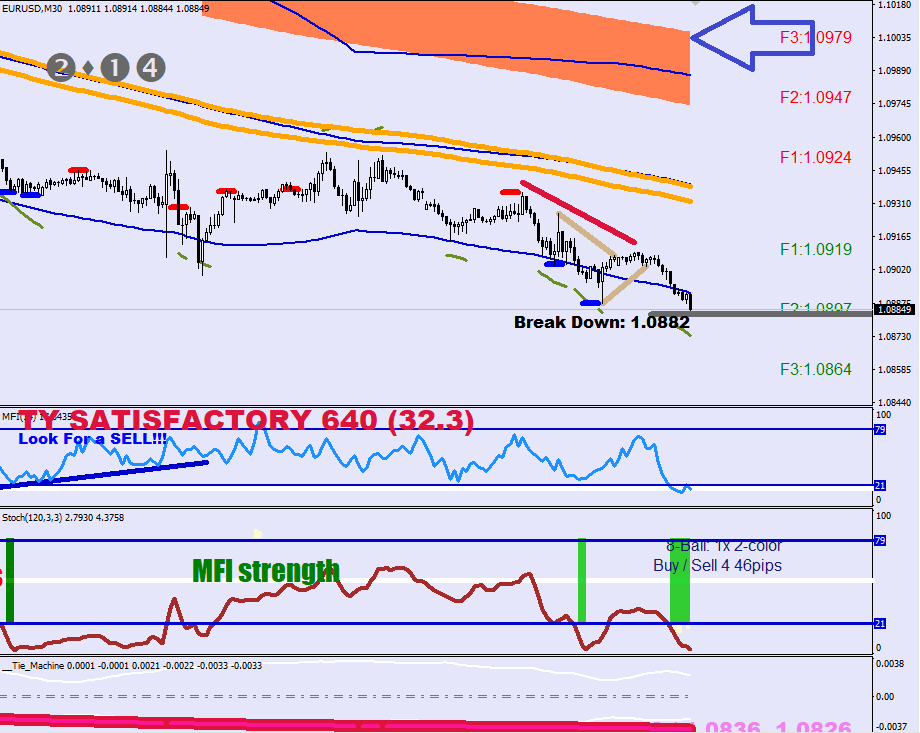
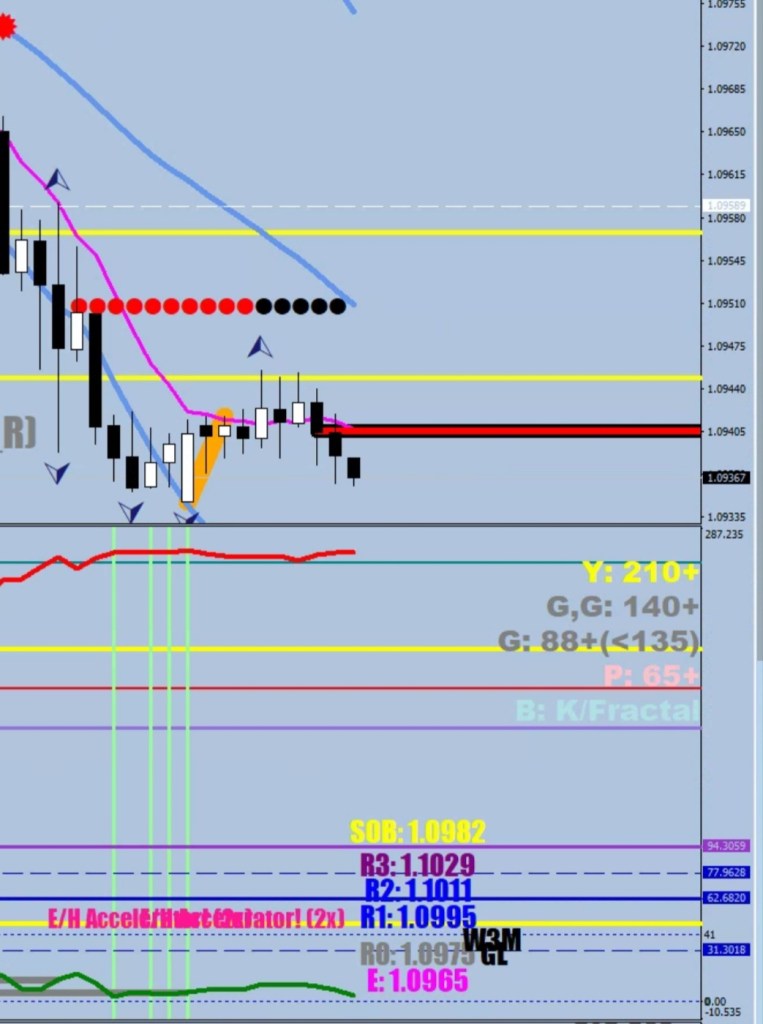
There’s the magenta-red RSI2 divergence is suggesting a bounce & the daily stochastic (4.5) is too low to be the last low, the same time it needs to breathe a bit.
The 1.0950 break hasn’t been backtested.
The gray divergence can be good for an 85-135 pip bounce.
The extra high energy reserves would be able to accomodate. The volatility cannot be compressed much beyond where it’s at. 3.6 – diverging from the 2.9 anchor point.
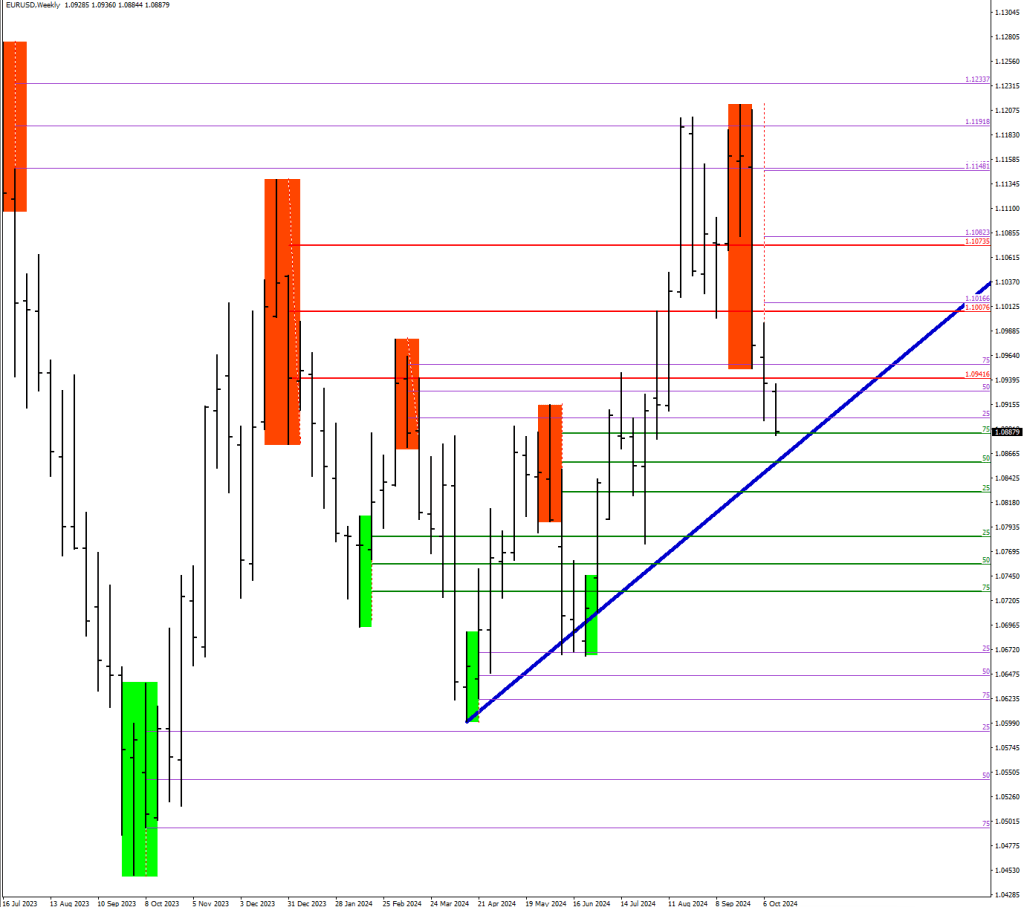
An impulse move does not end on strength.
The Measuring set a stretch value of 3.45x.

The Divergent leg would come in at 10-15% less, say a 3.1-3.2x. I set the gray band at 3.15 at which point Nick Rhodes should register a non-magenta divergence.
The multiple days of sideways has made the daily stochastic embedded, and the RSI2 reading was reset as well.
Do not mind the 2x sell and the CVR values currently, as today’s Day 3 of thr bow back and the daily close is going to settle these values.
