So here I’m thinking, there is a problem with the upside picture.
For one, this is a trading market, and the price has not back tested the 240 BB since it re-entered. The Echo print’s moratorioum line can be tagged, but a close above is a different matter entirely.
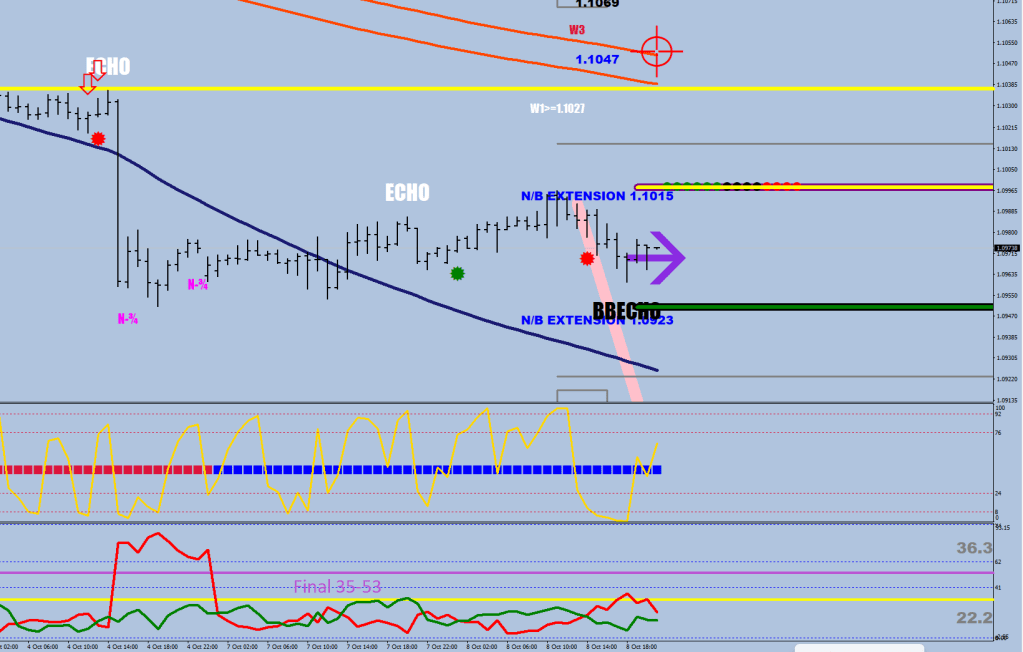
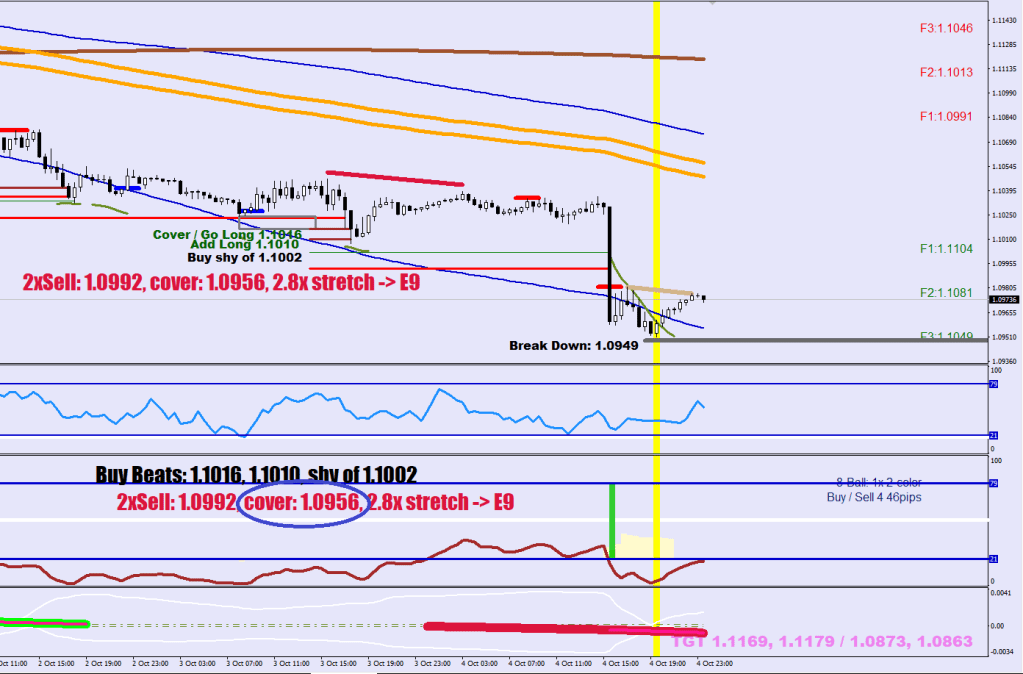
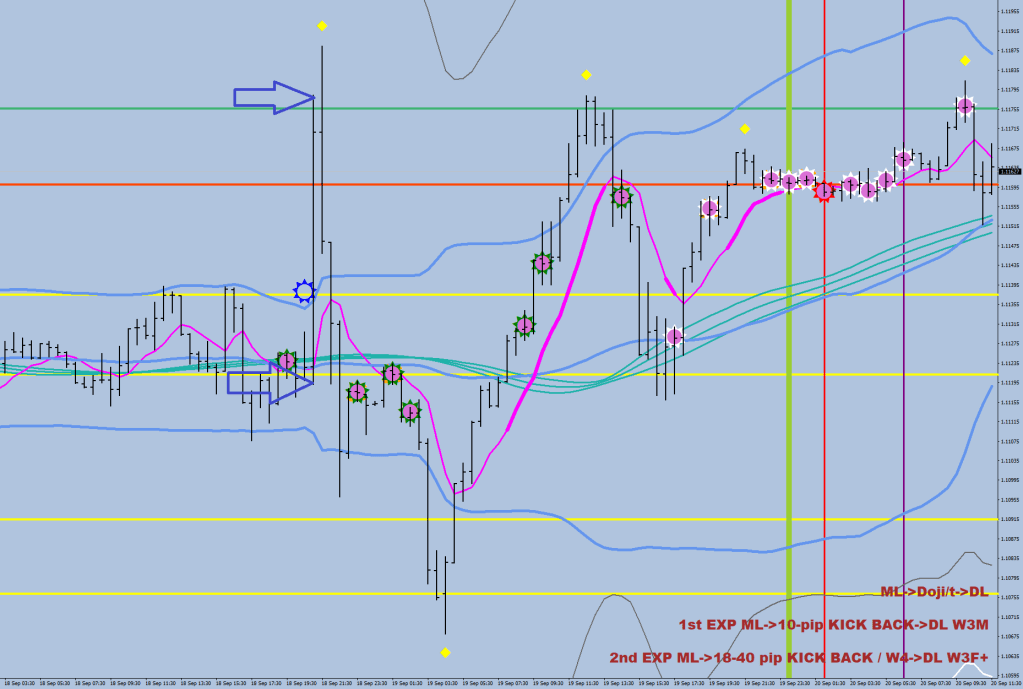
Above I’m thinking, good. That 2SD line is keep on moving lower.
I’m thinking next upon seeing the pending BB Echo print: dont’t count those ducks yet.
If the next hour takes out the low, the Echo print would get scrapped.
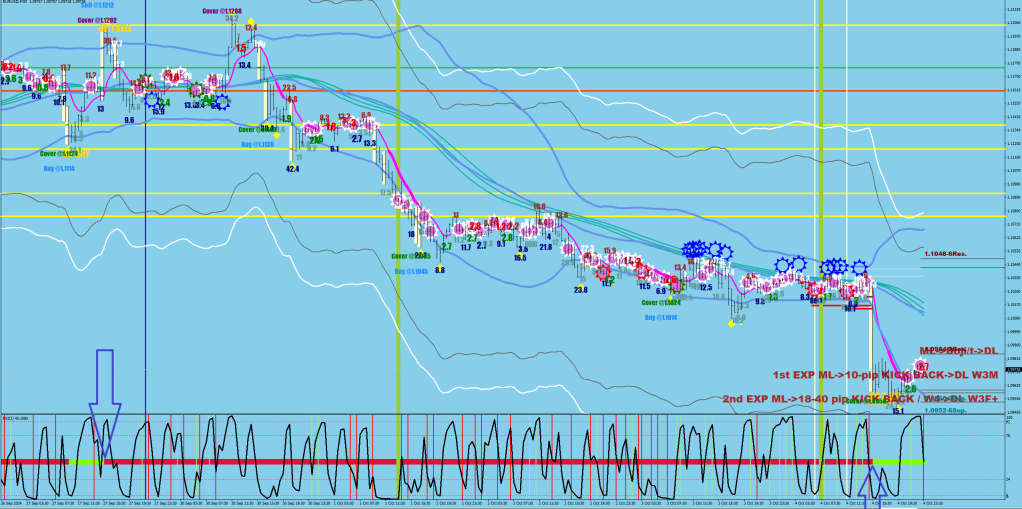
We’ve been in a trading market ever since the week started.
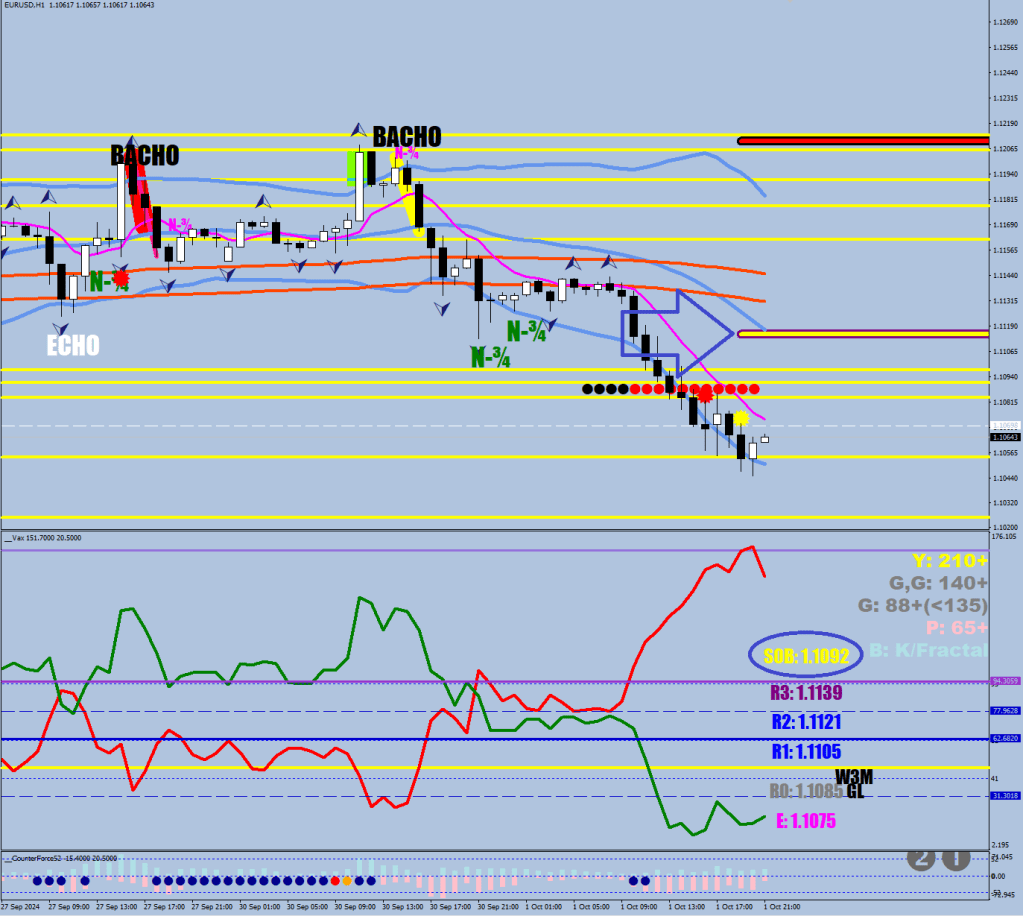
A trading market is a fading market. S240 to outside the BB and back (blue arrows).
I have a feeling that this track is going to make a new record on Udio, partly due to the subject partly because of the extra-fast rap. O-Position is still in the lead (all-time), but unfairly, as it gets slapped after every random listen.
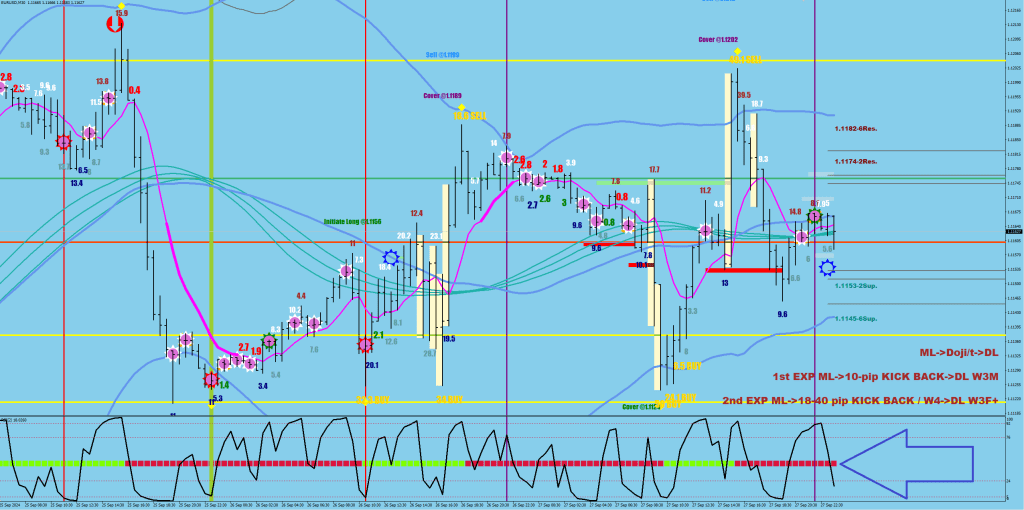
The manner of the return into the compression box is the difference between a trending and a trading market.
You need a big hump – 62+ directional pips within 10 hours.
Upon returning into the sub-31-zone, the new, trending direction would have to stay above the oppressed direction for a bit. I use the RSI2 reading for a bit of disqualification – and the oppressed side has to be oppressed all along (10 hours).
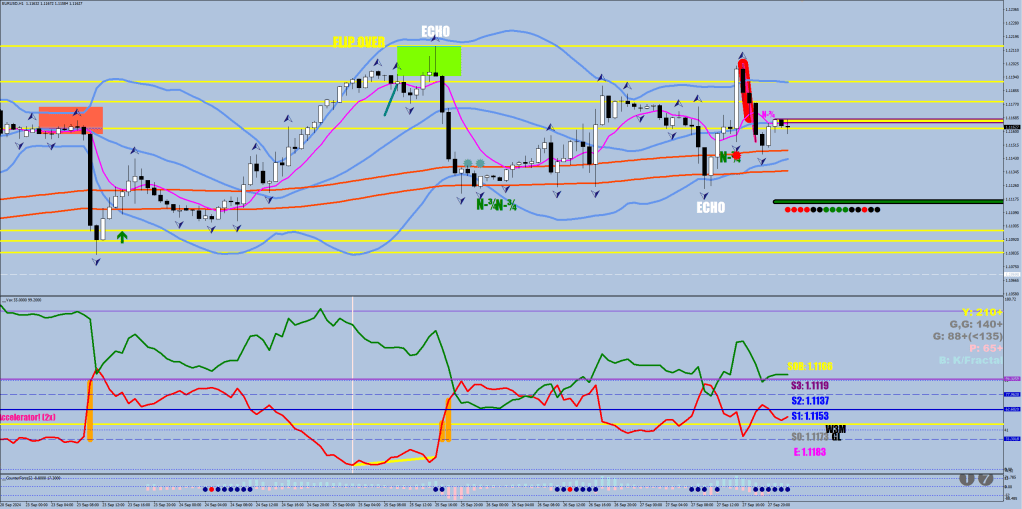
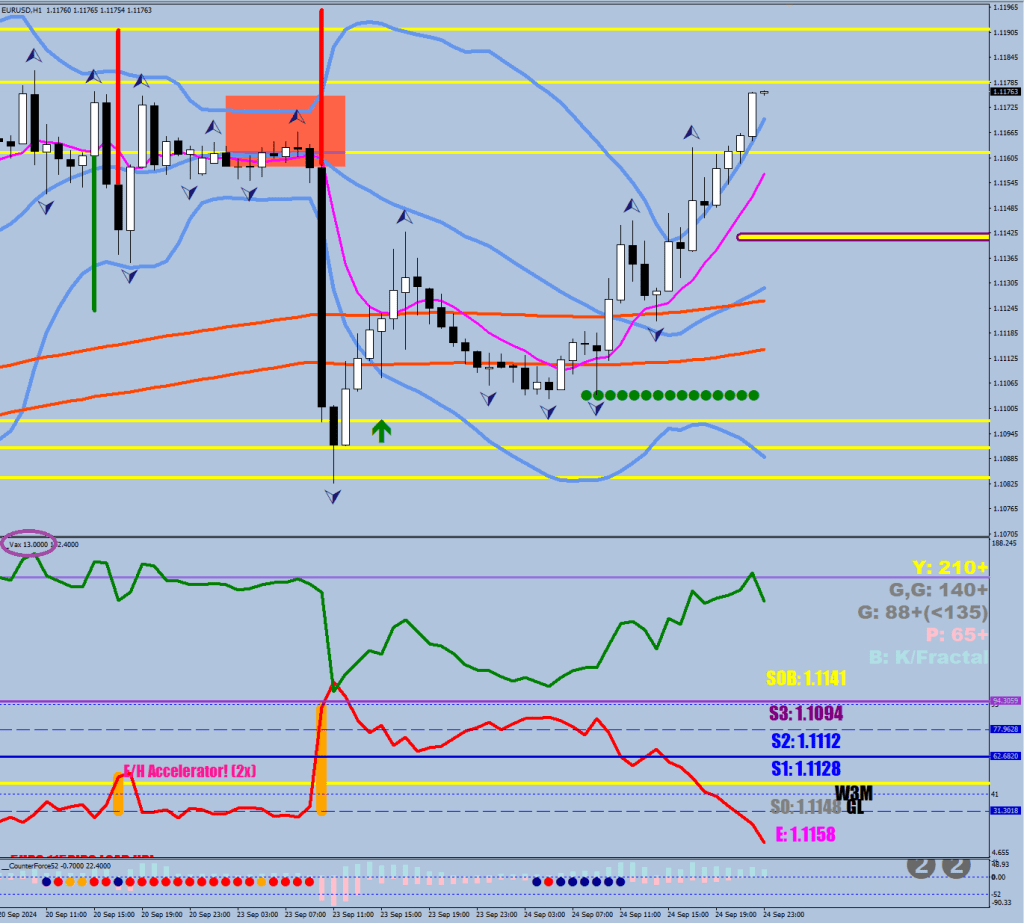
All systems go would be CF1 and CF2 of the same color and Trending Sell / Trending Buy approval from Vax.
CF1 has not changed, until an ECHO or a BBECHO print on the downside, this remains RED. In fact, a fresh ECHO print was made in the hour before the NFP reinforcing the signal.
CF2 has finally changed, it is now red with absolute volatility expansion breaches at over 49.
For the first time since the 1.12 top.
There is a gray volatility compression divergence,
They have utilized the Money Flow reversal zone’s breakout option.
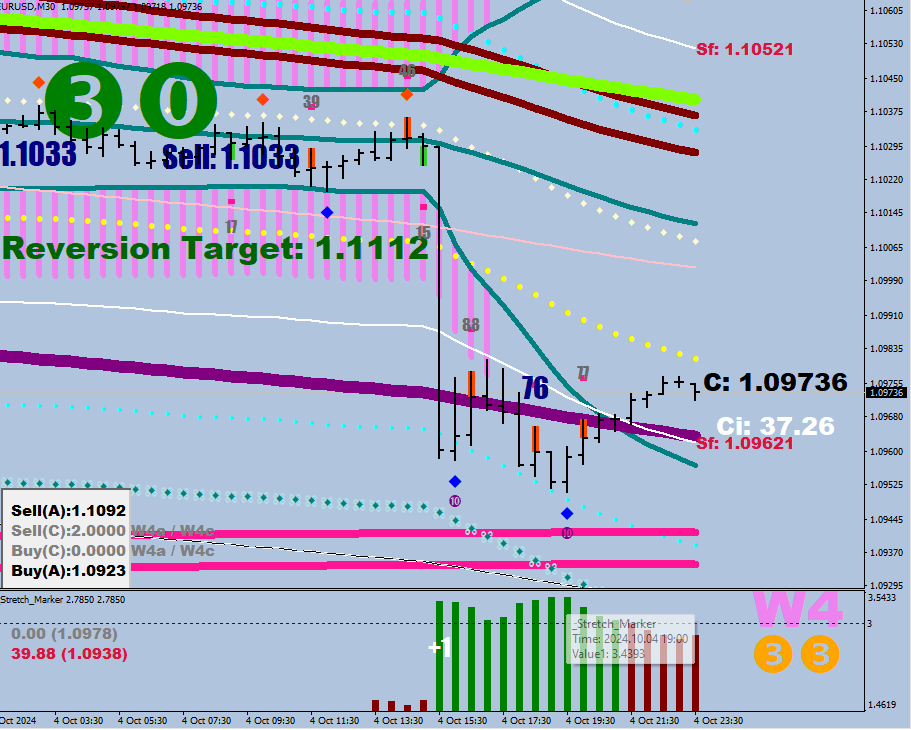
A 3.49x stretch was achieved, which could trigger a mean reversion to the daily E-9. It is going to be at around 1.1060 on Monday, moving about 20 pips a day lower. The bear’s game would be not letting the mean reversion play out by shorting about 40 pips lower than the E9 of Lows.
The Swing High has finally been printed, and a continuation could come 40-56 higher than this week’s low (typically 53/56 pips) which would put the price back at 1.10 at some point.
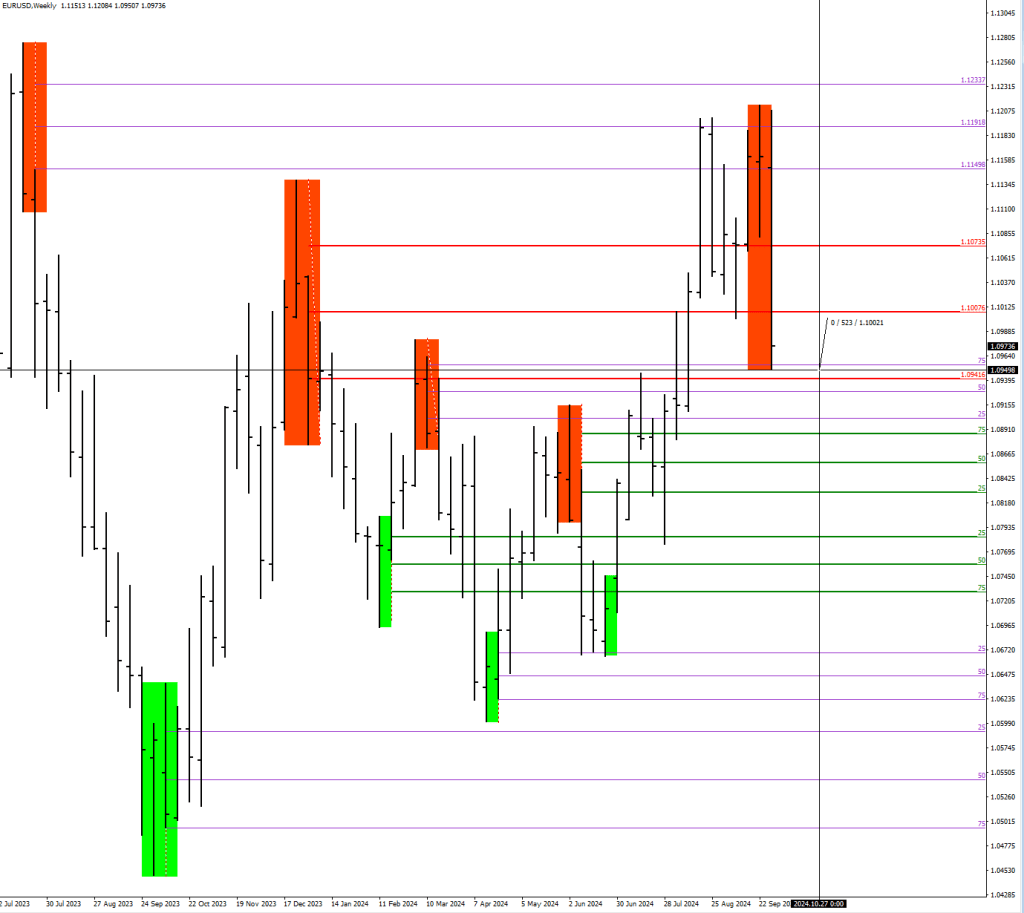
One last remark is that the daily stochastic reading is too high for today to be the swing low. It was at 13.6 and the optimal range to hit is 8.5 to 4, but of course, this Oscillator is bound to move lower, but typically a lower low is in the cards before a move back up.
1.1008-1.1017 is the optimal zone for a bear to reload.
In the meantime, I made a Synth album to listen to.
Trading is a never-ending learning curve. I have felt a million times in my life that I had enough edge to make money indefinitely, then the market throws something at you have never seen before. You must evolve.
There are these textbook nonsense ideas about what is a trend. You cannot call anything a trend until you start measuring for volatility compression. That is what my Vax tool is for, but some oscillators like an RSI2 HL2 can be also used for further confirmation. Yup, continuous buying/selling hits close to home.
As Benjamin has pointed out, there’s always a higher timeframe that would be against the narrative you are trying to vindicate. This higher high higher low definition is pure nonsense. By the time you identify a matching pair, the flag could be over with.
Forget the fractal nature, as a trader you would never need to go beyond the 1H metric – or below 30M for that matter.
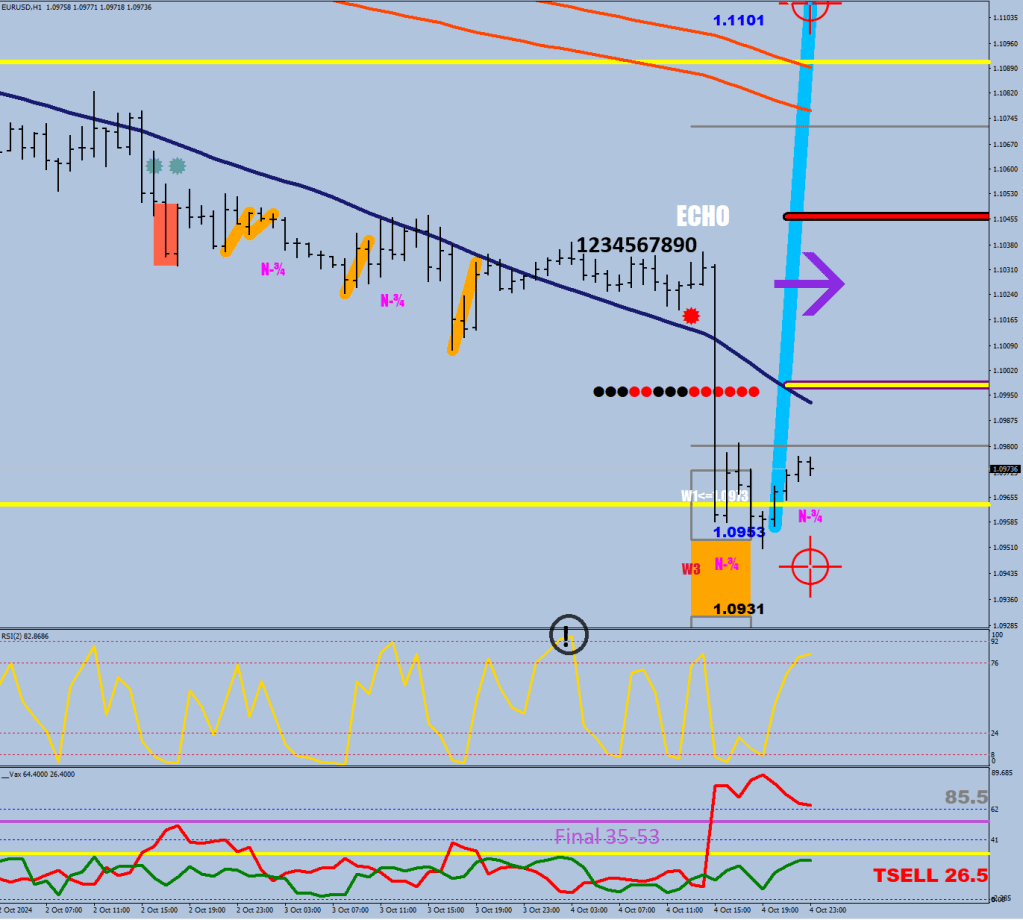
A EurUsd trending market is without counter-directional moves sustaining for more than an hour (2 candles) beyond 31 pips and having done this for at least 10 hours. The confirmation is when the RSI2 is unable to penetrate the last 10% of the full range.
Here as soon as you could call a trend the trend gets called off.
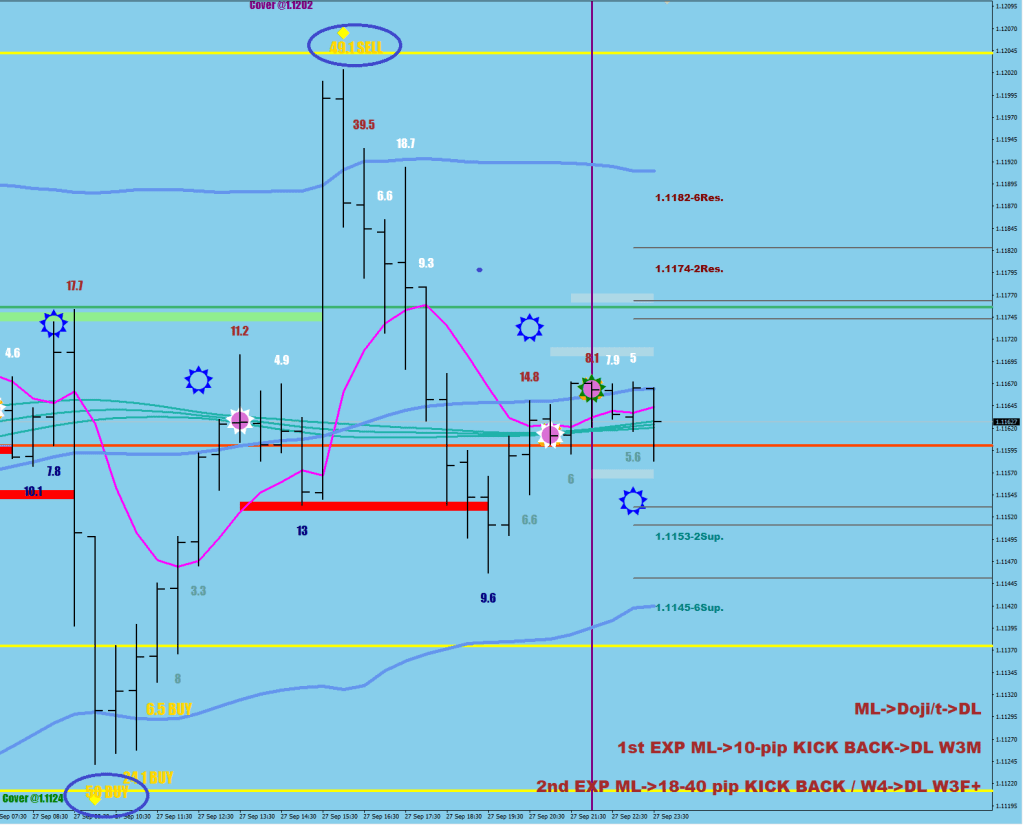
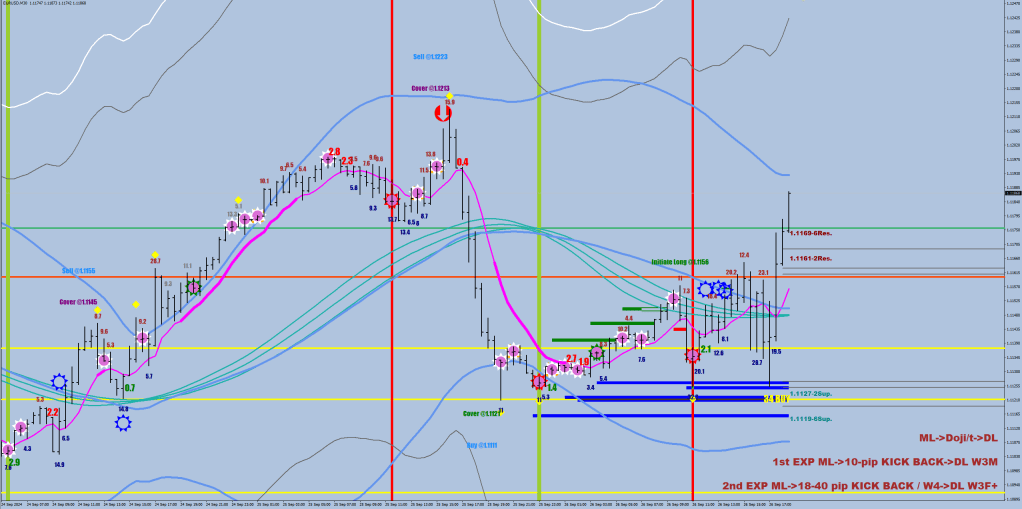
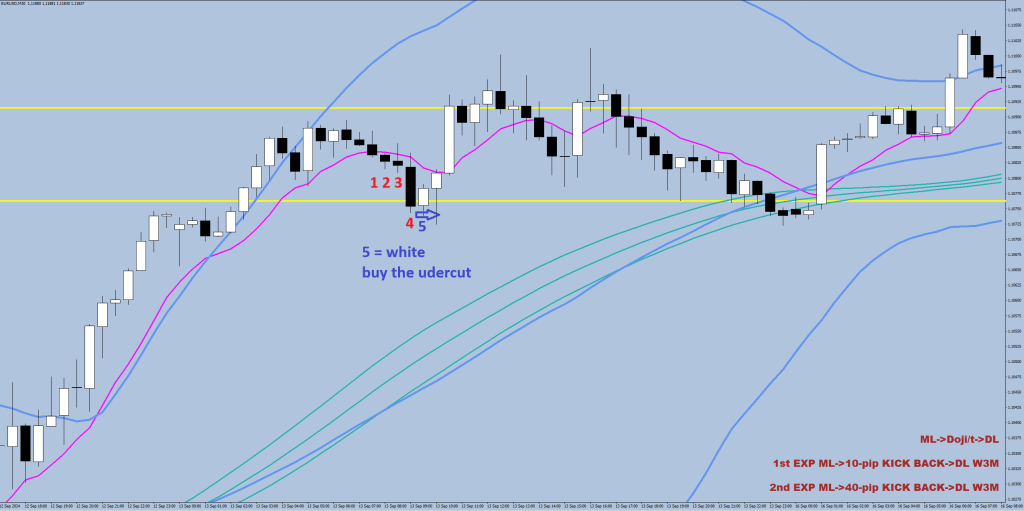
Understand how black and white this is: once the Expansionary Measuring Leg has printed, there are two options: they get in within the pullback not exceeding 13 pips for a wave 3 up or they let it slide back and close by more than 15. If the latter happens, you have to scale back in your short hedge with the back and fill and slap on some extra to make it worthwhile.
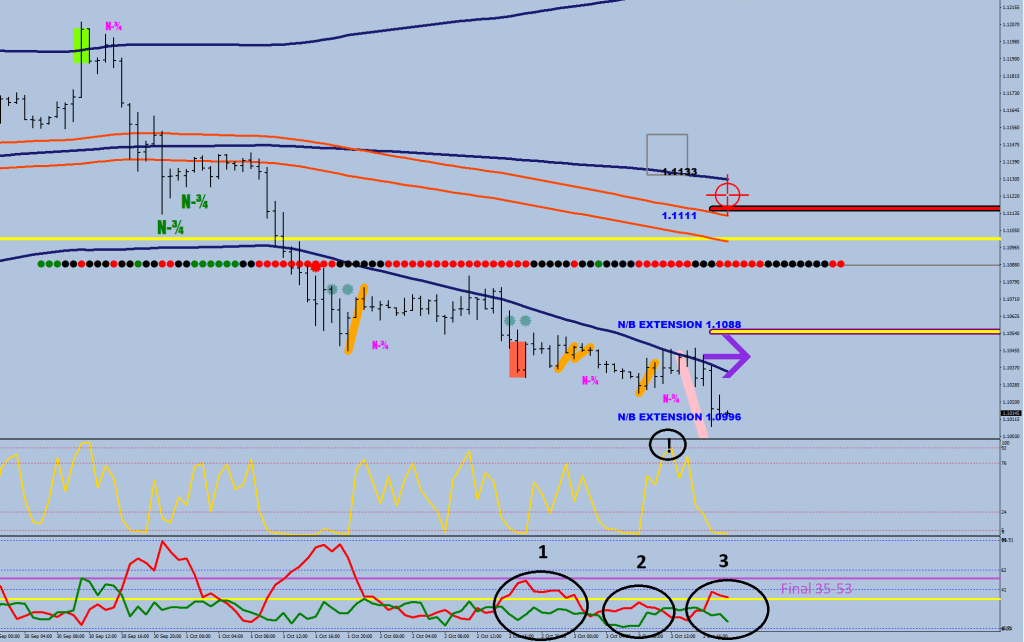
Buying the kickback or selling EM1 failure. The yellow diagonal shows the EM1 failure’s kickback – scale in there, pip by pip (10-13 pips again – how interesting!).
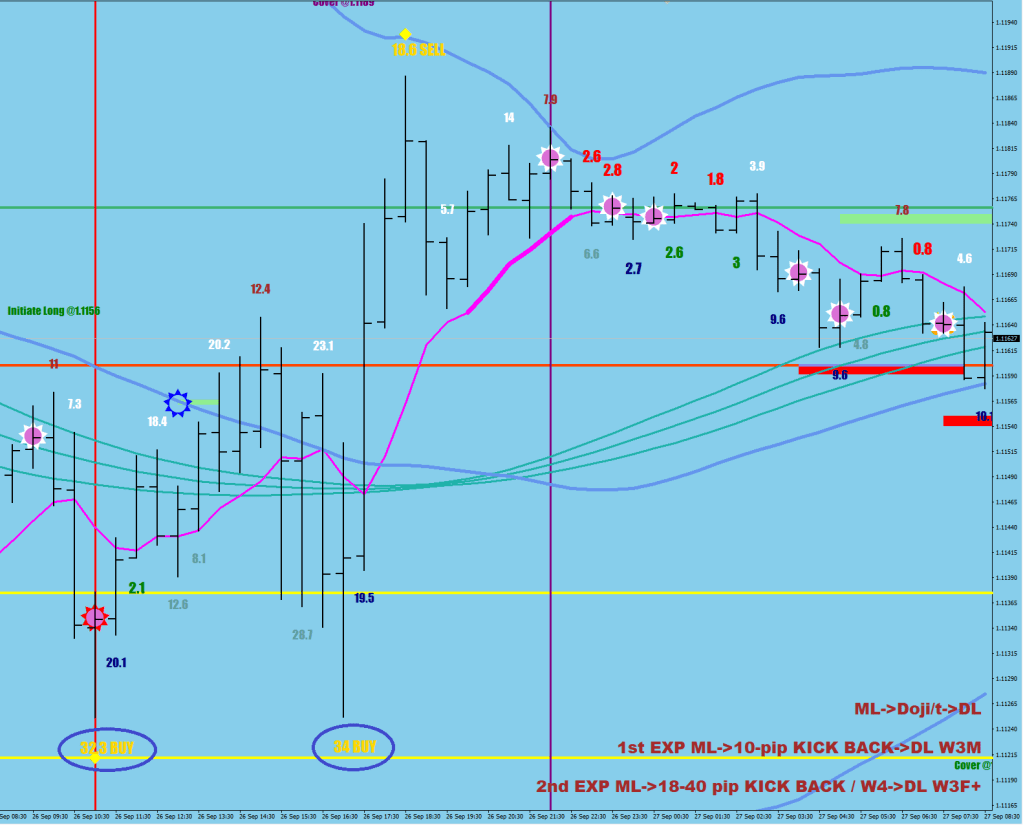
As you can see, if an RSI2 90 (or 10) print happens at the beginning of a trending move, it cancels it whilst appearing after prolonged trending, and it triggers the last, capitulation move.
The last leg is normally 35-53 pips long.
On the upside the 3 legs had a rather similar look – in the opposite color.
When I say, I am a music producer, do not think I am a rapist lacer that is kicking females to shreds.
As for the Wave 2 up, 1.1076 is option #1 and 1.1129 is option #2
I can tell you how things work for real, but not sure what you are going to do with it without plots and proper indicators.
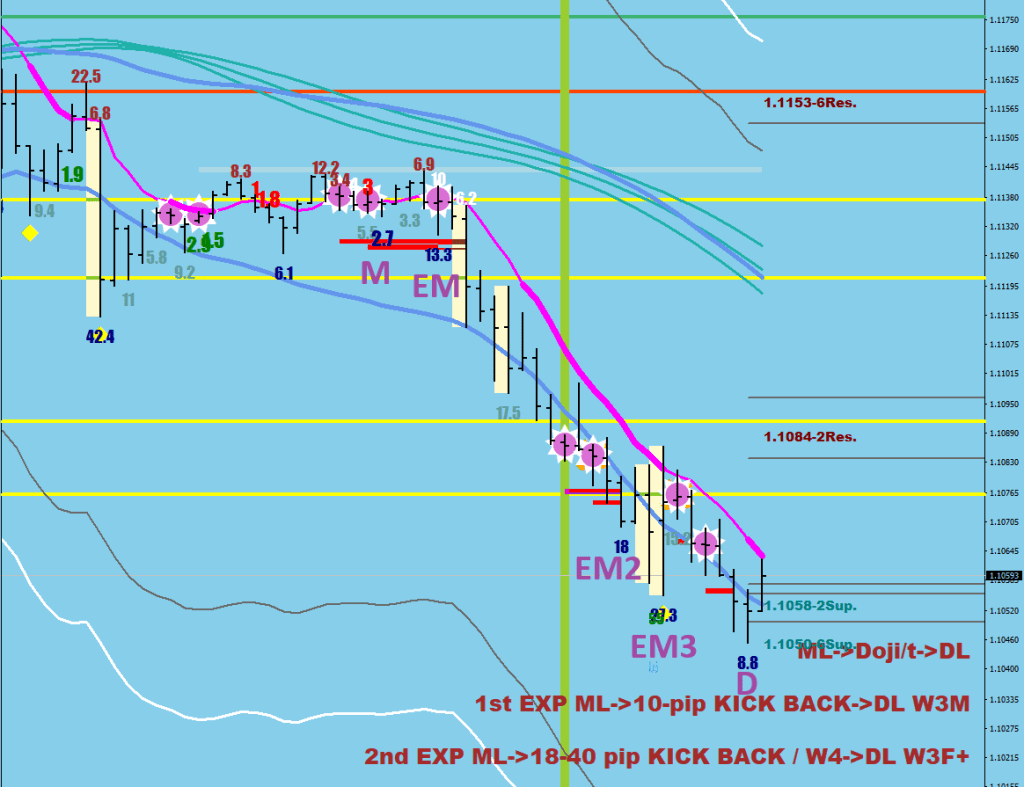
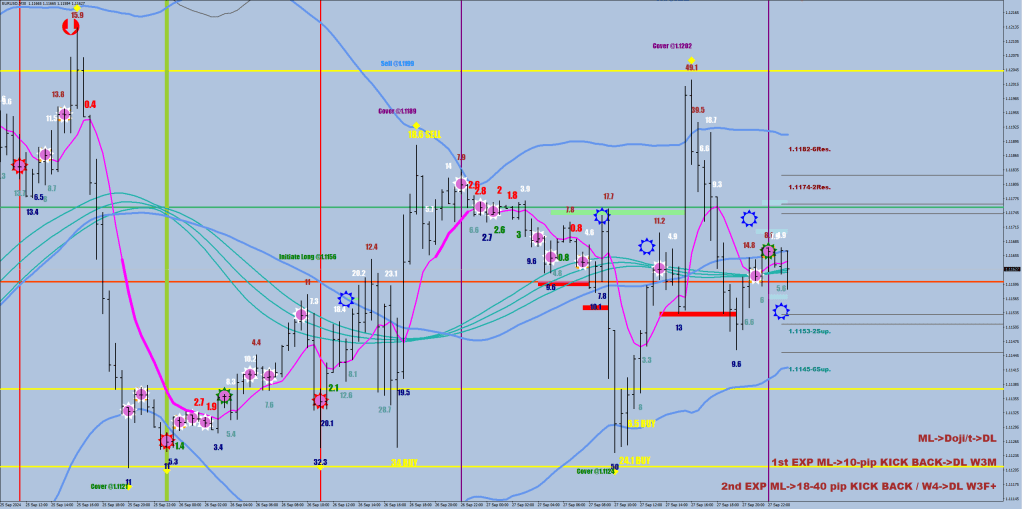
First, get used to the letters. M stands for measuring leg, the EM is an Expansionary Measuring Leg (override) and D is the Divergent leg.
The brown diagonal line is the 10-pips kick back of the EM on the downside that started this prolonged move down.
Yes, this wave is complete to the downside.
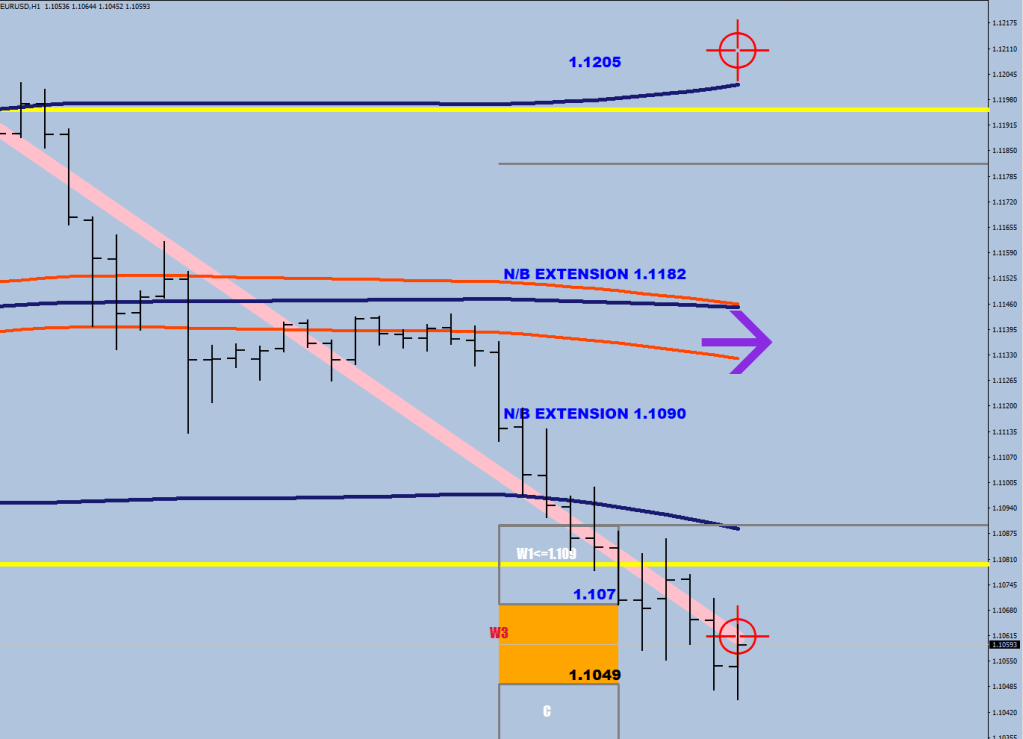
Now, why did I text to my coworker today at the open that this could come down to 1.1050?
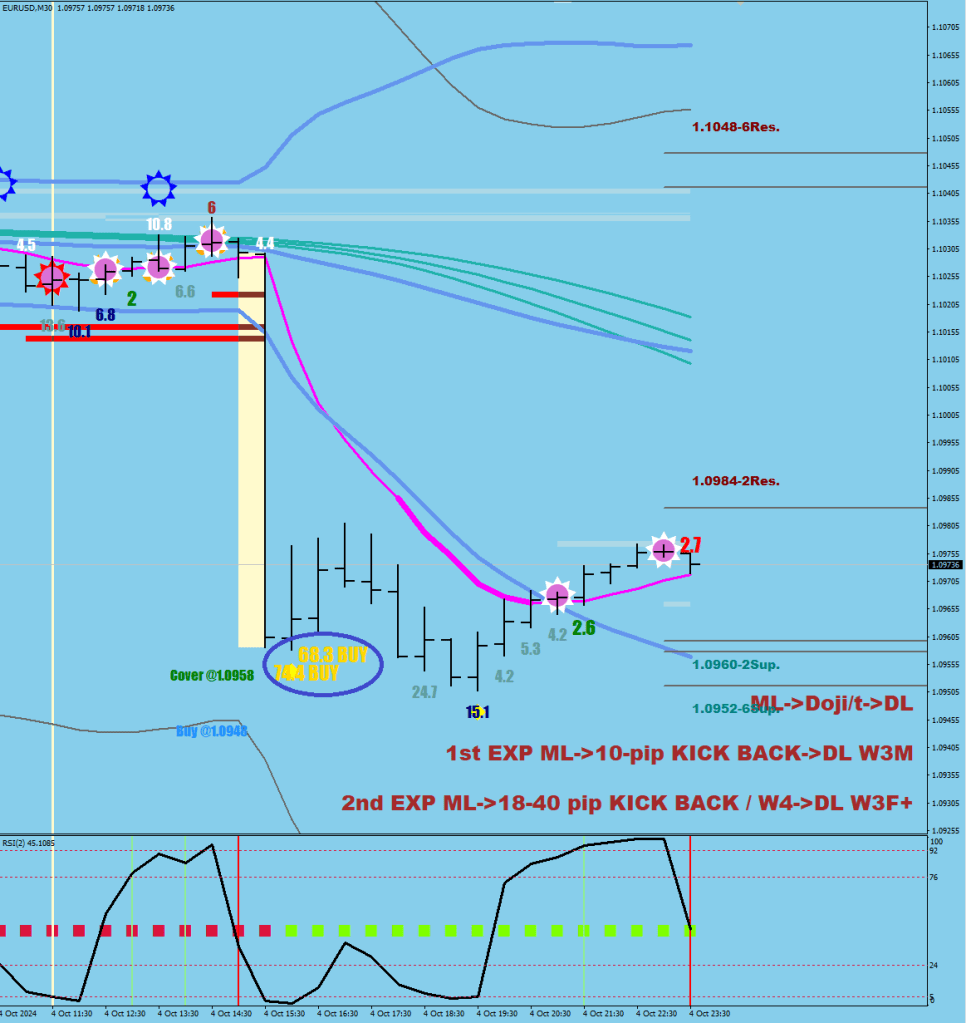
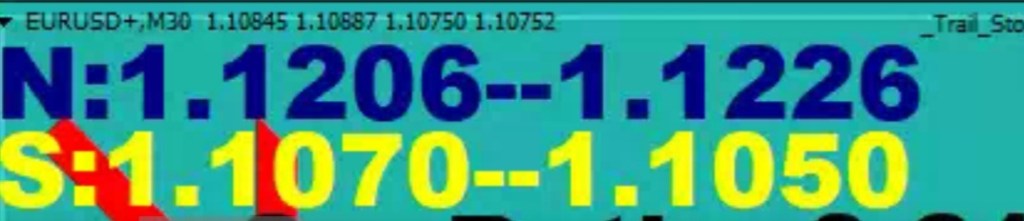
These were the levels to work with based on the last condolidation mean:
These numbers I refer to as W3C(close end) for the first number and W3F(far end) for the second number. M would be the middle.
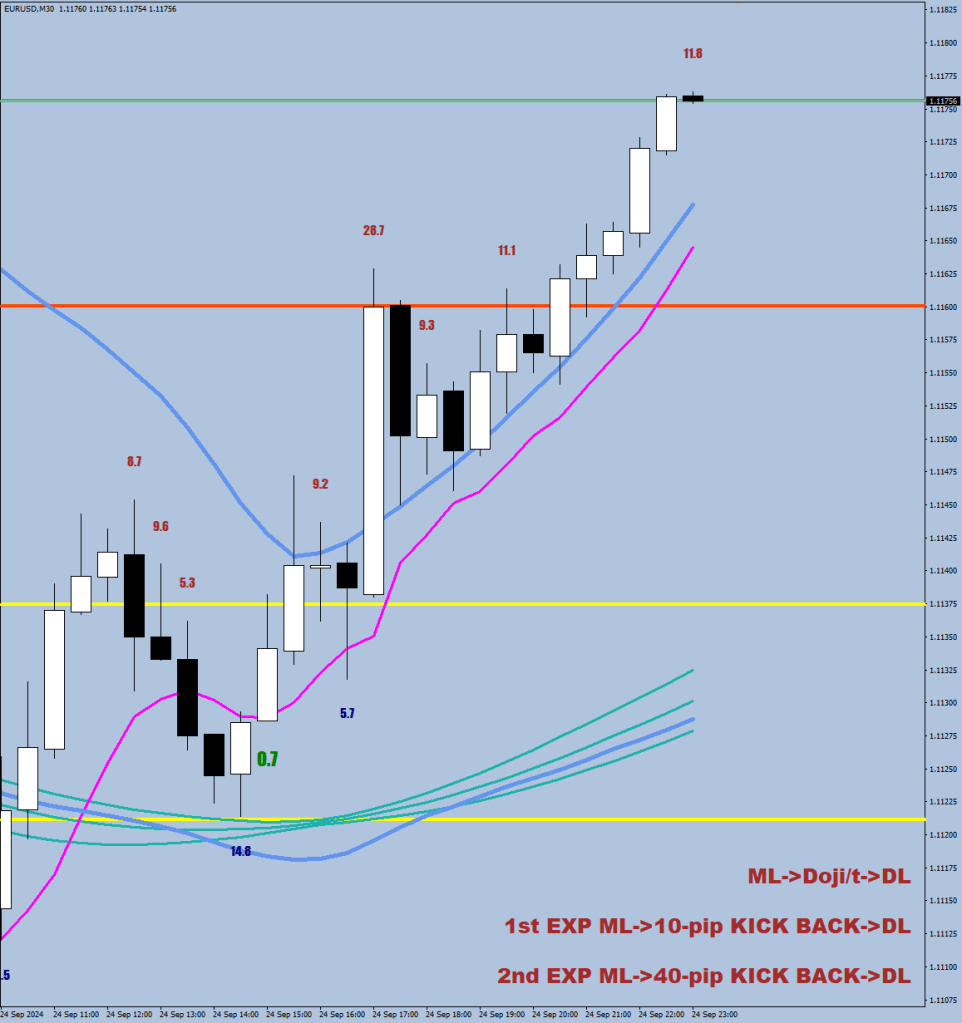
When you get a follow-through (up to 13 pips kickback bought) of the EM, you are in a Wave 3.
If you are the visual type, the orange square is the likely target area (bell curve).
This of course is carried over statistical knowledge.
As for finding the consolidation mean, I would use 12-sample CI on the hourly, but for better accuracy, I have actually reached after 15-minute data and half that candle to find the value (48-sample of course). A cross-over above 53 is considered a full charge and 65+ would mean an extra high charge.
I know, this has nothing to do with Inner City Mama’s lectures.
Now to provide you with some garden variety trading stuff, here is the latest Shapiro.
& I have a tendency to pull out my remaining hair every time I hear about Umar Ashraf and his Tradezella.
Who are these people, what do they want and why don’t they just roll over and die???!
EML1 failure (kickback >15 pips) scale in – TGT 50 pips (not preferred near the E50) EML2 kickback 18, 28, 38 pips size based on control functions alignment TGT 50, 60, 70 pips
…
A Wave 4 up would break above the SOB confirming that the volatility compression program was turned off (allowing) for a pullback greater than 31 pips. A Wave 5 down would likely print a lower low, but not necessarily by much.
The second way is staying within the bands, but exceeding 32 pips (fluctuation size).
if (uvol[i]>49 || (uvol[i]>32 && High[i]<iBands(symbol,0,60,2,0,PRICE_MEDIAN,MODE_UPPER,i)))

if (dvol[i]>49 || (dvol[i]>32 && Low[i]>iBands(symbol,0,60,2,0,PRICE_MEDIAN,MODE_LOWER,i)))
The third way (A & B version) is when the first candle of the diagonal exceeds 22 pips and you get a new 6-sample high or the first low of the diagonal is outside the bands.
if (High[i+3]-Low[i+3]>220*Point && iHigh(symbol,0,iHighest(symbol,0,MODE_HIGH,2,i))==iHigh(symbol,0,iHighest(symbol,0,MODE_HIGH,6,i)))

 if (High[i+3]-Low[i+3]>220*Point && Low[i+3]<iBands(symbol,0,60,2,0,PRICE_MEDIAN,MODE_UPPER,i+3))
Tadaa… new directional logic. Almost entirely based on volatility surges.
When they turn off the buy/sell program, the market – for once – gets a free, balancing move.
It is highlighted by my pitstop dots here. The 3rd close below the 8 EMO gets a red dot and happens to be the end of the first leg of the V, then the counter move does the same thing on the other side with the 3rd hour’s green dot being the end of the V. Of course, there is a larger version of this in the daily chart. A true market clash, a calibration and possibly figuring the right volume/distance for the next compression act.
I currently only have a pimped-out Doji version here, sorry for that. The idea of 2 and 6 dojis back provides some context for plausible support/resistance starting where. Just comment out whatever you don’t want to be plotted.
D = Divergent Leg (drop of directional volatility)
Next should be an M+D on the downside. Not certain that the price would be let beyond the SOB at 1.1141.
However, in the next leg up, the Red volatility line would be compressed below 14 (pips) and a further push higher would have to set up a Gray divergence for a peak. The brown bow is my idea of how the measuring leg would print.
…below 14 print, managed it on this very leg
After an E-M the expectation should be a W3M print. Why? Because if an E-M gets broken, you are likely in a Wave 3.
About halfway through these two numbers (W3Close and W3Far):