Ira Epstein used to say that the market is always trying to sell you information.
What did I purchase this week?
Something about the importance of the squeeze.
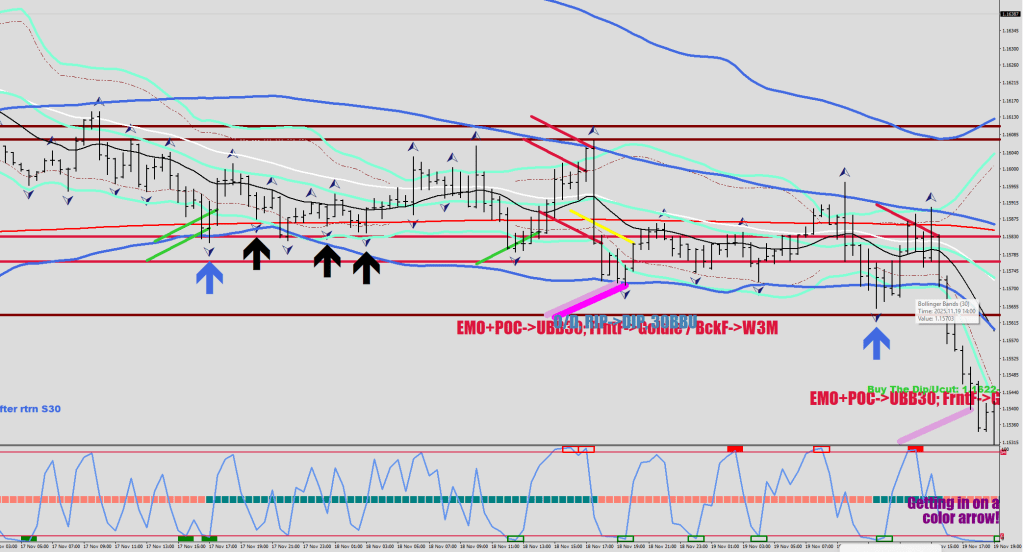
As you remember, I have a plot for a “quick dip” outside the BB120.
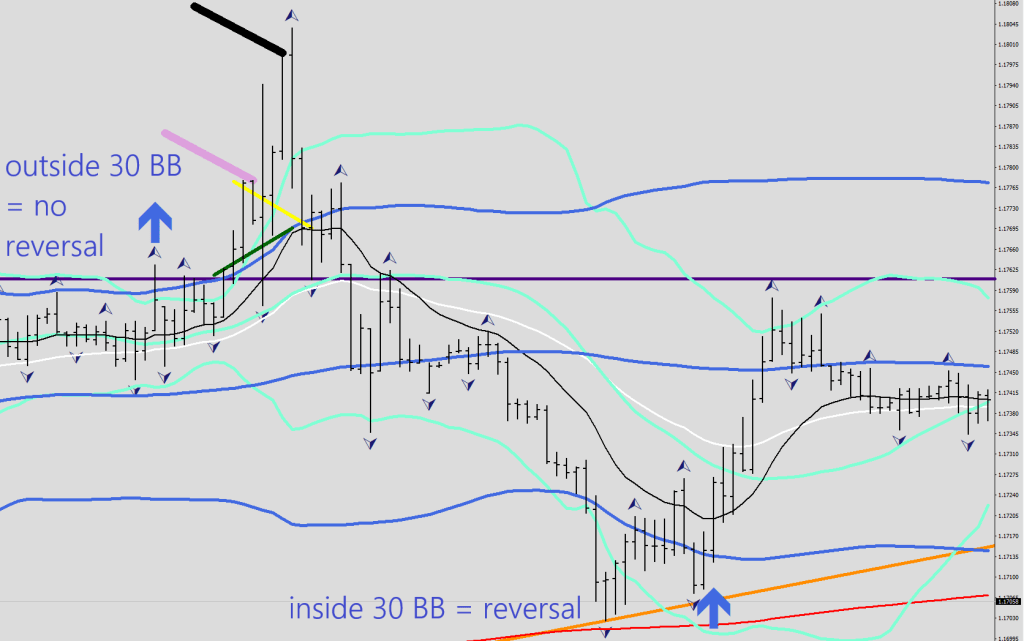
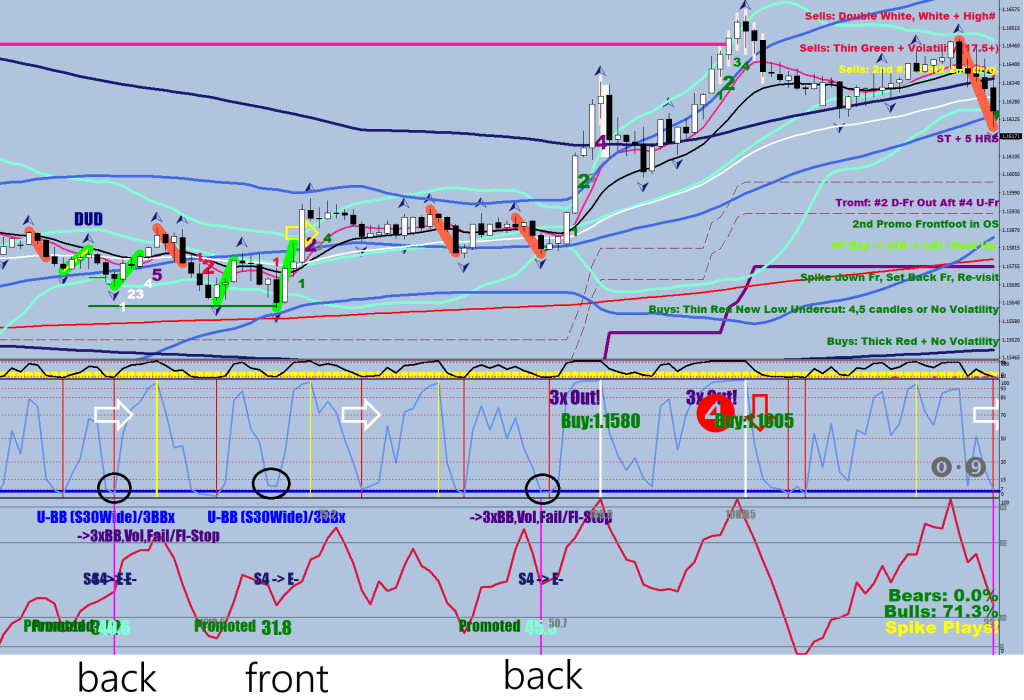
This volatility halt signal can flip the directional logic in two different directions based on if the short-term BB30 was violated at once or not.
Given the above, I would call the blue arrow the Volatility Bird that can flip based on short-term volatility-availability (mental images are important to get imprinted deeply).
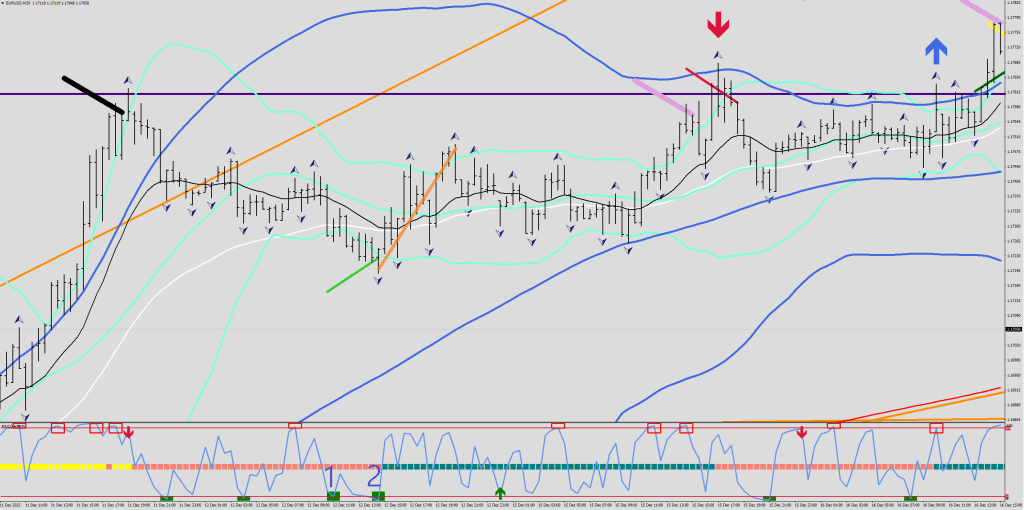
I have also received a confirmation for my “double white” signal that manages to catch a top with awesome accuracy.
The importance is that the two independent filters coincide on the same 30-minute candle. The double white on the upside is basically the equivalent of the double gray divergence on the hourly plotted by the Vax.
Now, onto your lesson.
Let me know when the lightbulb comes on.
The crossed-out box is a “false print”; the daily Forex broker close with the expanded spread should be ignored.
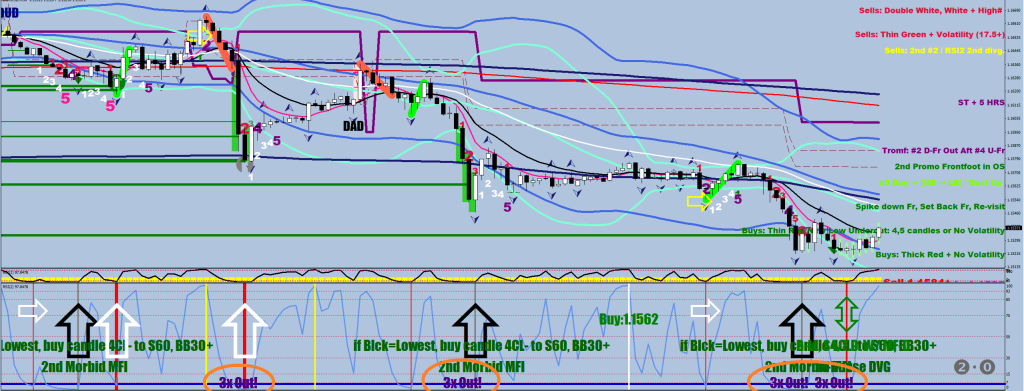
If you have concluded that every second soap box, when large (the candle went outside the 30BB), was a buy for a run to the upper 30BB (plus 5 pips normally), you found what was tradeable (while above the 9-day EMA).
Every instrument must be traded based on its own merits. I started with Natural Gas. There were no tradeable fundamentals or technicals; the only thing that truly made the market move was a storage report from the East Coast every Thursday morning. Just because you see candles in front of you that seem familiar, as that is how you plot the data, you do not necessarily know anything about the nature of an instrument until you pick up on its routine motions. I feel sorry for people like him thinking that they can come up with a single method that allows them to trade any given instrument. He falls further into his own trap when he starts laying down restrictive rules. Put a dislike on it!
I would encourage you to listen to Spot Gamma podcasts to gain a better understanding of market mechanics, such as volume is not the only thing that can stop the price in its tracks, so can volatility.
Not much new, I doubled the size of the soap boxes (RSI2 in the last 6%) if the price also managed to hit outside the BB30, for accented importance.
/////RSI2 box dn
if (RSI2[i+1]<6 && RSI2[i]>6){
     if (Low[i+1]<iBands(symbol,0,30,2,0,PRICE_MEDIAN,MODE_LOWER,i+1))  ObjectCreate("KAROLYII"+IntegerToString(i), OBJ_RECTANGLE, 1, Time[i+2], 12, Time[i], 0);
     else ObjectCreate("KAROLYII"+IntegerToString(i), OBJ_RECTANGLE, 1, Time[i+2], 6, Time[i], 0);
     ObjectSetInteger(0,"KAROLYII"+IntegerToString(i),OBJPROP_COLOR,clrGreen);
     ObjectSetInteger(0,"KAROLYII"+IntegerToString(i),OBJPROP_WIDTH,3);
     if (Close[i+1]<iMA(symbol,0,414,0,MODE_EMA,PRICE_MEDIAN,i+1)) ObjectSetInteger(0,"KAROLYII"+IntegerToString(i),OBJPROP_BACK,0);
  }

/////RSI2 box up
 if (RSI2[i+1]>94 && RSI2[i]<94){
     if (High[i+1]>iBands(symbol,0,30,2,0,PRICE_MEDIAN,MODE_UPPER,i+1)) ObjectCreate("KAROLYII"+IntegerToString(i), OBJ_RECTANGLE, 1, Time[i+2], 88, Time[i], 100);
     else ObjectCreate("KAROLYII"+IntegerToString(i), OBJ_RECTANGLE, 1, Time[i+2], 94, Time[i], 100);
     ObjectSetInteger(0,"KAROLYII"+IntegerToString(i),OBJPROP_COLOR,clrRed);
     ObjectSetInteger(0,"KAROLYII"+IntegerToString(i),OBJPROP_WIDTH,3);
     if (Close[i+1]>iMA(symbol,0,414,0,MODE_EMA,PRICE_MEDIAN,i+1)) ObjectSetInteger(0,"KAROLYII"+IntegerToString(i),OBJPROP_BACK,0);
  }
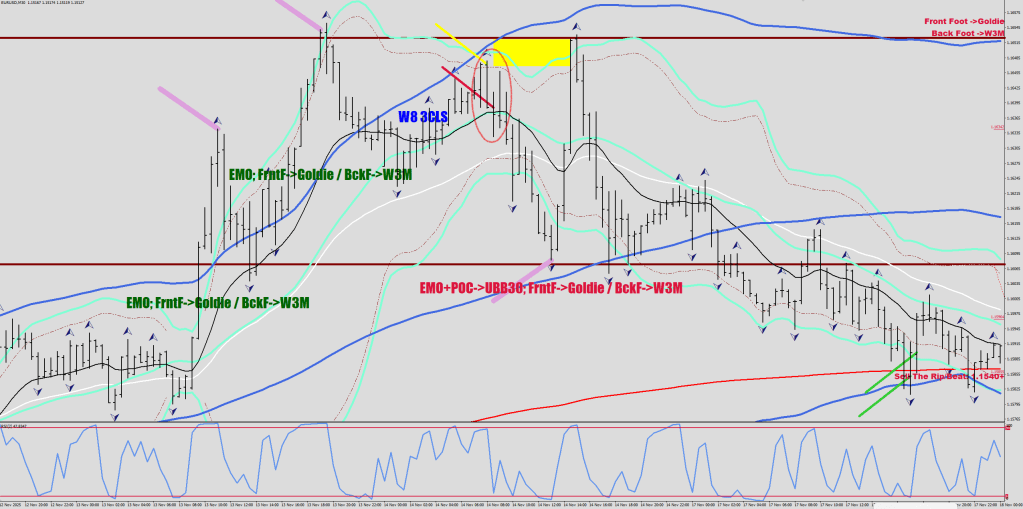
As you can see, the yellow does not typically mean a change of direction. Also, the expanding wedge can be broken on the unexpected side at times.
This did not finish on a bearish note, but there was no progress on the upside at all. It would be easy to turn this down, but a failed move to the upside cannot be excluded while the direction remains up.
I also added more arrows (natural progression) in the 6-8% zone, call them earlybirdspecial. They too have a say now in the directional logic.
One of the main reasons why the 30-minute chart is supreme: the craftsmanship of the RSI2.
Soap Box Opera
Shoes come in pairs. They belong. To be long, you can go in when the second shoe has fallen. Particularly above the 9-day EMA (solid soap box).
Examples for One Pair of Shoes, you’re good to run.
The exit is 8+ pips beyond the 30BB.
The hollowed-out box is a dip below the 9-day EMA (E-414 on 30-minute). An out-of-sequence misstep.
As a second shoe, it can cater for up to 2 legs up (2 or 3 hollow red boxes), but it should only be taken seriously after some quick thinking at the 120BB.
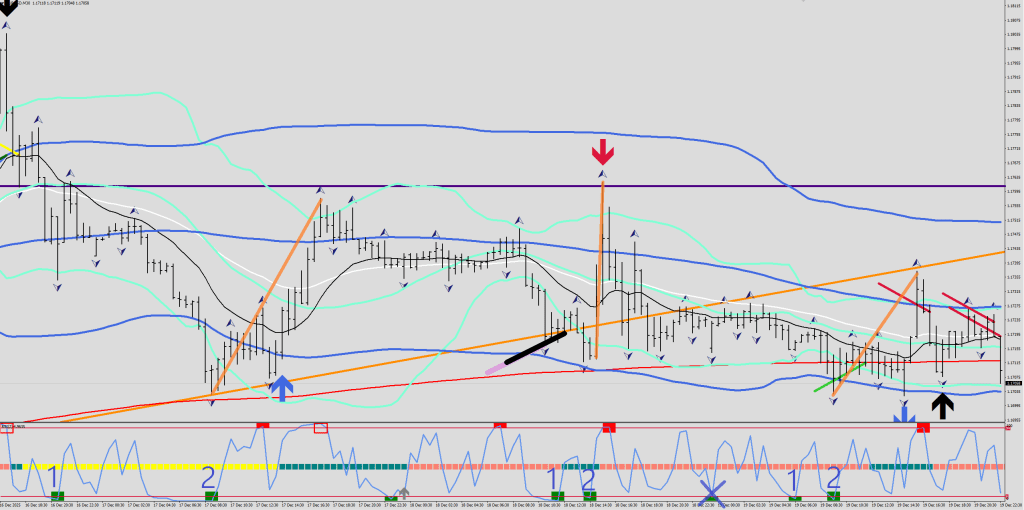
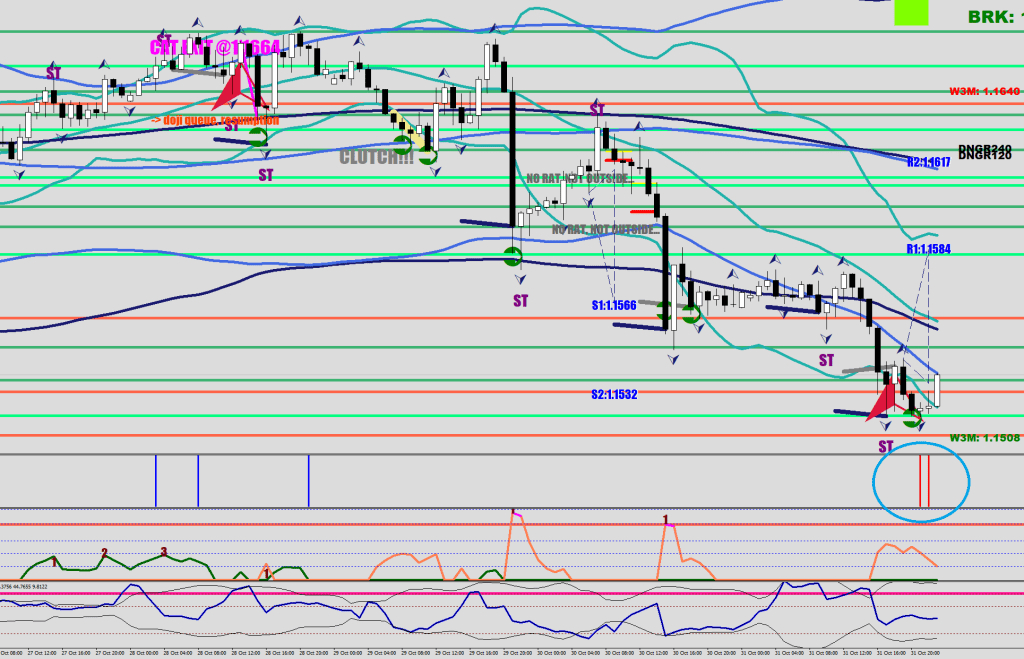
Now we have a move back up to a previous POC 11 hours before the Rate Cut.
The one example I found where the blue & black combo appeared (without a color arrow prior) was a reflex move back to S120. This one just tagged the S240. My bet here is a move back down to the BB120, then S120 again.
Admittedly, I have no proof of the direction turning back down again; it’s just the analog. Buying seems to be embedded still at the moment.
if (RSI2[i+1]<6 && RSI2[i]>6){
     ObjectCreate("KAROLYII"+IntegerToString(i), OBJ_RECTANGLE, 1, Time[i+2], 6, Time[i], 0);
     ObjectSetInteger(0,"KAROLYII"+IntegerToString(i),OBJPROP_COLOR,clrGreen);
     ObjectSetInteger(0,"KAROLYII"+IntegerToString(i),OBJPROP_WIDTH,3);
     if (Close[i+1]<iMA(symbol,0,414,0,MODE_EMA,PRICE_MEDIAN,i+1)) ObjectSetInteger(0,"KAROLYII"+IntegerToString(i),OBJPROP_BACK,0);
  }

 if (RSI2[i+1]>94 && RSI2[i]<94){
     ObjectCreate("KAROLYII"+IntegerToString(i), OBJ_RECTANGLE, 1, Time[i+2], 94, Time[i], 100);
     ObjectSetInteger(0,"KAROLYII"+IntegerToString(i),OBJPROP_COLOR,clrRed);
     ObjectSetInteger(0,"KAROLYII"+IntegerToString(i),OBJPROP_WIDTH,3);
     if (Close[i+1]>iMA(symbol,0,414,0,MODE_EMA,PRICE_MEDIAN,i+1)) ObjectSetInteger(0,"KAROLYII"+IntegerToString(i),OBJPROP_BACK,0);
  }
Also, my thinking is that there should be a 3rd “3X OUT” print, which is the price going outside all 3 Bollinger Bands before bottoming.
…
I call my daughter “Sús” at times.
It was carried over from when she used to become overtly excited if we were to go somewhere, and we told her, “Shoes!”
“Sussh, sussh!” she said back with getting busy putting them on.
There is a chance to turn back up around the blue BB (120-sample), but it has not happened yet. There should be a touch-and-go at the BB and another try that falls short. Kind of the mirror image of this:
Otherwise, wait for a color arrow (Red / Green = color arrows, Blue=no color, BB marker, Black=no color, black is a Tone).
The black can be a higher low / lower high already, but the colorless combo has no real foundation for a complete reversal without a color arrow (typically at the opposite side).
Once I asked my daughter about a watermelon slice that was cut like a triangle, what it was. She answered: “Pizza!”
She was right. Adults want to always be precise and accurate. In real life, things can just be true or qualified.
Black belt
How would you call a market that manages to close outside the 30-sample BB more than 5 times in a row?
Halle Berry would answer: lop-sided*. i.e., the buying/selling went flat.
A one-sided buying/selling (3 hours or more) is working towards something that does not seem to be happening: a burst out in the directional volatility.
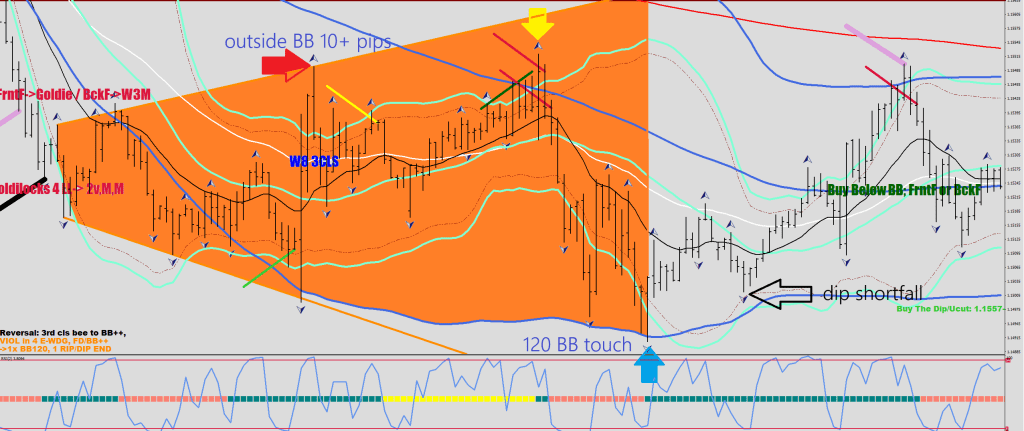
Once back inside the BB, a fork is presented: tackle the most recent high/low and prompt a volatility expansion wedge or call it quits within 4 30-minute candles.
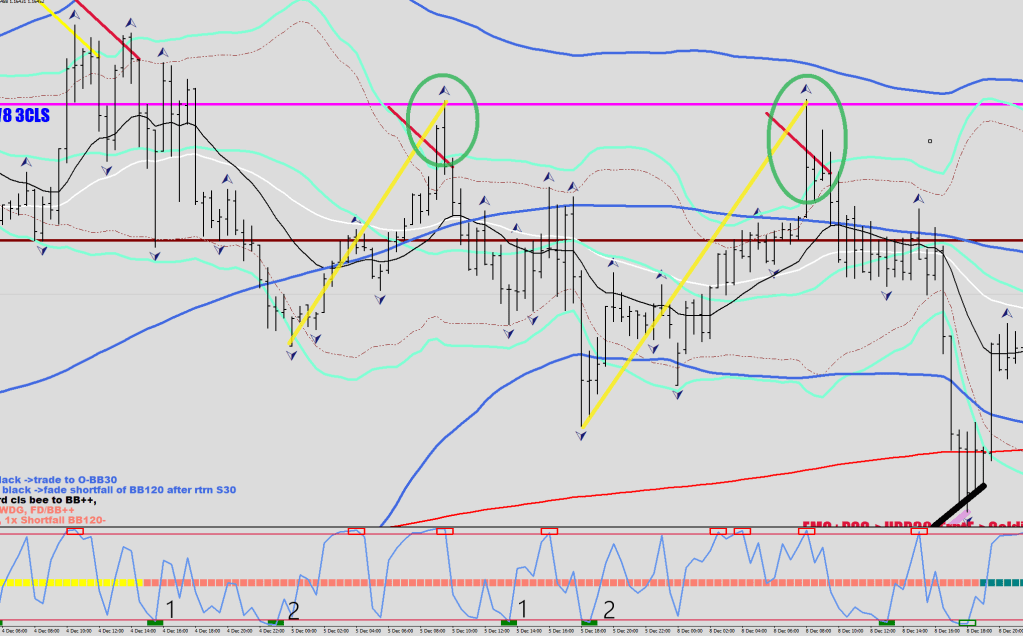
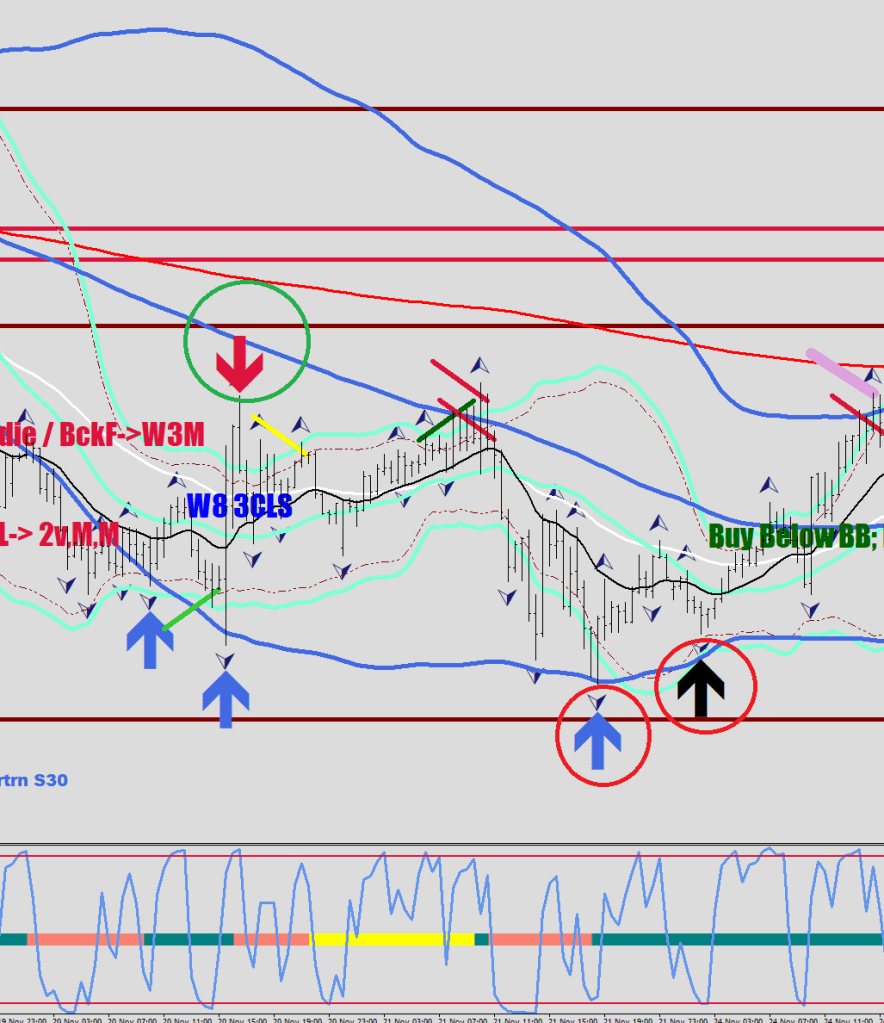
I’ll show you two expansions first.
There are 3 key points in the ensuing wedges.
Green / Red arrow: support/resistance level faked out at the opposite end of the 30-minute BB by 10+ pips.
Blue Arrow: touch down / slight overthrow at the 120 BB.
Black arrow: the shortfall upon the next approach of the rip/dip interrupted line.
An example of a fork where the red arrow would be: no burst of volatility 10+ pips outside the BB -> the down move continues.
The current move off the black lacked the overrun of the low, but the price has made it outside the BB by 9 pips – the resistance level has been found, albeit there is no volatility expansion in both directions currently.
You could either see a yellow arrow (backtest of the resistance) or a touch down on the 120 BB – blue arrow, which would be a higher low in this case. Should there be a touchdown next, I would go long at the shortfall next to the dip on the next leg down.
The bottom line is that the directional logic should receive an adjustment by the black print, as well as at the 120 BB fake outs.
* Halle Berry was once told that her boobs were lopsided. She answered: Of course they are, because they are real.
The world is idolising MF assholes.
Steve Jobs was once having dinner with the ex ex-wife and daughter. When the ex-wife mentioned that there was some butter in the soup, he immediately spat it back.
Elon Musk does not stand for a single principle. His legacy is that he is a mass murderer.
He says that there are not enough people on the planet and pays 15 million to mothers he hires to have his kids, so he has to balance in his mind having made 20 people with 600,000 killed by him to date with his USAID and other chainsaw cuts. Ok. I guess he stands for racism.
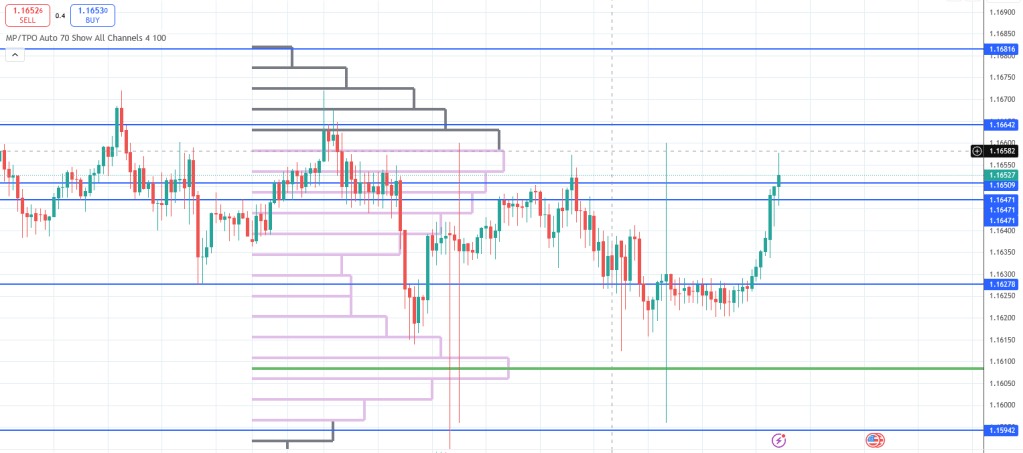
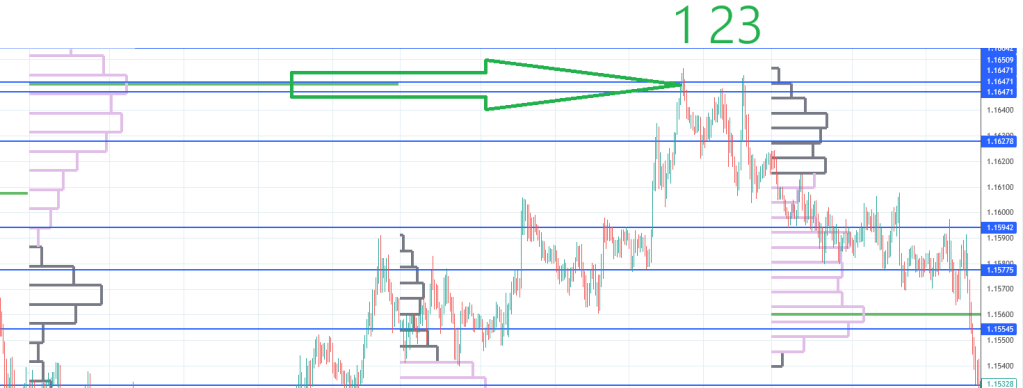
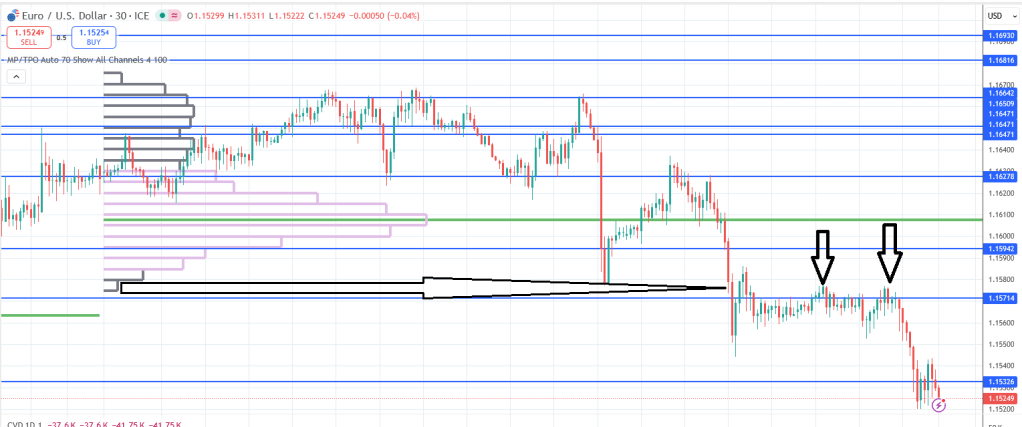
Using a weekly market profile can really improve your entries.
There are two typical rejection zones. One, the easier one to spot is the POC. What you need to be conscious of is that the 10-pip zone towards it is all hot, and if you go over the POC by 8 pips, that’s just a slight overshoot.
One recurring theme is having to see multiple failures, but at least 2.
Zooming in, you see where the market turns into a sell-the-rip. A move from beyond the dotted line (3-pips shy of the 30BB on the 30 min), which ends up closing back inside the 16 EMA by 2 pips within the next 2 candles. The Maroon lines are various POCs.
I have not started making indicators for TradingView, and don’t think I would, as you can only have 2 plots for free.
After the behavior has changed, you can put out pending orders, scale into a short towards the POC, say one third of the maximum size you have in mind, 8pips out, one third 4 pips out, and the rest at the POC.
As you can see, the first leg down after the behavior change does bounce back hard from the lower POC, but there is also a sign of acceleration to the downside: the 4 consecutive closes outside the 30BB, marked up by the purple line. The following setback, the 1.5-hour rip back to the upper POC, was the liquidity break. You should therefore be suspicious of moves covering great distances in a short amount of time, seemingly out of nowhere.
Then the market finds resistance at the 30 SMA / E-44, and gets to break the lower POC.
Then there was buy the dip again, with the ceiling being the back tests from below.
The dip in this constrained box meant the moves below the 50% mark between the next two POCs.
The mode flipped again, and there was a kiss goodbye to the now upper POC-s force field. Since there was a lot more interaction with the lower field before this back test, what you should have done as a pro trader is to give a discount on your spread, i.e., put 2/3 of your size out 8-pip shy and another third at 4 (went unfilled).
The break this time went into overdrive.
After the buy-flip impulse, you could have taken a long in the green box: more than 50% away from the top, and exited 10-12 pips away from the POC, considering the major acceleration to the downside; one run had 8 closes outside the BB. The better trade was, of course, selling against the POC, at 12 pips out, as that was all you got. Looking at the green oval, one thing should pop in your mind: the violence of it again was a hint for a liquidity break.
That is what you get after an acceleration: the counter move would be a temporary setback before a continuation.
Now we have stalled out at the lower POC. The market hasn’t flipped mode, so the 50%+ would be a good place to enter (the rip) for running over the lower POC. Also, there will be another POC print in the mix, probably not far above it.
The mode would have to change. It could be done with the next leg down, with a slightly lower low that does not get past the lower POC by 10+ pips.
One remark is that I shift up the TradingView POCs when transferring them from the ICE chart to MT4 by up to 3 pips.
Also, if you were a scammer, you could sell the POCs as for instance, Voodoo lines for $90 per month and call the Monthlies Tree Lines and the Yearlies Snow Lines, etc. Just an idea.
On Friday, the market was trapped between the POC from 3 and 2 weeks ago.
At least the behavior has changed. It went from Buy The Dip to Sell The Rip.
I started calling 4 30-minute closes outside the 30 BB “emotional” and 5+ closes a Hype.
That sudden vertical move back up was after an emotional move into the POC that was made 3 weeks ago to the RIP level (starting 3 pips shy of the upper BB).
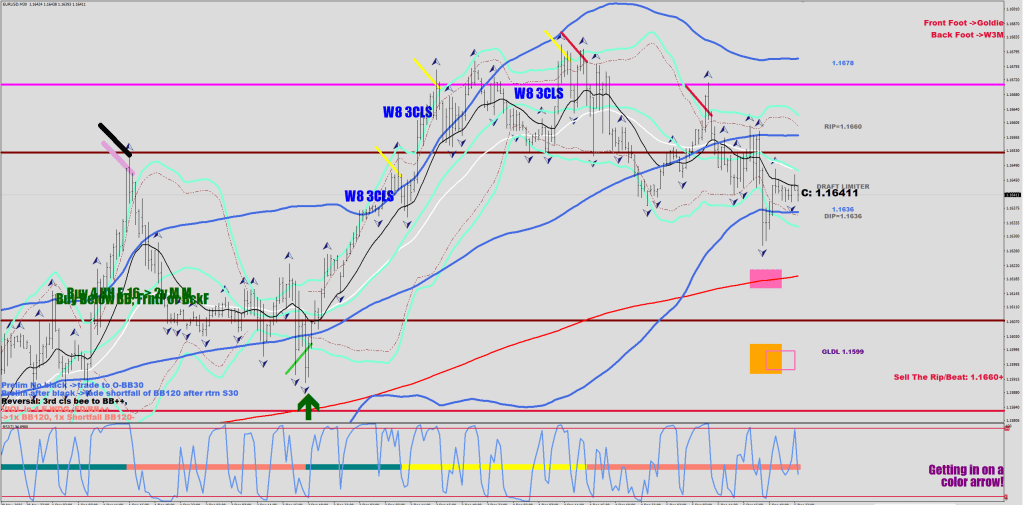
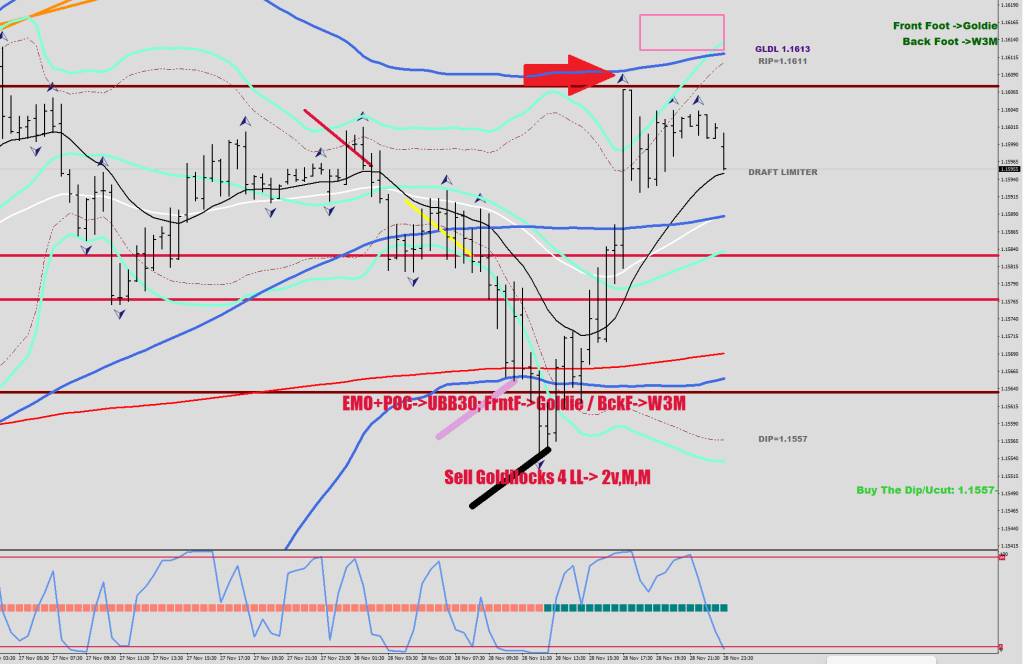
The second thing was paying more attention to a move starting from the back or the front foot.
The two projection boxes link up with different depth starting moves (RSI2, 30 min). The pinkish-looking box is the target area of a front-foot move (Goldilocks to W3C-5 pips), the orange box is W3M to W3F for the back foot kick start.
These values are measured from the consolidation mean. I came up with the method of figuring the anchor point. I never encountered any literature on the subject. I decided to use the CI (Choppinesss), I changed the “full charge level” to 53 from 51, I changed the sample rate (48), and the time frame (15 min), where I thought I would end up with a relatively small candle, split it in half, and call it the mean.
The measuring stick is the 3-day ATR (excluding today).
Goldilocks is 10 pips shy of 1 ATR.
W3M is 15% extra, W3F is 30%.
The back foot is 30-minuthe RSI2 HL2 below 6, the front foot is above 6.
On the upside, similarly, use 94 instead. This is a back-foot sell.
The aim is for 1.1390 currently, but must play it by the ear behavior, which could represent an end of the Wave 2 down.
Bloody Udio buyout by Universal Music has disabled downloads. I have 3 full albums made already, but I cannot release them, including my first Hungarian album with 25 tracks on it.
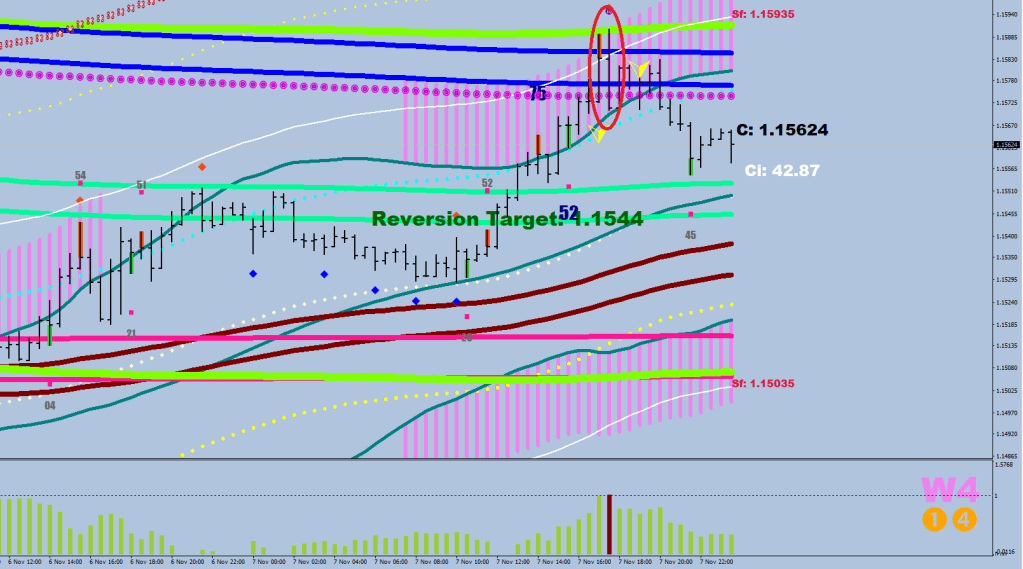
What brings on a mean reversion? A volatility crush.
The reversion’s target is the snapshot of the far end of the 9-day EMA Band.
A typical mean reversion plays out in 48-56 hours.
Say from 14:00 on the 5th of November to 17:00 on the 7th of November.
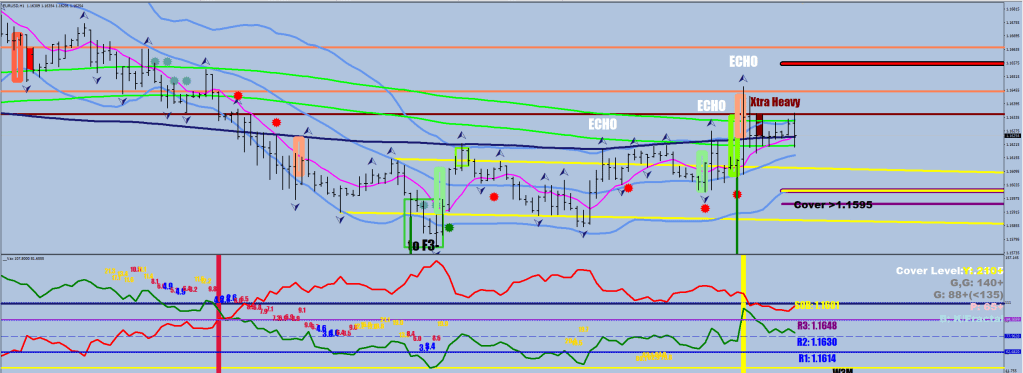
This unraveling of the oversold (or overbought) condition is likely going to get triggered by a volatility compression divergence.
The light green verticals are volatility compression anchors, if the market makes a lower low but is unable to compress the losing side’s settlement volatility further (1H close off the bottom), a line gets plotted. If the return beyond the 8 EMO happens within 2 hours, the divergence is yellow (not enough separation), if it takes longer, the divergence is gray.
Therefore, on the above image, you can say that a gray divergence was second-guessed by a yellow divergence before the next gray divergence was fortified by another, wider gray divergence with a slight, 5-pip undercut as the final nail in the reversal’s coffin. That’s what Vax is for.
If you want to become a good trader, take mean reversion to heart, as they are the most “protected” move. Imagine the volume you could put on knowing the duration and the target.
I did make a plot for the 30-minute to have highlights at a glance, tell me if this is a buy the dip or sell the rip market, and to top it off, I named the 5-closes outside the 30-BB condition as Hype, and that’s when volatility can turn on itself (flip) with a high likelihood.
///2.5 hours outside at upper band
if (High[i]-Low[i]>160*Point &&
Close[i+4]>iBands(symbol,0,30,2,0,PRICE_MEDIAN,MODE_UPPER,i+4) && Close[i+3]>iBands(symbol,0,30,2,0,PRICE_MEDIAN,MODE_UPPER,i+3) &&
Close[i+2]>iBands(symbol,0,30,2,0,PRICE_MEDIAN,MODE_UPPER,i+2) && Close[i+1]>iBands(symbol,0,30,2,0,PRICE_MEDIAN,MODE_UPPER,i+1) &&
Close[i]>iBands(symbol,0,30,2,0,PRICE_MEDIAN,MODE_UPPER,i)
){
   ObjectCreate("Dox"+IntegerToString(i),OBJ_TREND,0, Time[i+9], Close[i]+80*Point, Time[i], Close[i]);
      ObjectSet("Dox"+IntegerToString(i),OBJPROP_COLOR,clrCrimson);
      ObjectSet("Dox"+IntegerToString(i),OBJPROP_WIDTH,10);
      ObjectSet("Dox"+IntegerToString(i),OBJPROP_RAY_RIGHT,false);
}


///reversal at upper band
if (iBands(symbol,0,30,2,0,PRICE_MEDIAN,MODE_UPPER,i+2)-iBands(symbol,0,30,2,0,PRICE_MEDIAN,MODE_LOWER,i+2)>160*Point &&
((High[i+2]>High[i+3] && High[i+2]>iBands(symbol,0,30,2,0,PRICE_MEDIAN,MODE_UPPER,i+2)-30*Point) || High[i+2]>iBands(symbol,0,30,2,0,PRICE_MEDIAN,MODE_UPPER,i+2))
 && Close[i]<iMA(symbol,0,16,0,MODE_EMA,PRICE_MEDIAN,i)-10*Point
 && Low[i+4]>iBands(symbol,0,30,2,0,PRICE_MEDIAN,MODE_LOWER,i+4)
 //&& High[i+2]>High[i+3]
 ){
   ObjectCreate("Dox"+IntegerToString(i),OBJ_TREND,0, Time[i+9], Close[i+2]+80*Point, Time[i+1], Close[i+2]);
      ObjectSet("Dox"+IntegerToString(i),OBJPROP_COLOR,clrCrimson);
      ObjectSet("Dox"+IntegerToString(i),OBJPROP_WIDTH,6);
      ObjectSet("Dox"+IntegerToString(i),OBJPROP_RAY_RIGHT,false);
}

///Reinforcement at upper band
if (i>0 && iBands(symbol,0,30,2,0,PRICE_MEDIAN,MODE_UPPER,i+2)-iBands(symbol,0,30,2,0,PRICE_MEDIAN,MODE_LOWER,i+2)>160*Point &&
High[i+2]>iBands(symbol,0,30,2,0,PRICE_MEDIAN,MODE_UPPER,i+2) && Low[i]<iMA(symbol,0,16,0,MODE_EMA,PRICE_MEDIAN,i) && Close[i]>iMA(symbol,0,16,0,MODE_EMA,PRICE_MEDIAN,i) && Close[i+1]>iMA(symbol,0,16,0,MODE_EMA,PRICE_MEDIAN,i+1)){
   ObjectCreate("Dox"+IntegerToString(i),OBJ_TREND,0, Time[i+9], Close[i]-80*Point, Time[i+1], Close[i]);
      ObjectSet("Dox"+IntegerToString(i),OBJPROP_COLOR,clrDarkGreen);
      ObjectSet("Dox"+IntegerToString(i),OBJPROP_WIDTH,6);
      ObjectSet("Dox"+IntegerToString(i),OBJPROP_RAY_RIGHT,false);
}


///2.5 hours outside at lower band
if (High[i]-Low[i]>160*Point &&
Close[i+4]<iBands(symbol,0,30,2,0,PRICE_MEDIAN,MODE_LOWER,i+4) && Close[i+3]<iBands(symbol,0,30,2,0,PRICE_MEDIAN,MODE_LOWER,i+3) &&
Close[i+2]<iBands(symbol,0,30,2,0,PRICE_MEDIAN,MODE_LOWER,i+2) && Close[i+1]<iBands(symbol,0,30,2,0,PRICE_MEDIAN,MODE_LOWER,i+1) &&
Close[i]<iBands(symbol,0,30,2,0,PRICE_MEDIAN,MODE_LOWER,i)
){
   ObjectCreate("Dox"+IntegerToString(i),OBJ_TREND,0, Time[i+9], Close[i]-80*Point, Time[i], Close[i]);
      ObjectSet("Dox"+IntegerToString(i),OBJPROP_COLOR,clrDarkGreen);
      ObjectSet("Dox"+IntegerToString(i),OBJPROP_WIDTH,10);
      ObjectSet("Dox"+IntegerToString(i),OBJPROP_RAY_RIGHT,false);
}


///reversal at lower band
if (iBands(symbol,0,30,2,0,PRICE_MEDIAN,MODE_UPPER,i+2)-iBands(symbol,0,30,2,0,PRICE_MEDIAN,MODE_LOWER,i+2)>160*Point &&
Low[i+2]<iBands(symbol,0,30,2,0,PRICE_MEDIAN,MODE_LOWER,i+2) && High[i+3]>iBands(symbol,0,30,2,0,PRICE_MEDIAN,MODE_LOWER,i+3) &&  Close[i]>iMA(symbol,0,16,0,MODE_EMA,PRICE_MEDIAN,i)
&& High[i+1]<iMA(symbol,0,44,0,MODE_EMA,PRICE_MEDIAN,i)
&& Close[i+1]>iBands(symbol,0,30,2,0,PRICE_MEDIAN,MODE_LOWER,i+1)
){
   ObjectCreate("Dox"+IntegerToString(i),OBJ_TREND,0, Time[i+9], Close[i+2]-80*Point, Time[i+1], Close[i+2]);
      ObjectSet("Dox"+IntegerToString(i),OBJPROP_COLOR,clrLimeGreen);
      ObjectSet("Dox"+IntegerToString(i),OBJPROP_WIDTH,6);
      ObjectSet("Dox"+IntegerToString(i),OBJPROP_RAY_RIGHT,false);
}

///reinforcement at lower band
if (i>0 && iBands(symbol,0,30,2,0,PRICE_MEDIAN,MODE_UPPER,i+2)-iBands(symbol,0,30,2,0,PRICE_MEDIAN,MODE_LOWER,i+2)>160*Point &&
Low[i+2]<iBands(symbol,0,30,2,0,PRICE_MEDIAN,MODE_LOWER,i+2) && High[i+3]>iBands(symbol,0,30,2,0,PRICE_MEDIAN,MODE_LOWER,i+3) && High[i]>iMA(symbol,0,16,0,MODE_EMA,PRICE_MEDIAN,i) && Close[i]<iMA(symbol,0,16,0,MODE_EMA,PRICE_MEDIAN,i) && Close[i]<iMA(symbol,0,16,0,MODE_EMA,PRICE_MEDIAN,i) && Close[i]>Close[i+1]){
   ObjectCreate("Dox"+IntegerToString(i),OBJ_TREND,0, Time[i+9], Close[i]+80*Point, Time[i+1], Close[i]);
      ObjectSet("Dox"+IntegerToString(i),OBJPROP_COLOR,clrCrimson);
      ObjectSet("Dox"+IntegerToString(i),OBJPROP_WIDTH,6);
      ObjectSet("Dox"+IntegerToString(i),OBJPROP_RAY_RIGHT,false);
}
I was thinking of leading up with a brownie point to Shapiro when he says that first, the behavior has to change. Then suggest that someone should tell him about Bollinger Bands, and then conclude that he still has time, and who knows, he may also come up with the 30-minute 30-sample being the answer.
Or maybe I should just wish everyone a good weekend.
First, about a market profile tool on TradingView that I find useful.
I cannot fully embrace the terminology of “in balance”, but that’s what I must go with. If you want to see a seldom-interrupted trending move, you want the price to get outside last week’s volume profile, back test it a couple of times, and keep going. The zoom is far superior here as well, so I would plot the horizontal levels.
Now, the weekend project.
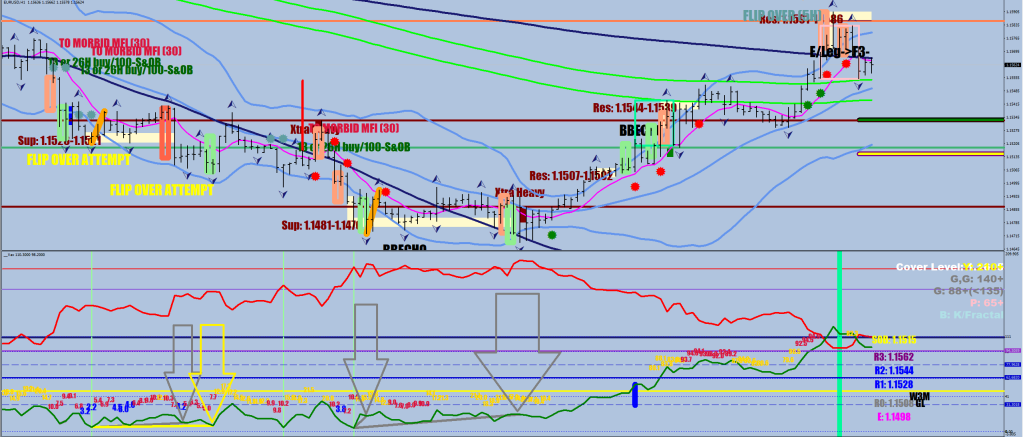
The idea is to use the MFI(7) to adjust a trail stop 20 pips out.
You know, markets love symmetry, and I love people who can’t stop repeating that the market loves symmetry.
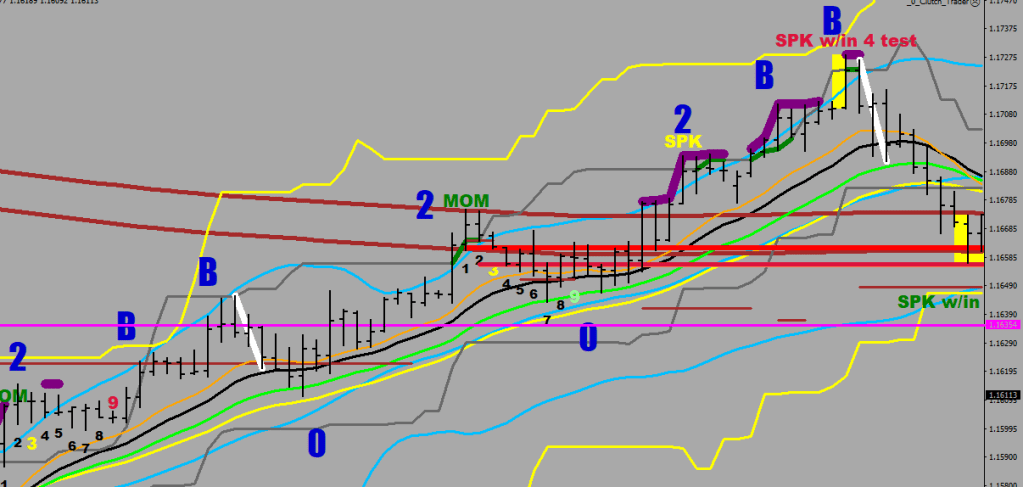
Terminal sequences identified so far:
2-M-0-2-M
2nd 2-B-B
2nd 3
1-0-1-B-B (weak)
1 stands for a hit / near miss of the 30-sample BB (1 H). B is a beat before a “0” tie off, which is going over the orange, 12 EMA. The white line calls attention to the close back inside the 12 EMA after a fresh low / high was made within the last 4 hours (versus 6 or more).
I started calling the bow back beats a B as well after a 2 print if they are in excess of 10 pips.
An M is a match, which re-visits the 2 print (a swing high/low beyond the gray line) within +/- 6 pips (of course, without the price getting all the way to the 12 EMA first).
I also believe that it is a good idea to keep track of the price going outside the 30, 120, and 240 Bollinger bands on the 30-minute chart.
////3x out down
 if (Low[i]<iBands(symbol,0,30,2,0,PRICE_MEDIAN,MODE_LOWER,i) && Low[i]<iBands(symbol,0,120,2,0,PRICE_MEDIAN,MODE_LOWER,i) && Low[i]<iBands(symbol,0,240,2,0,PRICE_MEDIAN,MODE_LOWER,i) ) {
               ObjectCreate("MINUSXX"+IntegerToString(i),OBJ_TEXT, 2, Time[i],15);
                ObjectSetText("MINUSXX"+IntegerToString(i),"3x Out!", 26, "Impact", clrIndigo);
            }

////3x out up
 if (High[i]>iBands(symbol,0,30,2,0,PRICE_MEDIAN,MODE_UPPER,i) && High[i]>iBands(symbol,0,120,2,0,PRICE_MEDIAN,MODE_UPPER,i) && High[i]>iBands(symbol,0,240,2,0,PRICE_MEDIAN,MODE_UPPER,i) && (High[i+1]<iBands(symbol,0,30,2,0,PRICE_MEDIAN,MODE_UPPER,i+1) ||  High[i+1]<iBands(symbol,0,120,2,0,PRICE_MEDIAN,MODE_UPPER,i+1))  ) {
               ObjectCreate("MINUSXX"+IntegerToString(i),OBJ_TEXT, 2, Time[i],95);
                ObjectSetText("MINUSXX"+IntegerToString(i),"3x Out!", 26, "Impact", clrIndigo);
            }
In conclusion, the deeply oversold state (poking outside the 3 bands) upgraded the weak reversal signal.
Now, how does this look?
Well, there seems to be a symmetry between the starting leg achieving a #2 and this finishing spike scoring about the same. The previous week’s pivot was backtested on Friday towards the end.
Well, the bears never lost their lead. The bulls were kept in the volatility compressor all along. At the finish, the bears/bulls were 58% to 38%. There seemed to be an extra-heavy long cover at the mean (9-day EMA). Sure, I am biased, 4.25 lots net short. See the glowing green rectangle? That was possibly the Grande after the Ariana in the top left. That hourly close plus 10 pips would be the low-risk short entry.
1400+ songs now in the Topic. On this album, I mostly plagiarized myself, upgrading some older poems.