Let’s start with the usual “Last Snail In The Coffin” trivia!
Did you know that Paul Tudor Zeta Jones was an FTX investor? Savvy, huh?
Why is it not too smart to trade on an “Exchange” where everythhing is built on lies, there’s no headquarters and the CEO is on the run in an indeterminate country, weary of going amongst people?
Bonus question, how much bigger story is this one than FTX if FTX had 8 billion of customer funds, and CZ has 71 billion?
Homework: look up that Crypto Face video (where he would be trading on USDT basis) talking about how difficult it is to turn USDT (or Bitcoin for that matter) into USD with a 3rd party help and extra cost.
Who was the world’s dearest insider trader?
Last question: Did you ever knowingly embezzle customer funds?
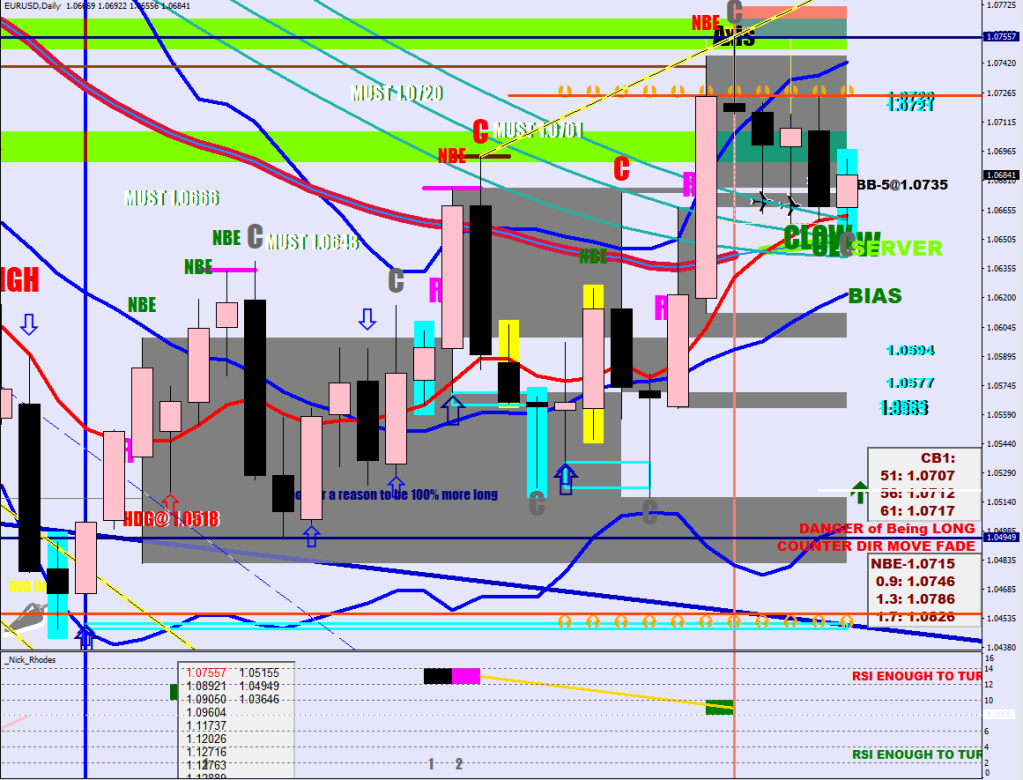
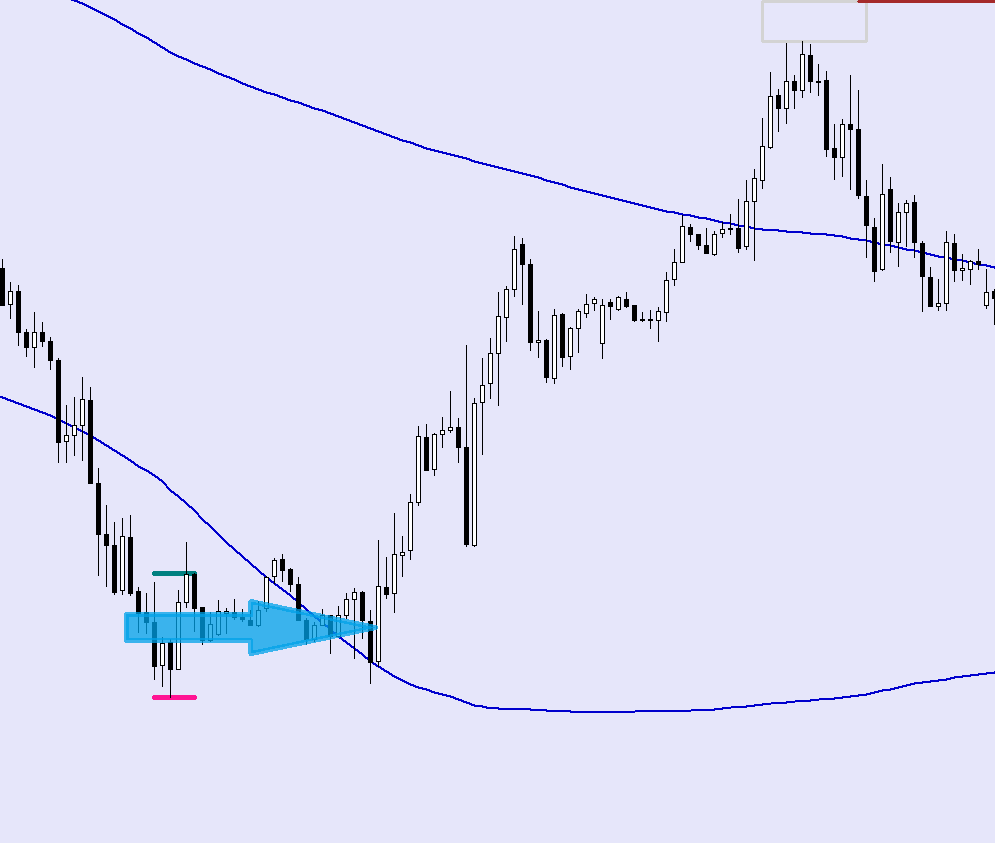
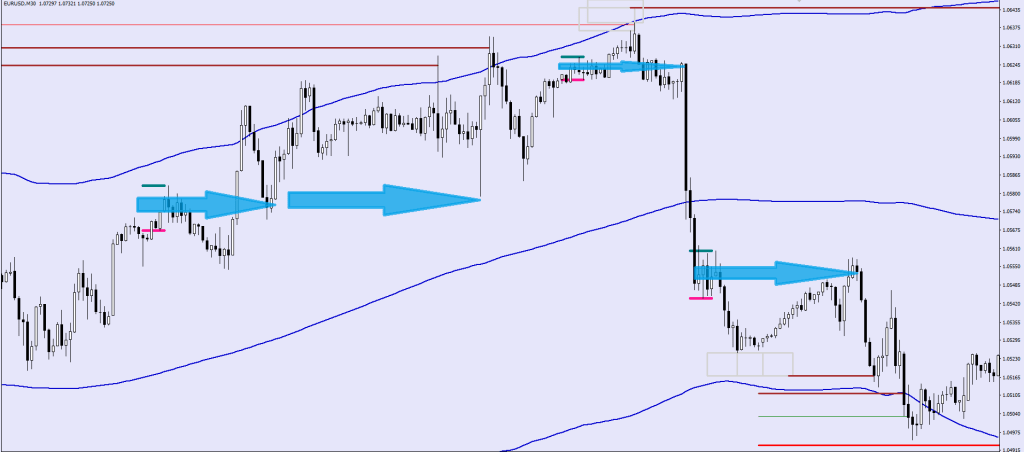
The next day would typically tell you – closing up / closing down what the professional holders had in mind.
In the current sample size I have one exeption where it was a cover after a larger decline and the next day would had mislead you.
All other times the next day’s close was a great clue about what would see more of in the near term.
Even if there was some setback, ultimately the next day’s direction prevailed.
The largest push against was on the above picture (bottom left), price moved 50 pips against the holding. A more typical occurence is the second example, where they would double down by reflex, not willing to take any draw down, as the second example shows on the same picture.
This brings us to the importance of how Monday’s candle would close.
…as someone either went long or short. The S-20 (Blue) is certainly rapidly approaching to provide support.
The Cyan shading equates to the Green on the Better Volumes code. Free lesson here about futures volume / tick volume.
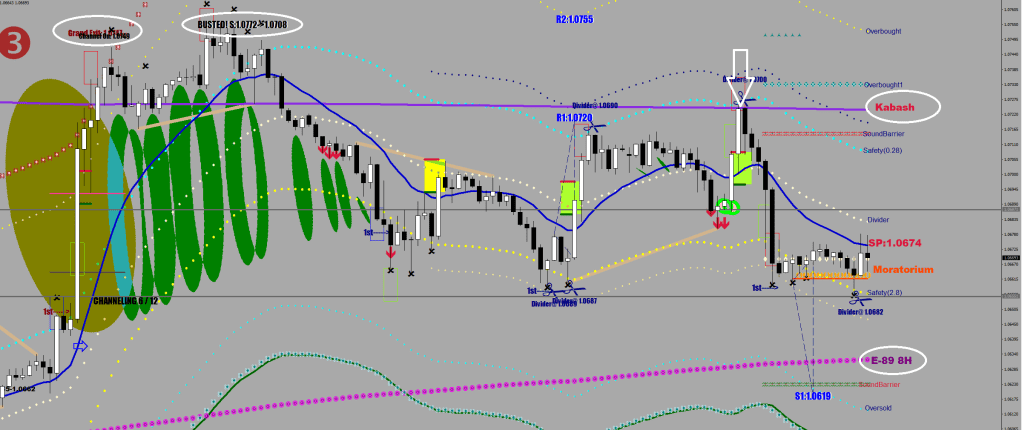
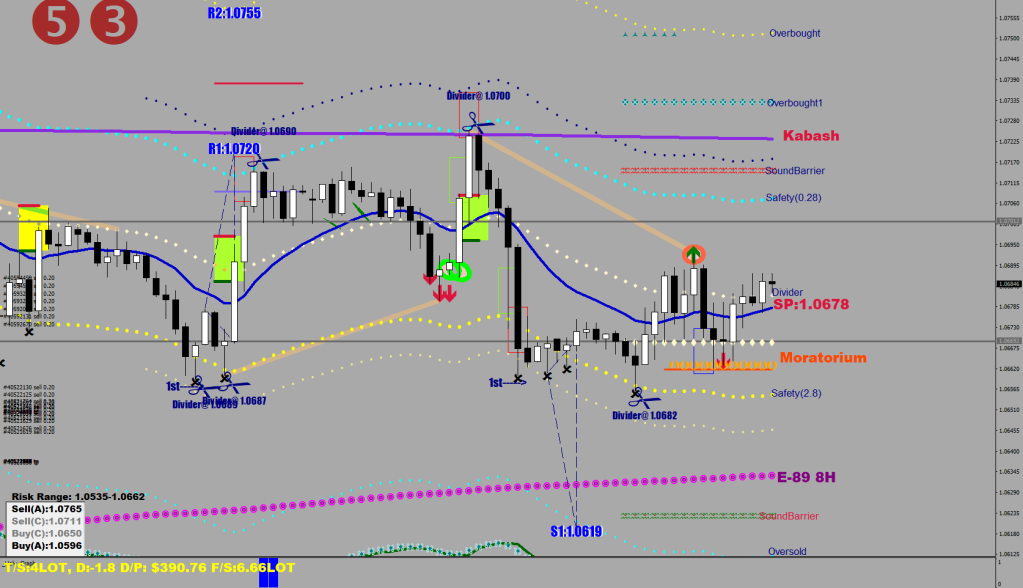
I do go back to my Holy Graph chart to check my naked holdings balance at times.
It is actually amazing how many things I managed to got working many many years ago in terms of a self interpreting chart.
For one thing the relevance of the 21-week EMA – which is 2528 EMA HL2 on the hourly, I named it Kabash.
The other circled plots are calling the plot, such as “BUSTED” and “Grand Exit”. The E-89 / 8-hours denomination is another main MA I used to track – iMA(NULL,0,89*8,0,MODE_EMA, PRICE_MEDIAN,0).
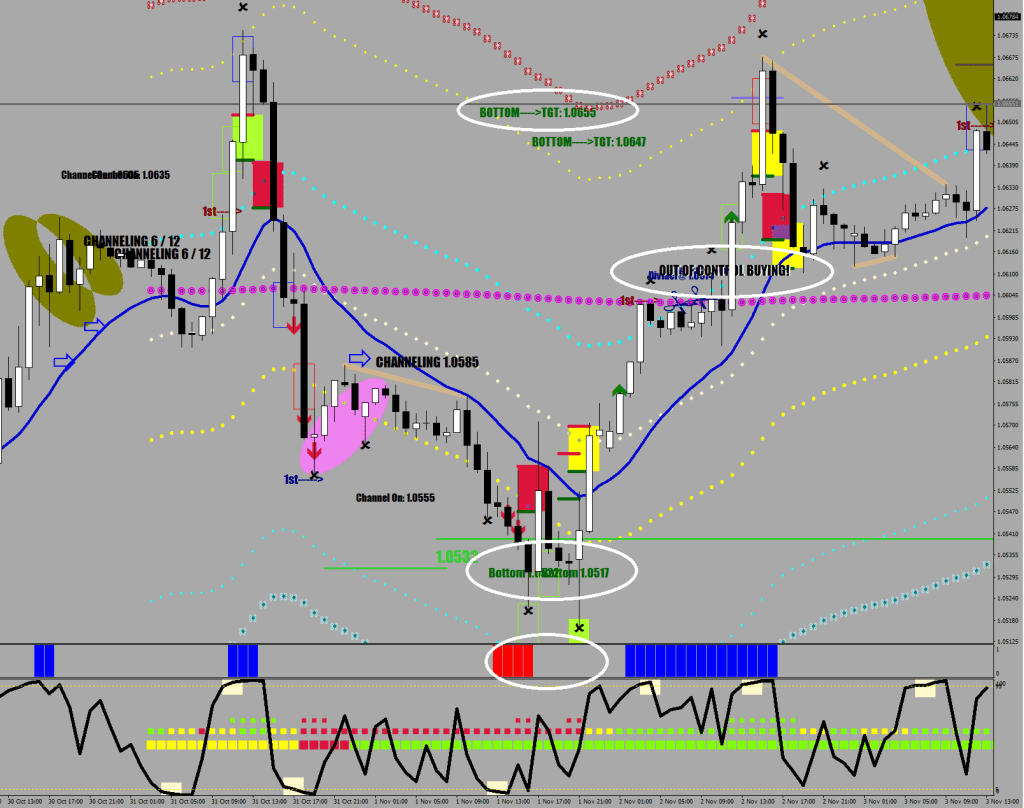
Beside the top call, here’s the bottom call with a mean reversion target:
The stochastic bars hybrid can be infinitely utilized for calling both Faith Healers and reversal divergences. The bottoms’s upper projection was only topped by 10 pips upon the reversion, but at the same time Out of Control Buyig commenced by then.
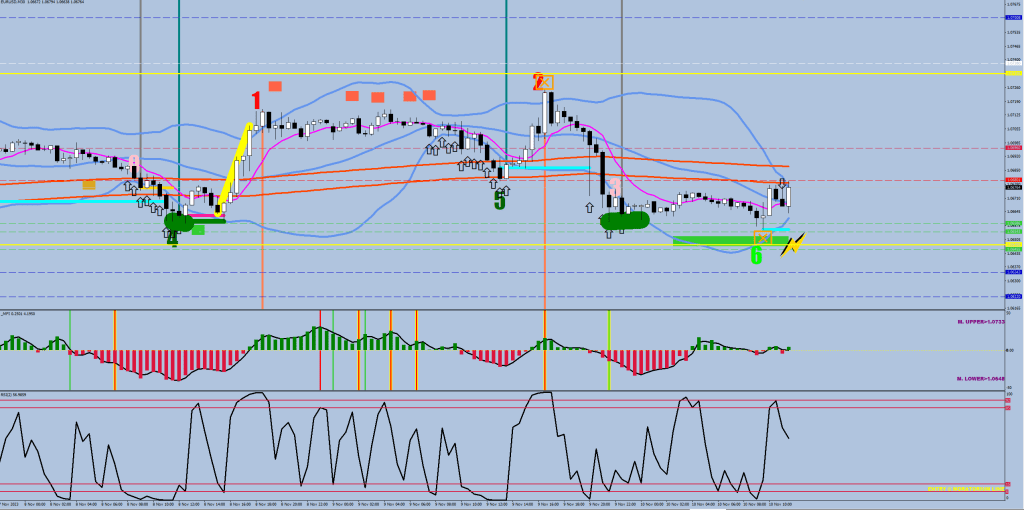
Anyways, in terms of futura, only the Final Divergence is missing now, #6 low has already printed with a Flash Gordon divergence.
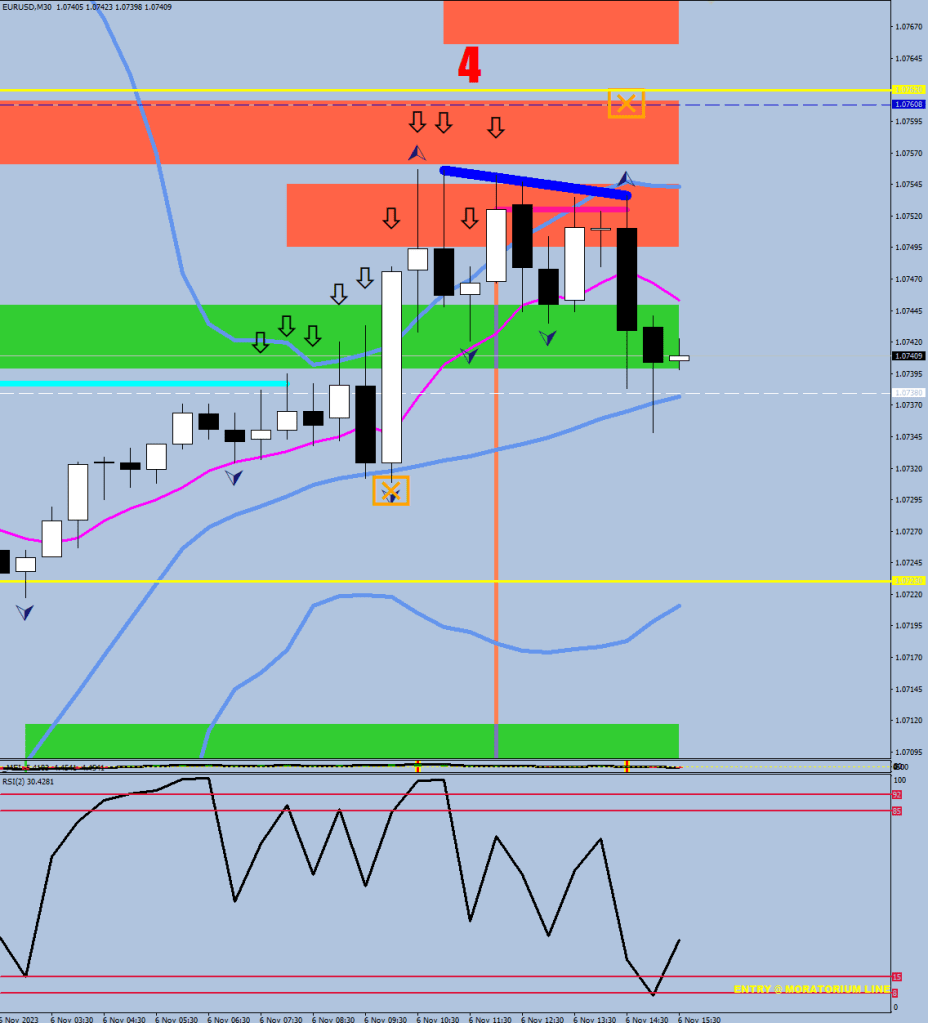
I’m trying to get some unform signal going between the two main charts (30 min & 1 hour), the blue divergence to go a little more crazy and push the pencil more breathlessly away from the last plot. Of course, the 1H momentum divergences would be plotted with 2x longer delay relative to the 30m ones, but what matters is the visual reminder.
/// 1H momentum divergence on the upside

 if (iFractals(symbol,0,MODE_UPPER,i) && High[i]<iBands(symbol,60,30,2,0,PRICE_MEDIAN,MODE_UPPER,i) && High[i]==iHigh(symbol,0,iHighest(symbol,0,MODE_HIGH,30,i))
 && RSI2[i]<97

  ){
   j=i+6;
   while (j<=i+24){
      if (RSI2[j]>RSI2[j+1]
      && RSI2[j]>RSI2[j-1]
      && RSI2[j]>92.5
      && RSI2[j]>RSI2[i]
       && High[j]<High[i]
      ) break;
    j++;
   }
  if (RSI2[j]>RSI2[j+1]
      && RSI2[j]>RSI2[j-1]
      && RSI2[j]>92.5
      && RSI2[j]>RSI2[i]
       && High[j]<High[i]
 // && Low[j]<iBands(symbol,30,30,2,0,PRICE_MEDIAN,MODE_LOWER,j)
  && Low[j]<iBands(symbol,60,30,2,0,PRICE_MEDIAN,MODE_UPPER,j)+10*Point
   ){
         ObjectCreate("Cobra120BPMMM"+IntegerToString(i),OBJ_TREND,0, Time[i], High[i], Time[j], High[j]);
      ObjectSet("Cobra120BPMMM"+IntegerToString(i),OBJPROP_COLOR,clrBlue);
      ObjectSet("Cobra120BPMMM"+IntegerToString(i),OBJPROP_WIDTH,16);
      ObjectSet("Cobra120BPMMM"+IntegerToString(i),OBJPROP_RAY_RIGHT,0);
   }
 }
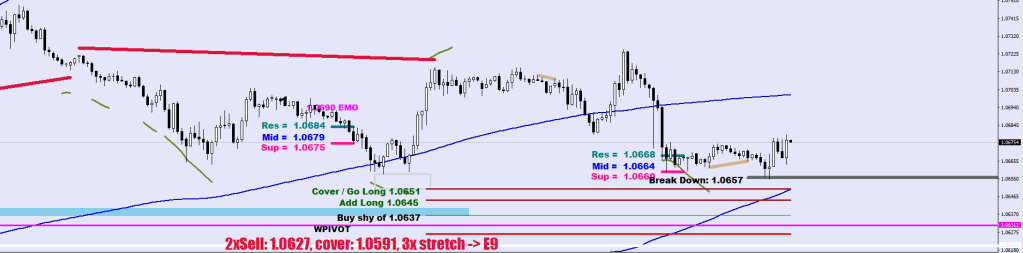
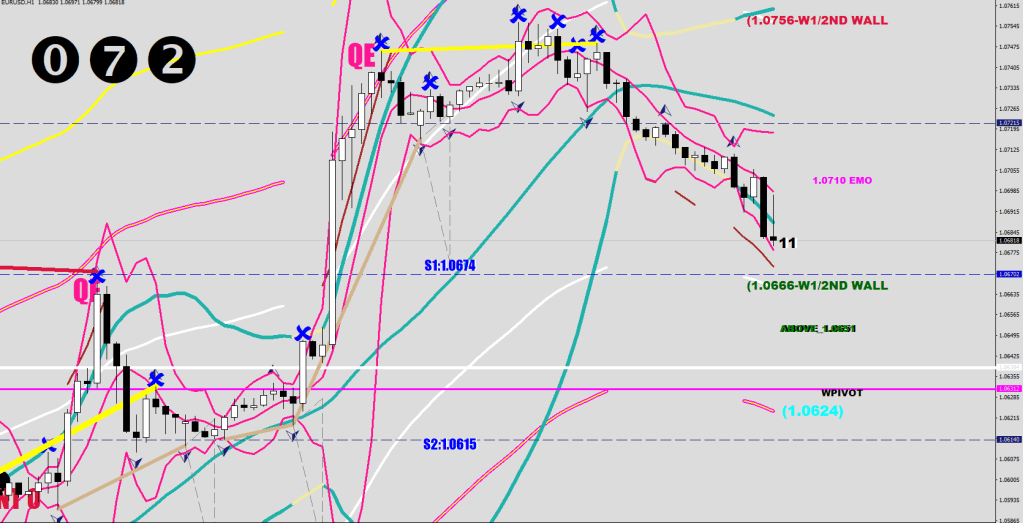
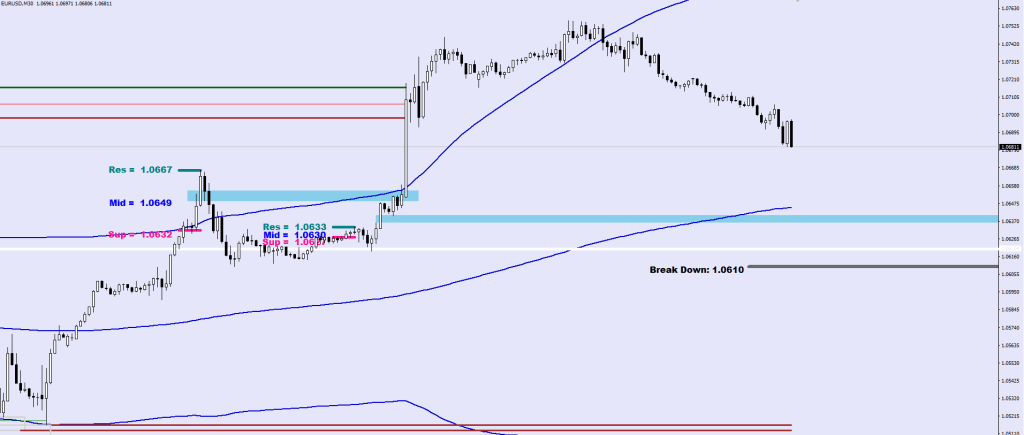
Lastly, I may be scaling out of shorts starting 1.0651. All shorts currently are set to 1.0636, but a manual close out is likely depending on the speed of the move.
I thought it would make it rain this week, currently sitting at $400 closed out trades. I did make back a whole lot of equity though, around 3K – lots of break even close outs.
There are all kinds of geniuses pouring out of YouTube. There is for instance the Austalian Genius that is monitoring the volatility of the volatility – hell knows how this would ever translate into a trade.
The FTX Genius is getting a Disney remake, but may not be coming out this year.
The FVG genius is getting a Silver Bullet into his backtest or vica versa.
I’m pacified, so I can spare you the watch too. It was only a winning strategy at first because the coder forgot to factor in the daylight saving time change. Sure, you can retire on this single idea. My ass. It is Ok not to believe in indicators, they don’t believe in you either.
Now, back to actual trading.
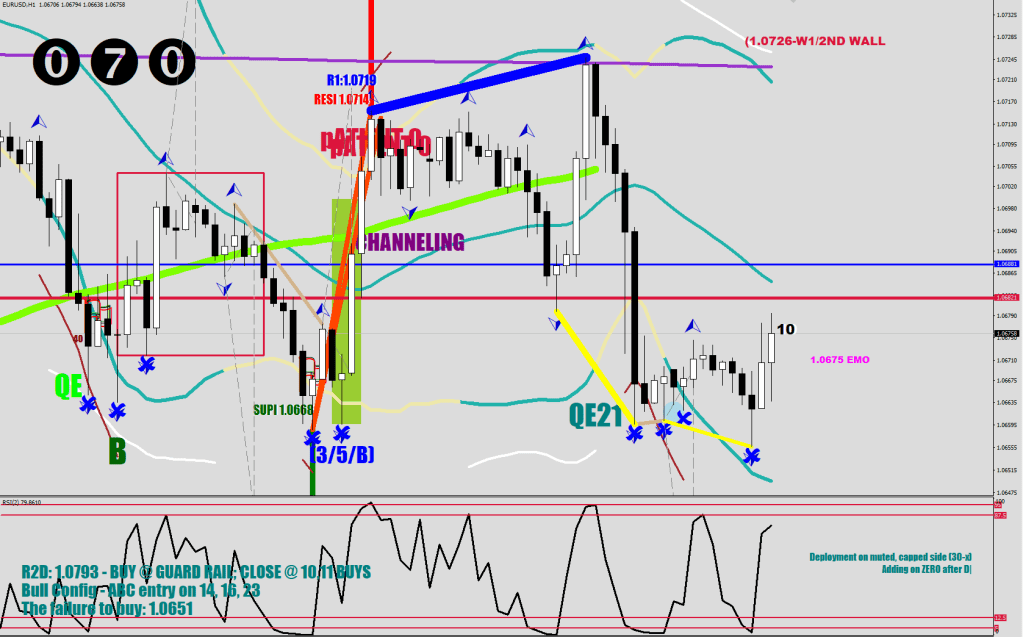
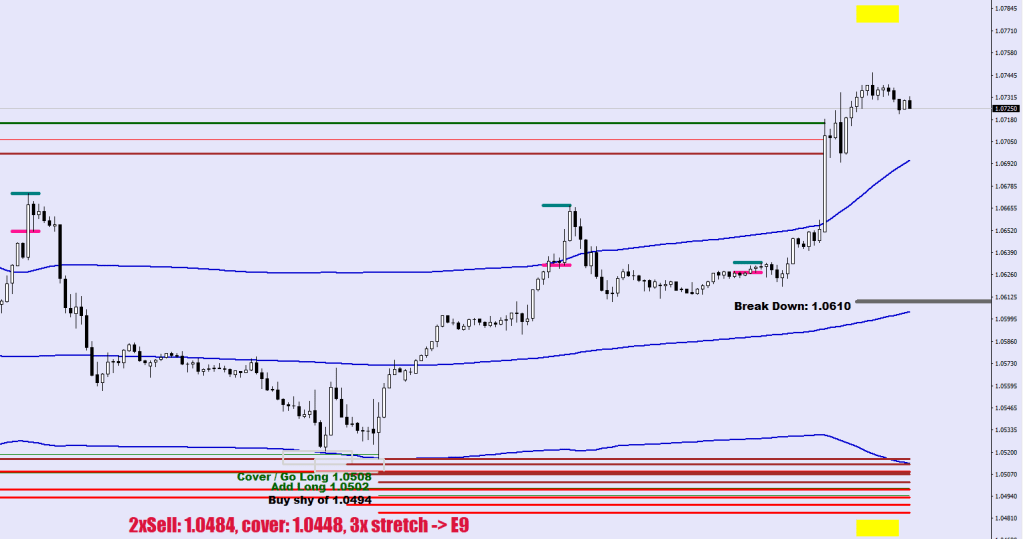
There was a regression low, a cover low in combination with progression low #4 (Green Plot), followed by a decisive move up and a progression high up. Looking bullish, but going nowhere fast.
You can see price pushing up against the last continuation divergence break out.
The money flow got very oversold – this was the reason for a relief bounce in combination with tagging the 240 SMA. This actually printed a reversal zone. My play would be the full monty here.
I think the weekly pivot shoud receive a fake out, and the downside sell algos would be called in for 36 pips extension. I am eyeing that 1.0591.
The bottom of the 240 Bollinger is now at 1.06. A little push on it would make perfect sense.
Yes, the holding direction is up with a progression high on the upside, but this could turn into a toss up by a progression low on the downside and a follow through. I am certainly missing the Final Divergence. The Cover Divergence is a disqualified Final Divergence due to the RSI2 low was printed by a candle with its high outside the 30-sample BB.
I did show you that an OliveDrab first encounter prompts a reaction of 50-57 pips.
The patio furniture plot starts at 52 pips (and can go up to 95). It barely qualified for a liquidity break, this move back up. Why do I think this hasn’t sold off yet? For a trap. Currently the bias is neutral to slightly up. A strong squeeze is going on. At 1.0680 the table will flip.
I am 3:2 short:long, but will add short upon clearing 1.0675. S2 is at 1.0586. My second target.
You can make an Army of Arguments why scamming is the sport of this century.
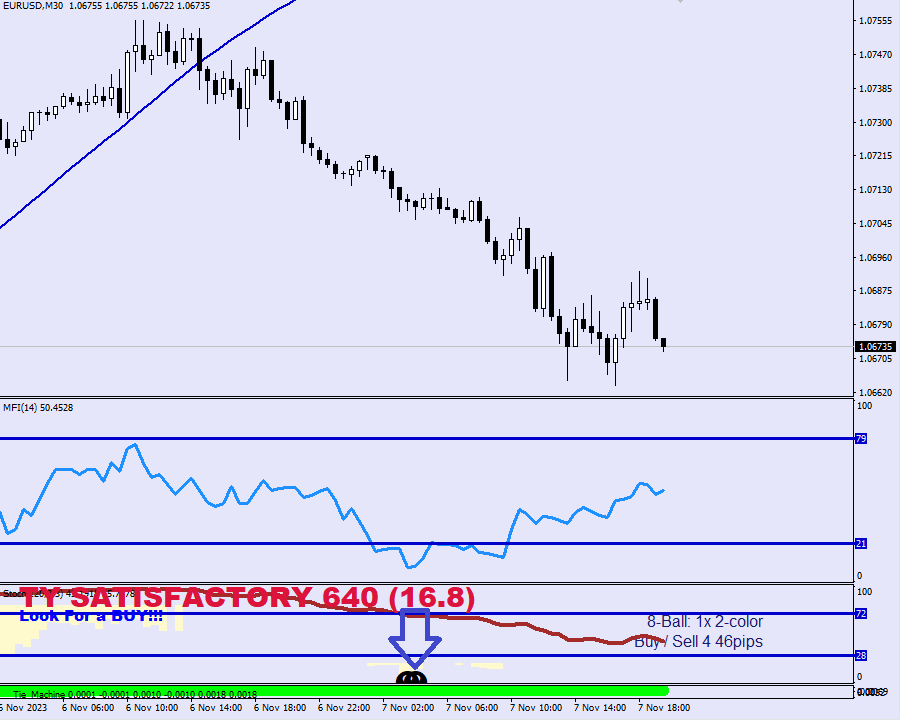
This is a reaction off of the last resistance level. A bounce. We have a new direction, down, but a counter move is in progress to the upper 30-min BB30 which equates to just above the S30 on the hourly.
I expect the upside correction to last 21 hours (disregard), but if price gets above the hourly S30 only around 14 hours (loneliness) then you will have seen the full correction. Also, the high made at the upper 30-min BB should be a regression high, meaning setting up a sequence of lower highs before coming back in.
One bear function that I am monitoring in the background is the widening bearish spread between the E-414L and the E-712. It continued to expand and is currently standing at 16.8 pips. At the moment price is above the upper guard rail, but not by a lot, and if the spread expands to beyond 27, it would melt the ice and provide a moat from price being able to get back below, thus I would expect the move to be stopped by E-712 at approx 1.0619.
Repeat after me, what are we doing here at the Parabolic Snails?
Figuring Out Funny and Puching Faces! Oi-oi!
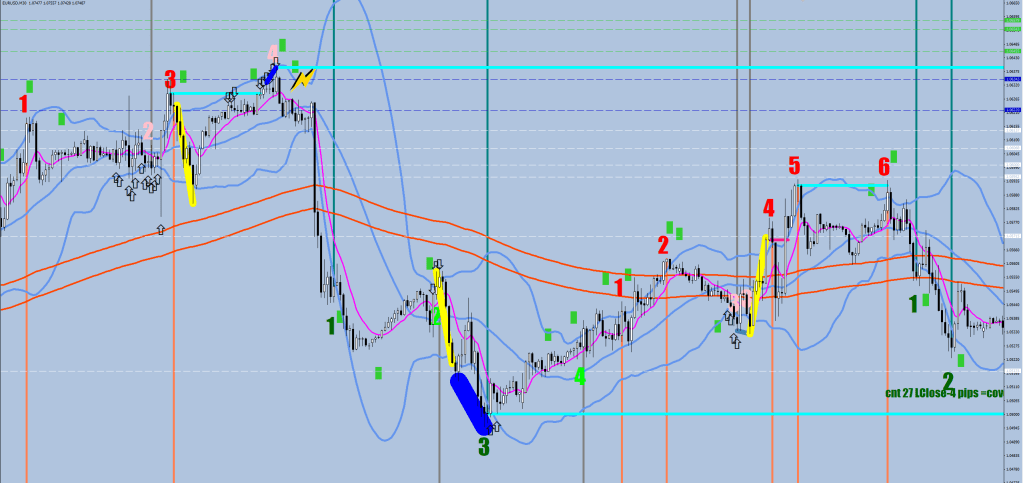
After 2 progression lows, what am I looking for?
I am looking for either a Support Level to print or a Final Divergence.
The Support Level would mean the lowest close in the next 27 candles minus 4 pips.
The Final Divergence would be a fractal that sets up an RSI2 divergence – see code.
/// final divergence on the downside

 if (iFractals(symbol,0,MODE_LOWER,i) && greencount[i]>=2 && Low[i]<iBands(symbol,30,30,2,0,PRICE_MEDIAN,MODE_LOWER,i)+10*Point
 && RSI2[i]>3
  ){
   j=i+1;
   while (j<=i+7){
      if (RSI2[j]<RSI2[j+1]
      && RSI2[j]<RSI2[j-1]
      && RSI2[j]<8.3
      && RSI2[j]<RSI2[i]
       && Low[j]>Low[i]-20*Point
      ) break;
    j++;
   }
  if (RSI2[j]<RSI2[j+1]
  && RSI2[j]<RSI2[j-1]
  && RSI2[j]<8.3
   && RSI2[j]<RSI2[i]
  && Low[j]>Low[i]-20*Point
 // && Low[j]<iBands(symbol,30,30,2,0,PRICE_MEDIAN,MODE_LOWER,j)
  && High[j]>iBands(symbol,30,30,2,0,PRICE_MEDIAN,MODE_LOWER,j)-10*Point
   ){
         ObjectCreate("120BPMMM"+IntegerToString(i),OBJ_TREND,0, Time[i], Low[i], Time[j], Low[j]);
      ObjectSet("120BPMMM"+IntegerToString(i),OBJPROP_COLOR,clrBlue);
      if (RSI2[j]<0.5) ObjectSet("120BPMMM"+IntegerToString(i),OBJPROP_COLOR,clrSteelBlue);
      if ((greencount[i]==3 || greencount[i]==5) && Low[i]==iLow(symbol,0,iLowest(symbol,0,MODE_LOW,70,i))) ObjectSet("120BPMMM"+IntegerToString(i),OBJPROP_COLOR,clrDarkGray);
      ObjectSet("120BPMMM"+IntegerToString(i),OBJPROP_WIDTH,12);
      if (Low[i+7]<iBands(symbol,30,30,2,0,PRICE_MEDIAN,MODE_LOWER,i+7)-120*Point || Low[i+6]<iBands(symbol,30,30,2,0,PRICE_MEDIAN,MODE_LOWER,i+6)-120*Point || Low[i+5]<iBands(symbol,30,30,2,0,PRICE_MEDIAN,MODE_LOWER,i+5)-120*Point || Low[i+4]<iBands(symbol,30,30,2,0,PRICE_MEDIAN,MODE_LOWER,i+4)-120*Point || Low[i+3]<iBands(symbol,30,30,2,0,PRICE_MEDIAN,MODE_LOWER,i+3)-120*Point || Low[i+2]<iBands(symbol,30,30,2,0,PRICE_MEDIAN,MODE_LOWER,i+2)-120*Point || Low[i+1]<iBands(symbol,30,30,2,0,PRICE_MEDIAN,MODE_LOWER,i+1)-120*Point ||
      Low[i]<iBands(symbol,30,30,2,0,PRICE_MEDIAN,MODE_LOWER,i)-120*Point || Low[j]<iBands(symbol,30,30,2,0,PRICE_MEDIAN,MODE_LOWER,j)-120*Point) ObjectSet("120BPMMM"+IntegerToString(i),OBJPROP_WIDTH,44);
      ObjectSet("120BPMMM"+IntegerToString(i),OBJPROP_RAY_RIGHT,false);
   }
 }
Both of the above mentioned outcomes are contingent of price not touching the upper Bollinger (30 sample). If it does, the correction is no longer considered a clean run, but a mixed sell off and the progression low count would go up to 4, 5 or 6.
Weekly pivot at 1.0631
So what is the difference between support and support, if I already know S1 and S2 ahead of the time? They are statistical high probabilities. The actual support level printed by the market would likely fall close to these.
Uneven delivery highlights the 1.0635 and 1.0658 levels.
The two spin out zones have their supports almost in line, and if you imagine a line that would come to 1.0622-1.0618.
All you need to know now is wait for the plot or count 27 candles and put out a pending buy or sell the upper BB and above if that one comes accross first.
You are looking for a 30-minute fractal print, that comes within 3 pips (normally over) the most recent high / low & is within 8 candles of the recent RSI2 peak’s print setting up a reversal divergence.
Of course, the current candle is not gonna be called a fractal until 2 more candles on the right making lower highs.
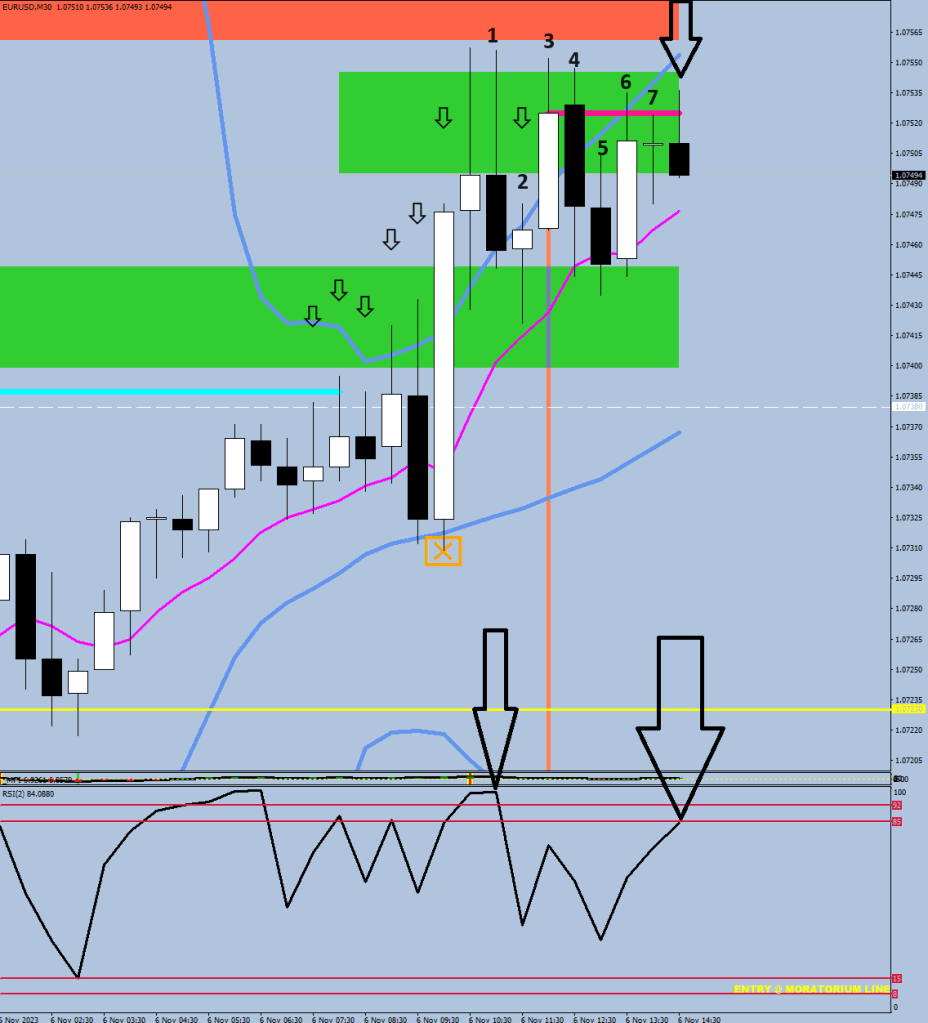
Also, you want to have seen 3 progression highs on the upside and 2 on the downside to even start looking for a Final Divergence.
The RSI2 basis has to be halves, not Closes.
…Fractal granted. Final Divergence plotted.
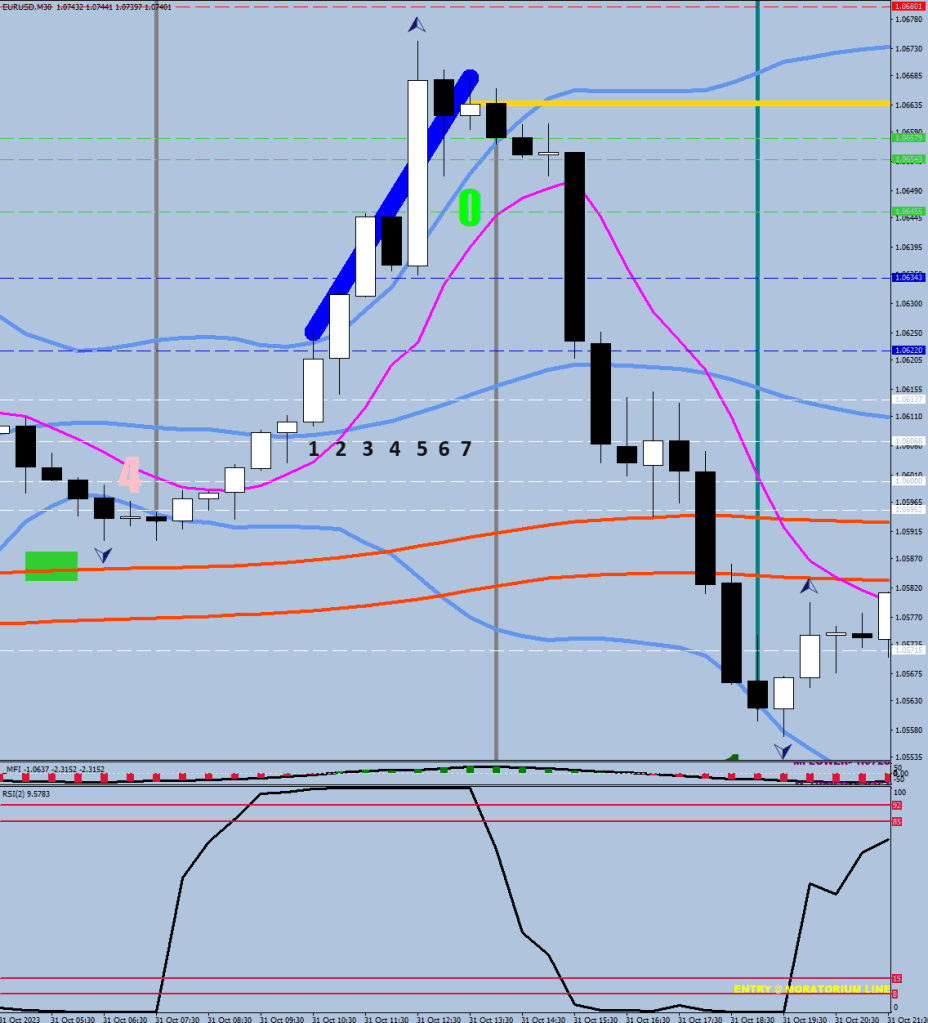
Here’s the code for the final burnout: pedal to the metal RSI (>99 / <1) for 3.5 hours straight (7 candles – after Progerssion Peak 2 / 3 again).
/// final burn out on the upside

 if (redcount[i]>=2 && RSI2[i]>99 && RSI2[i+1]>99 && RSI2[i+2]>99 && RSI2[i+3]>99 && RSI2[i+4]>99 && RSI2[i+5]>99 && RSI2[i+6]>99

  ){
     ObjectCreate("120BPMMM"+IntegerToString(i),OBJ_TREND,0, Time[i], High[i], Time[i+6], High[i+6]);
     ObjectSet("120BPMMM"+IntegerToString(i),OBJPROP_COLOR,clrBlue);
     ObjectSet("120BPMMM"+IntegerToString(i),OBJPROP_RAY_RIGHT,false);
     ObjectSet("120BPMMM"+IntegerToString(i),OBJPROP_WIDTH,22);
   }
You simply cannot say that you are not learning anything here.
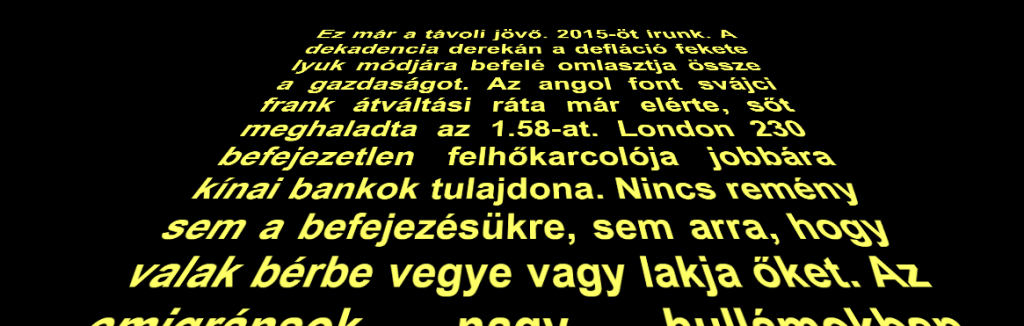
You coud already sense my engagement with forex, as in the scroller, the second line (after briefly mentioning deflation) I was citing the CHF against the GBP topping 1.58.
In this game idea of mine, your character was a Weird Al look alike.
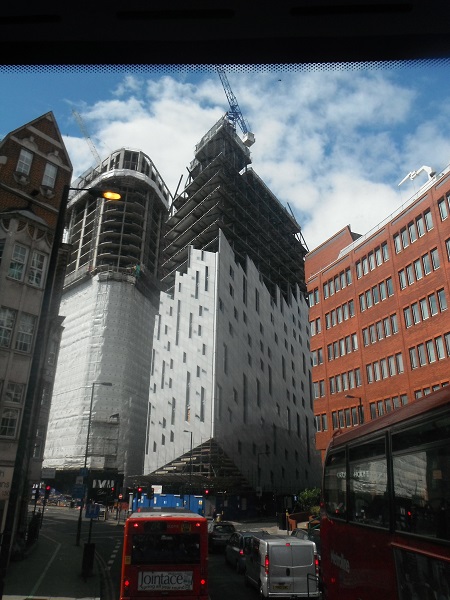
The game was sniping off the H2 tanks on top of the new buses. If the tank you hit escaped and tackled the skyscraper you were on, you lost one life.
Yes, I know what you are thinking. Yes, I took that picture and the bus was the famous 205.
This I can’t explain yet: the final divergence (Blue) on the upside always appear after an Odd Number (3,5) and always after an Even Number on the downside (2,4,6).














 ForexFore - Internals, indicators, algorithmic trading