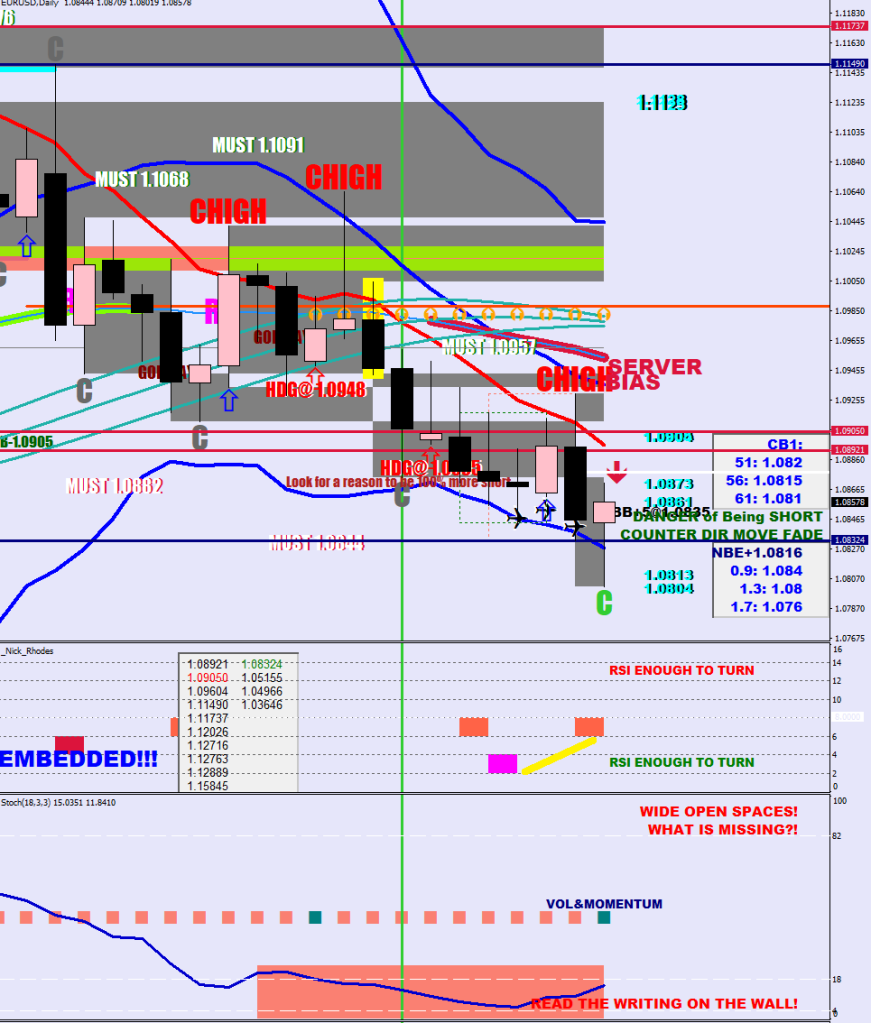
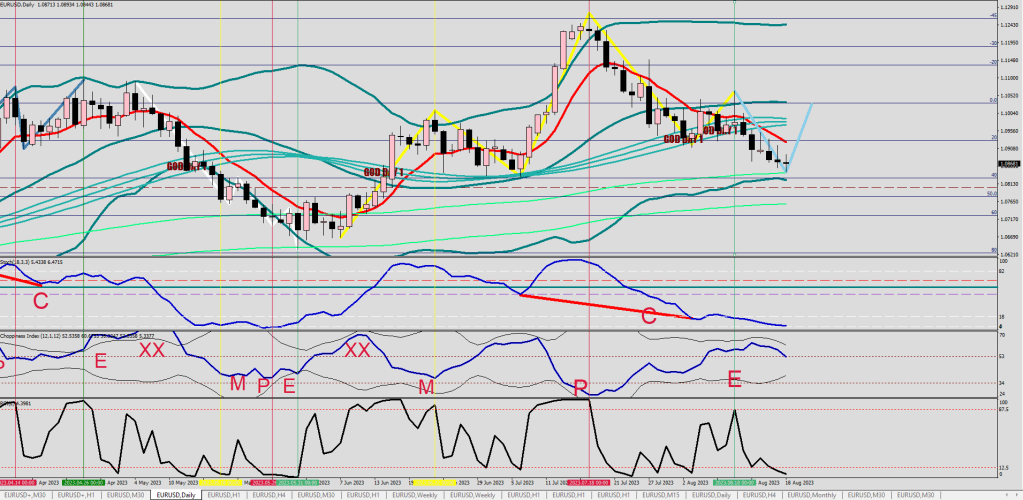
The move that is missing here is the backtest of the 50 EMA band.
We have seen 2 cover lows with a capitulatio and a reversal divergence.
The 30-sample daily BB was touched. Wave 4 up can commence from here.
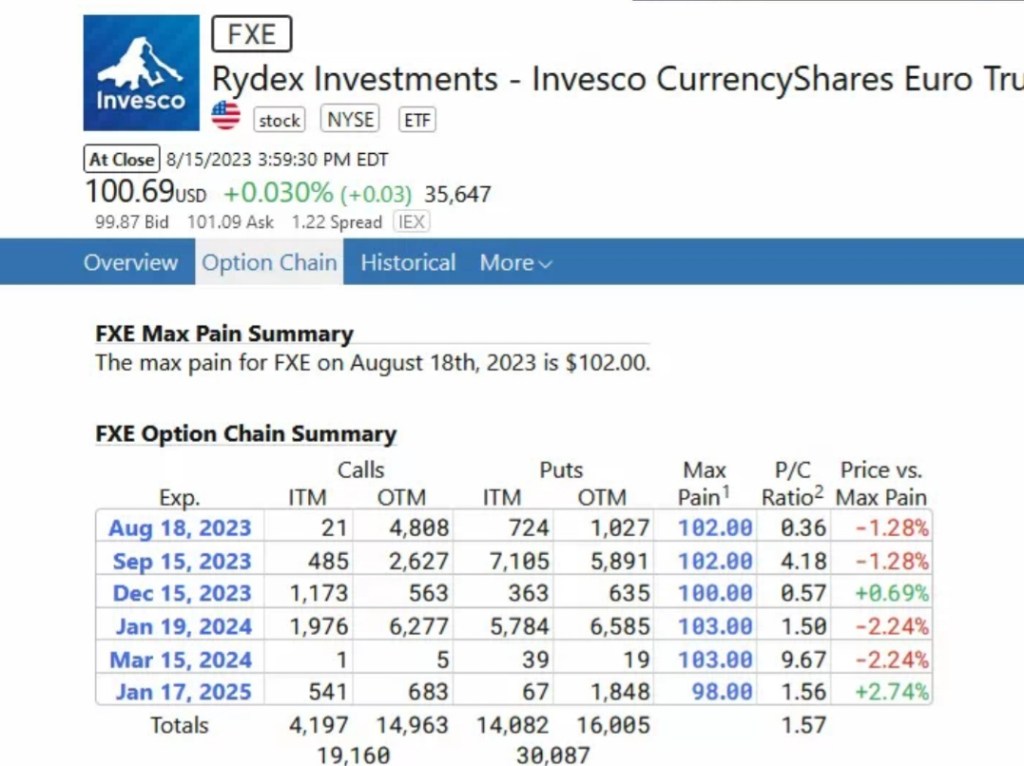
The Hourly is going into a squeeze, there should be 160 pips on the upside from the current close. 1.0950-60 may be the target area without an overshoot.
The first thing to say is that the distance beteen the final left shoulder and head is often 100 pips.
(Will insert more images after work)
The second thing is the daily close that may be tipping you of about what was to happen overnight / the next day.
The lack of re-balancing counter directional move means holding. I am monitoring for 27 pips.
It looks like I also have an E44 filter.
You would normally have a number of daily BB breaches leading up to the flush.
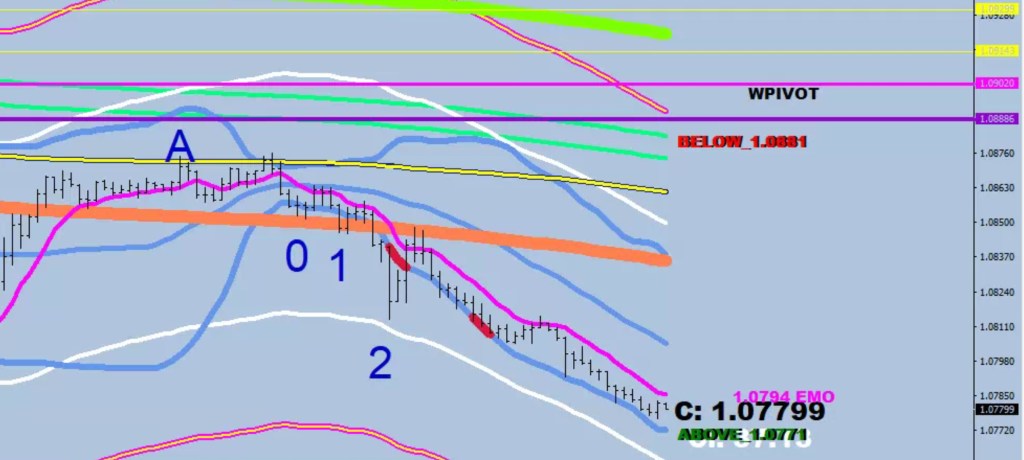
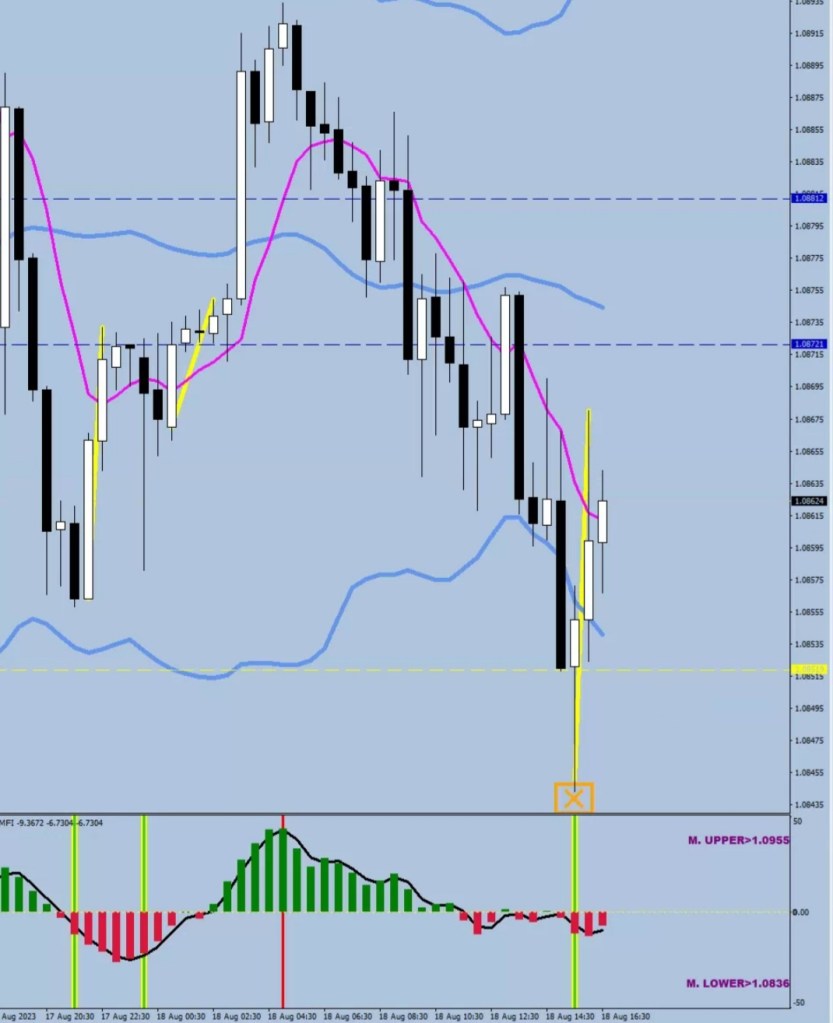
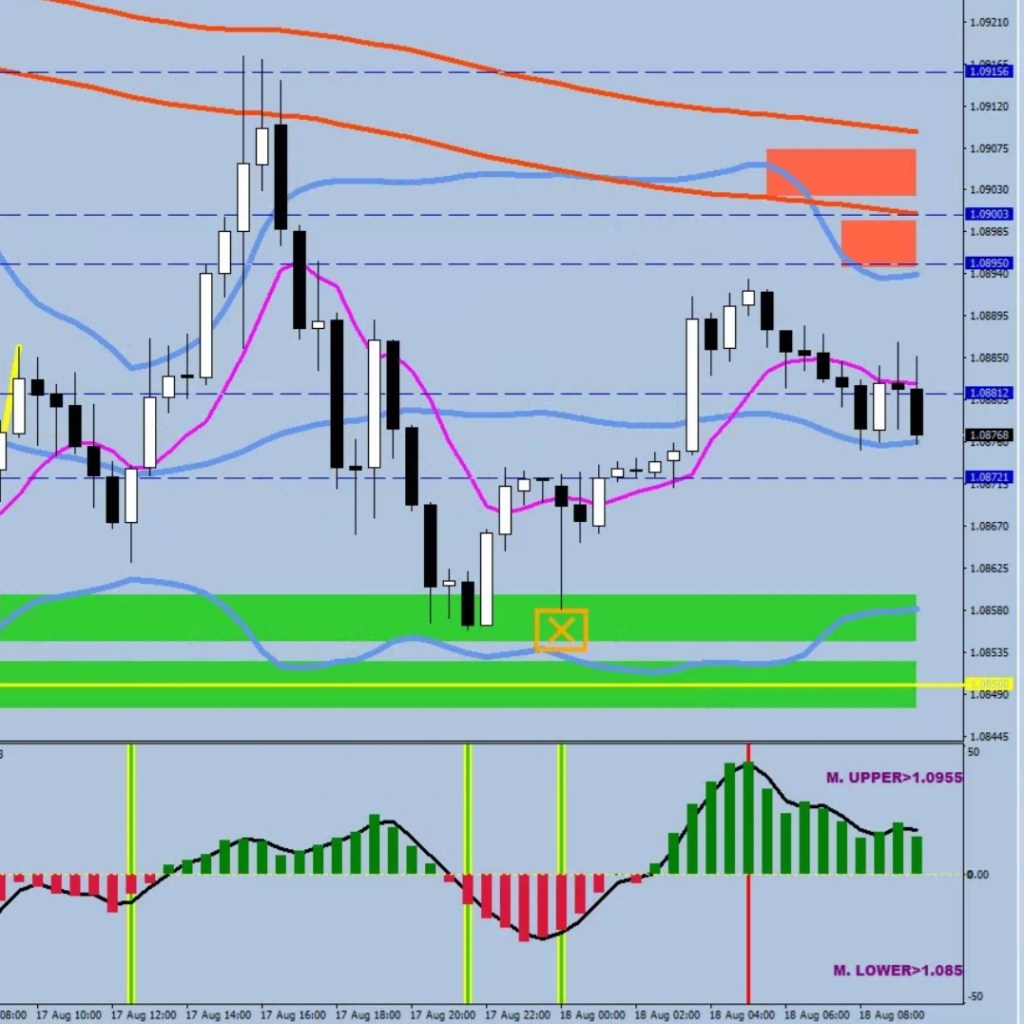
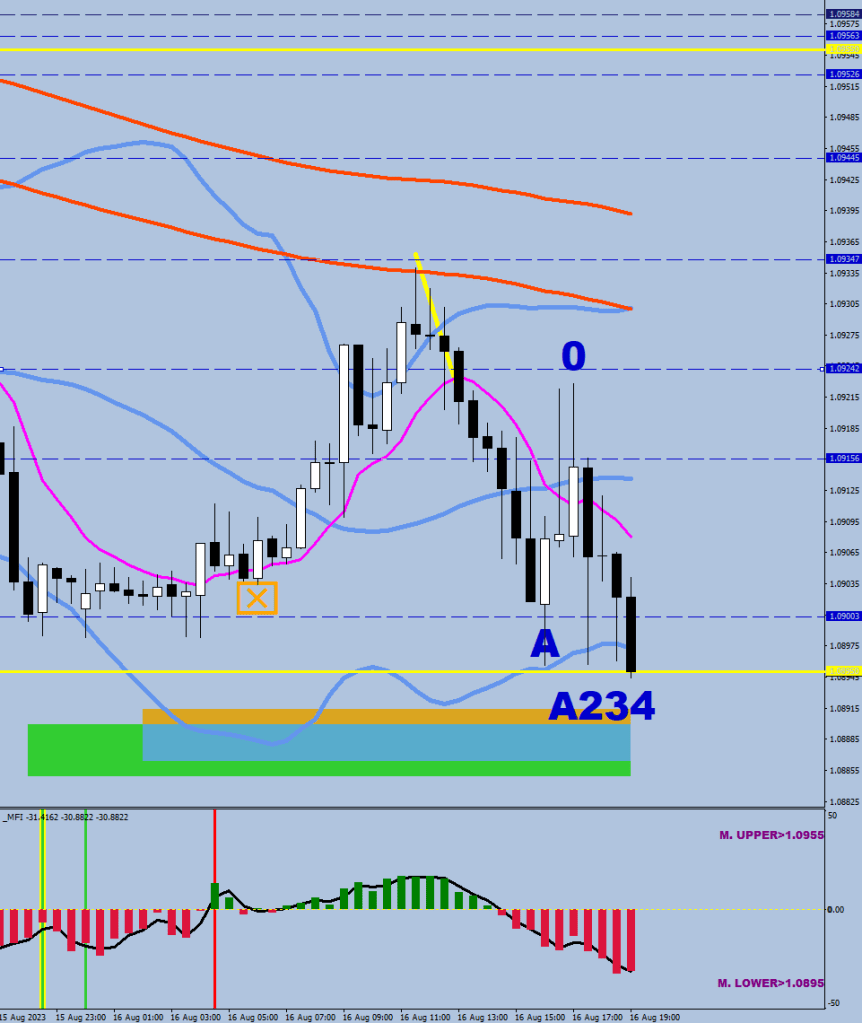
The latest tool in the box is the 30 min 240 sample BB: the daily close 2 sd away is a useful warning.
Blue is the 2 sd band, blue + yellow is the S240 HL2.
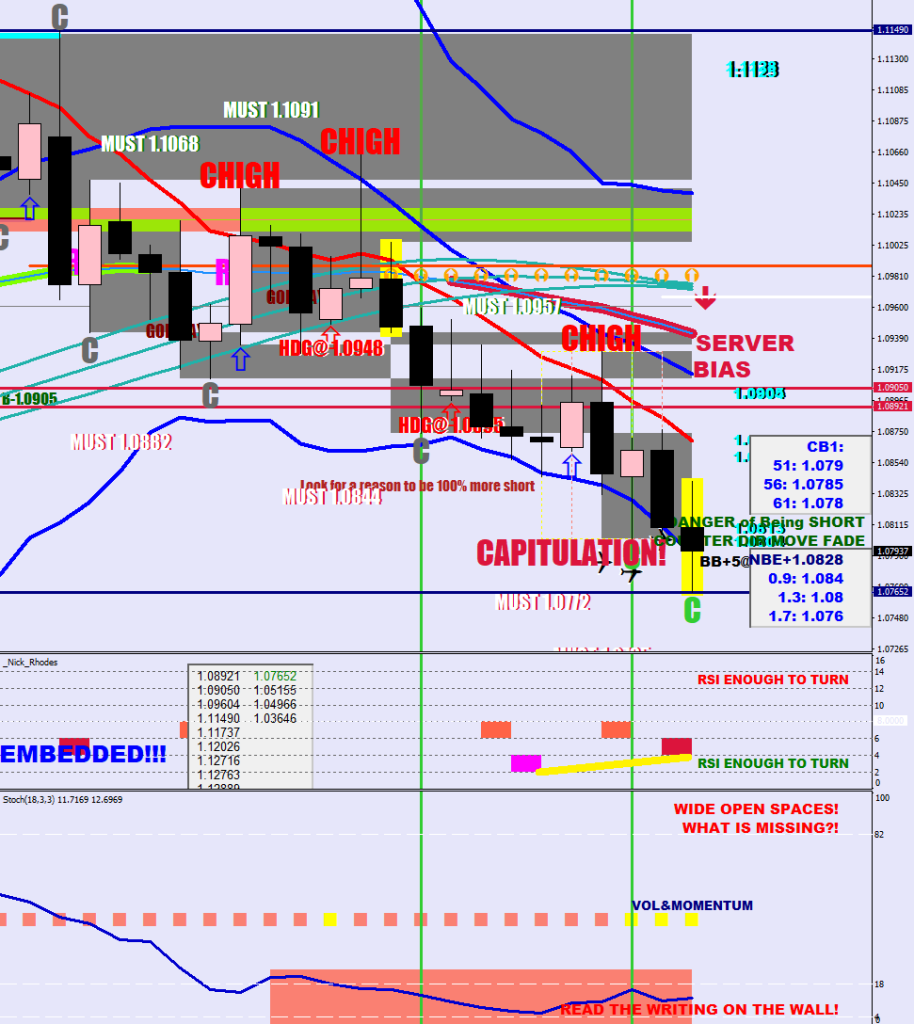
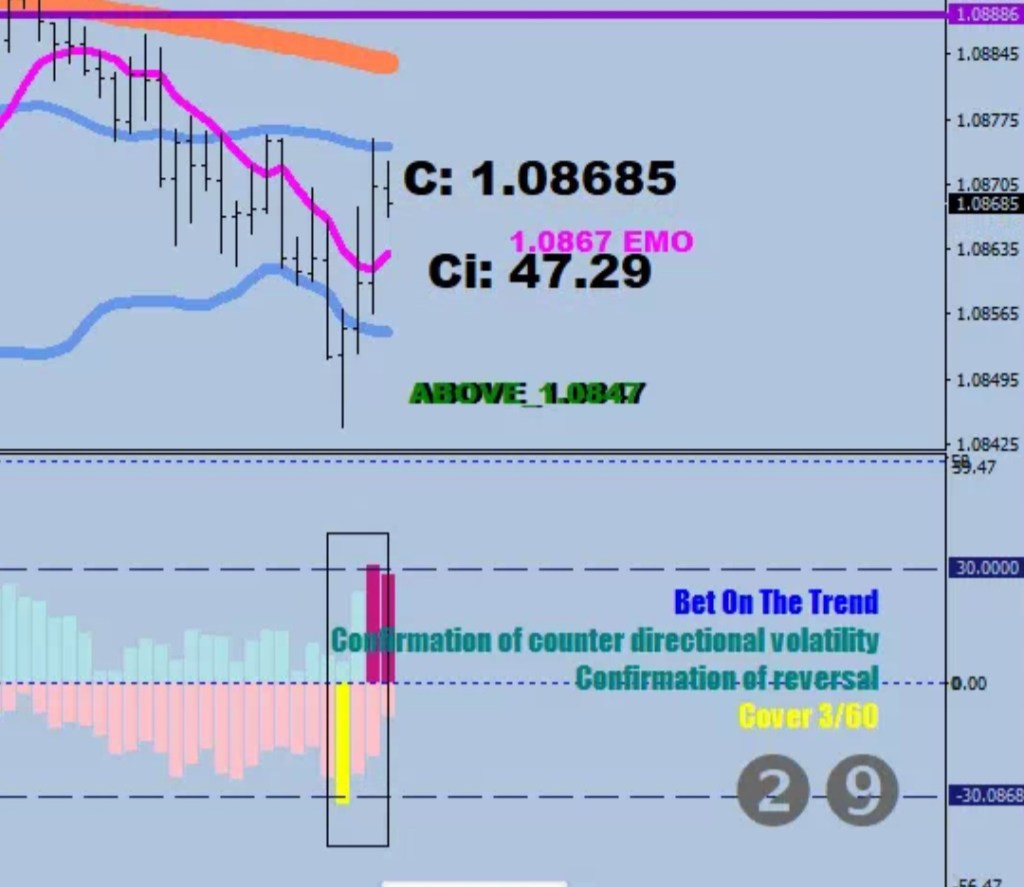
Capitulations can be rather large. One way to measure their strength is relative to the previous low/high they just surpassed, but there is also the spike pullback (last fail to close back beyond the 8 EMO this was at 1.0814) and go with the 60-100 pips stats.
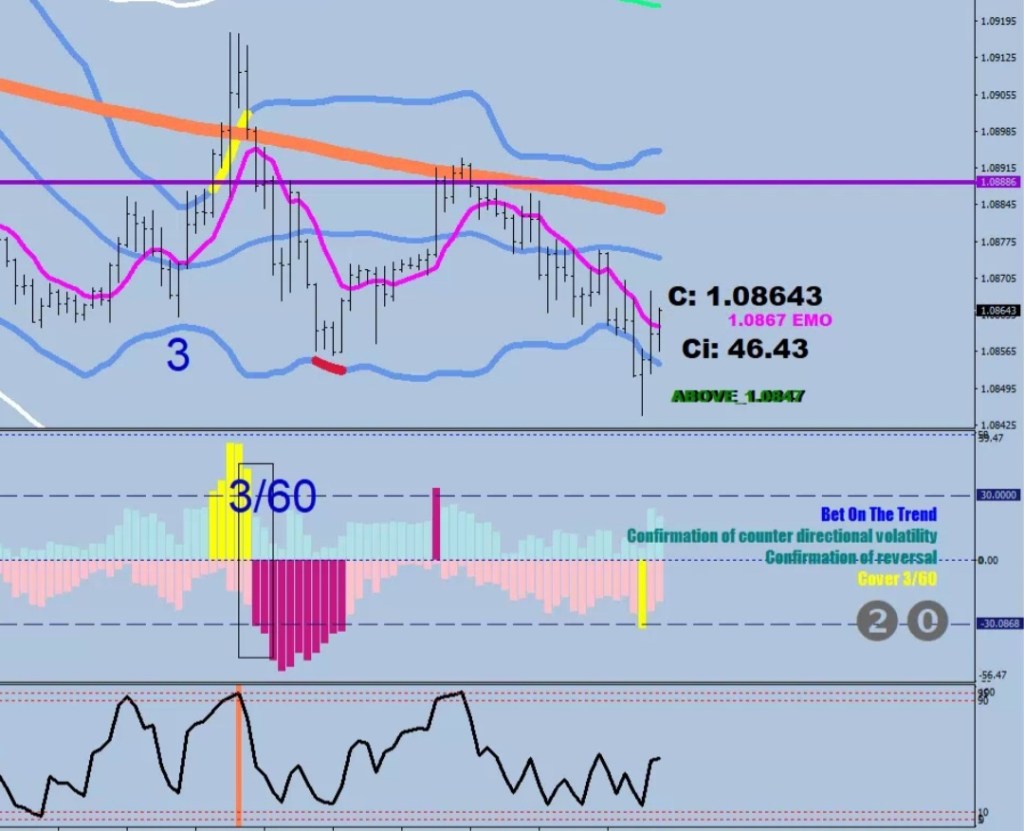
Look at this caution of not getting outside the BB for the 3rd time:
Spike 3 still has not been outside the BB.
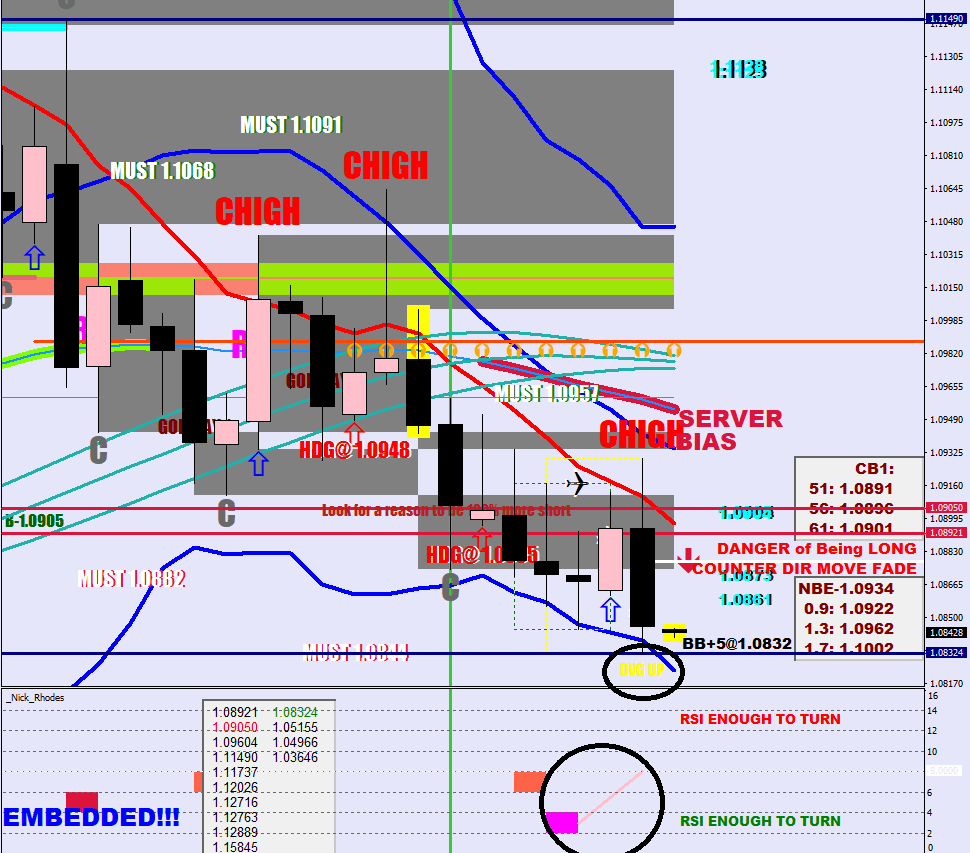
This is how the embedding neutralizes the opposing momentum:
I’m thinking to change the greens to gray during embedding.
This current move with today’s beat and the reversal divergence speaks of a Wave 3 ending.
A Wave 4 should conclude with a daily RSI2 above 87 reading whilst price would have to be below of what Wave 2 produced (1.1064).
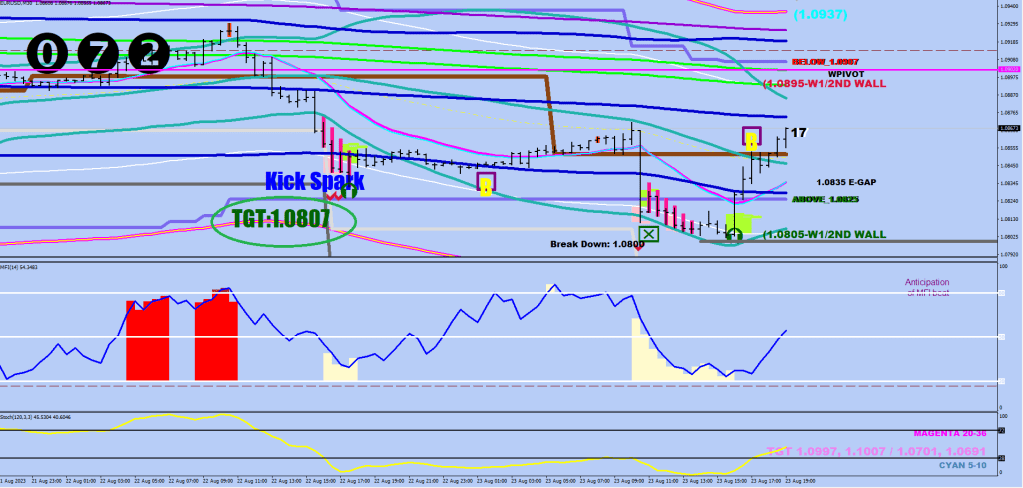
…I need to improve on my targeting. I have projections…
…that I ignore based on lack of counter volatility. What I need to settle in my brain right, that if I got in at the right prices, there is no rush. Target the projection and lock in gains with the protective stops and let the whole thing develop.
I had 25, 26, 27 filled in for targets for a slight undercut (F for Fawed thinking), but could not wait it out as per usual (F for Fawed execution).
For scaling in and sizing I get a BB+ for Bigger Balls next time.
There is definitely something odd going on right now when everyone is trying to be first to assume a crash position. The market makers aren’t famous for handing out free money.
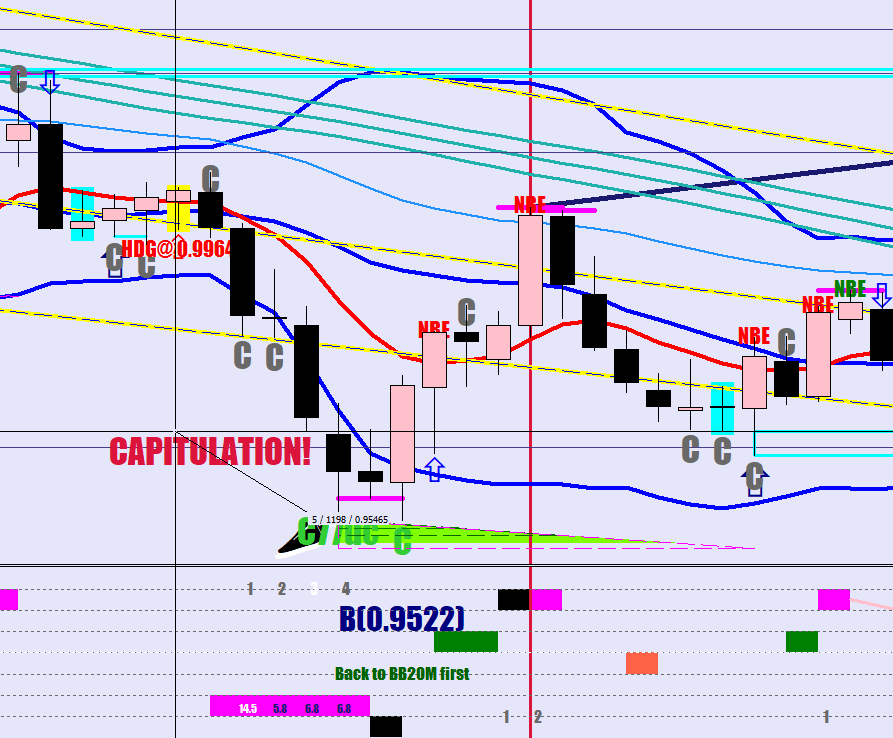
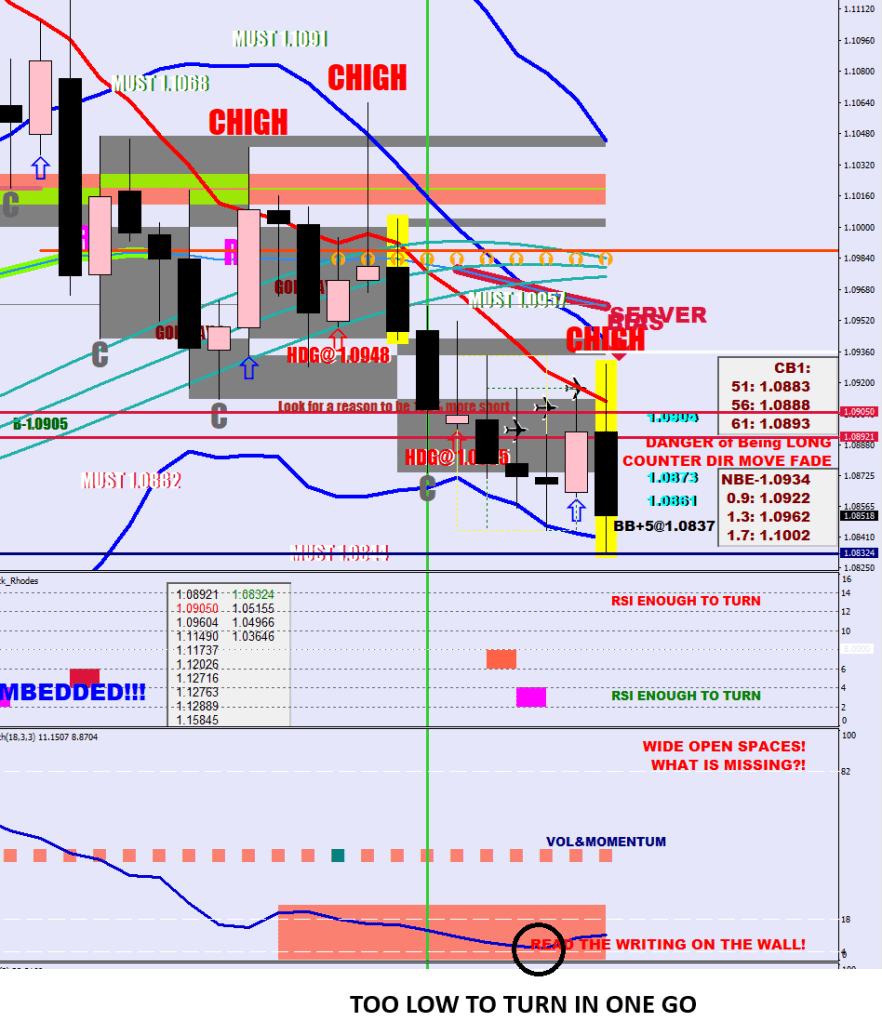
When the market goes deeply oversold, it is unable to carry out a sharp turn, it has to do it in 3 steps with a relapse in the middle which sets up a reversal divergence.
For a kick start low the stoch18 below 9 is too low. On the bright side, this market is turning back up.
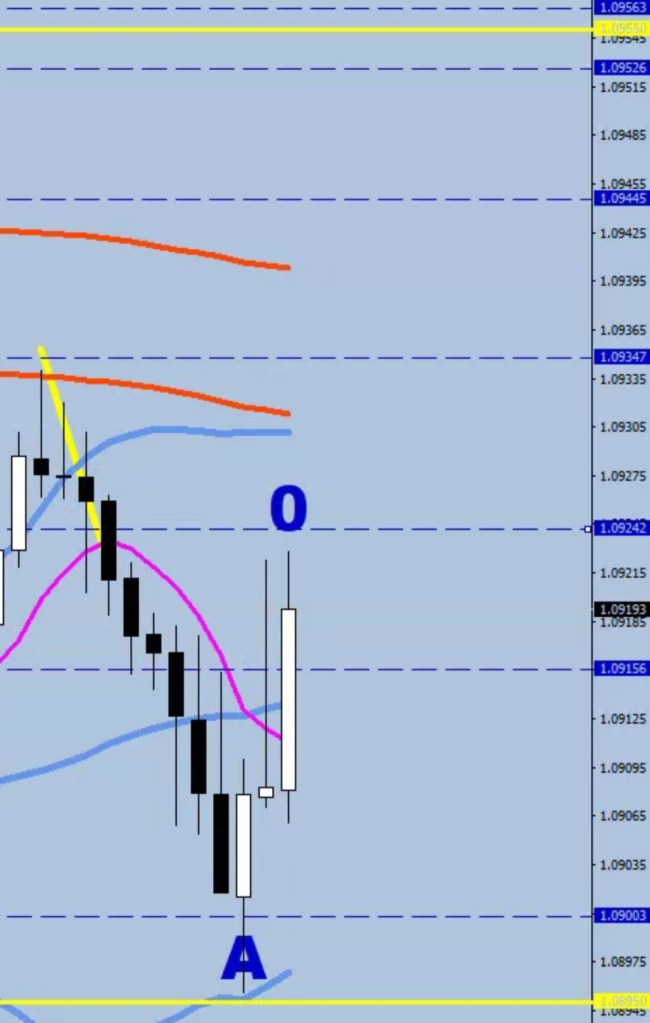
The relative location of 3 to the Green River is also interesting. Weren’t these hijackings? Point of view, I give the benefit of the doubt to the Zero not the Aggressor, as the latter steps in front of the current direction.
There’s one more tip.
Evaluate the printing of a reversal-low.
If there is going to be counter directional volatility within say 5 hours (10x 30 min candles) from the new low, you have a usable low. If the market just go sideways after stepping back inside the 30-sample Bollinger, and does not care to cross to the other side of the 8 EMO, then another low would be coming after some consolidation. White ovals.
My car has no engine, stop acting new, I bet you could win.
Zombie eye colors, I’m in love with another song.
Vicious blames….
My life goal is to get my name registered in the Something-something Almanac between Shapiro and Sharapova.
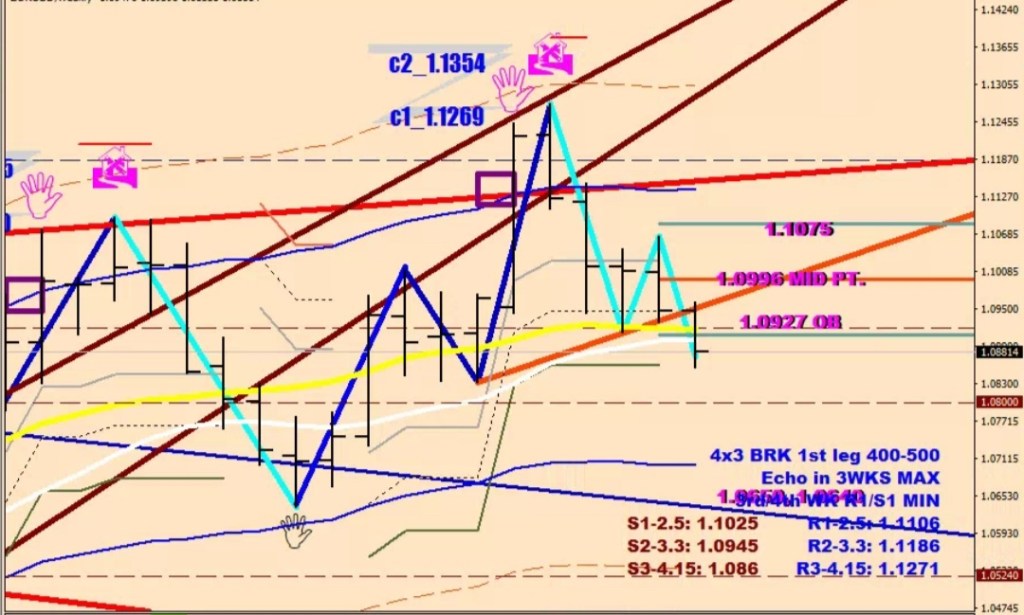
The second Cover high was the Wave 5 up. One of the weakest echos I’ve seen. My thinking is a volatility whip back up to the right shoulder’s hight (1.1035+, could go a bit higher than the 1.1064 echo high as well but I don’t think it would likely not get to the 1.1149 swing high ) before the Wave 1 down.
So my plan would be matching the short holdings around 1.1030 or even earlier if I see 3 failures before that, then building a short holding the higher price gets.
This unraveling of Euro long holdings would have a long long way to go down.
The “dollar peaked” theme on Bloomberg was shining bright inside my ear today. That’s the honey trap.
You would be right to tag along. For 77-90 pips that is.
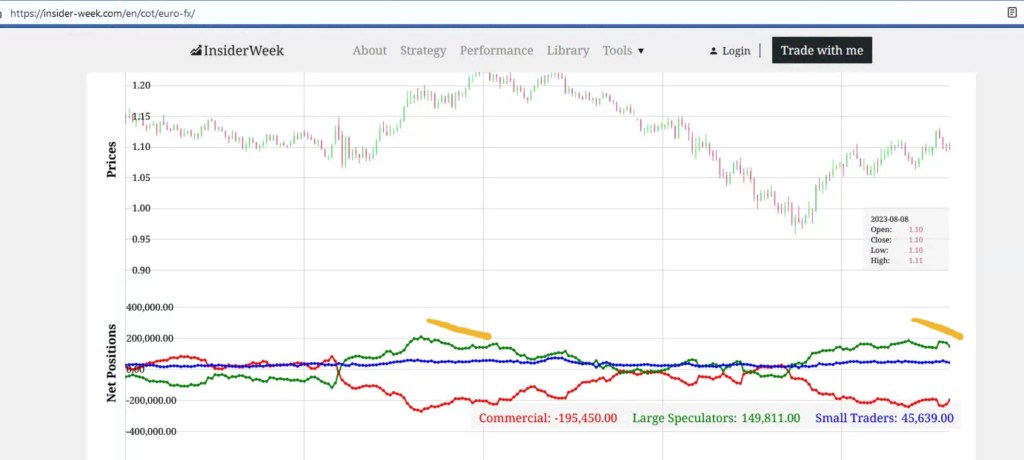
The direction gets decided by the large speculators by either taking a loss or by reversing their positioning (cross & stay on the new side of 0).
The hedgers don’t get any decision rights.
Their ability to go into a paper draw down without limits guarantees to not be the one having to stop out. They don’t ever blink first.
Once the loss is taken by the speculators, they get to write off those contract-burdens which increases their account size. On top of this they have a steady stream of income from every transaction.
The loss taken thus shows up as a divergence in the price movement and the holding size – this is the starting point of unraveling that goes on until 0 on balance holdings remain in the hand of the speculators.
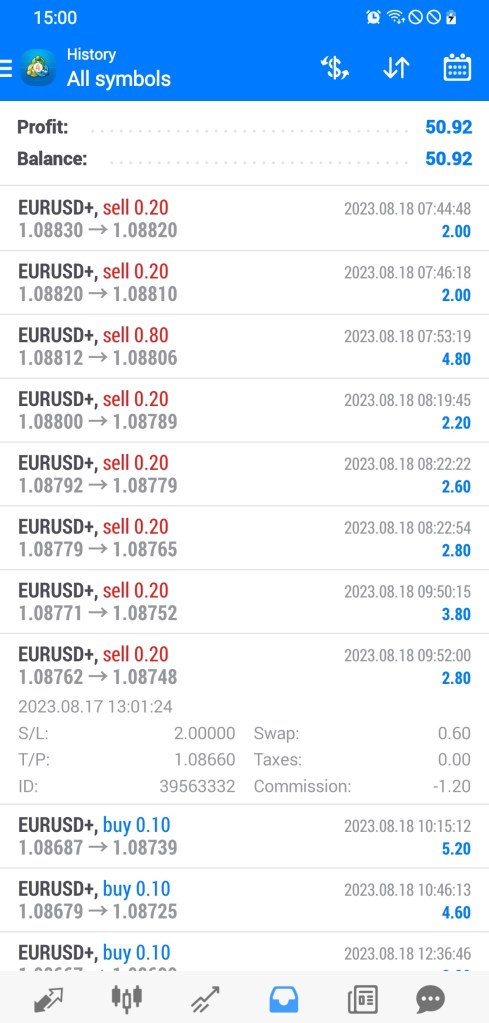
Other. I need to ditch habbits like closing out core holdings before the 3rd cancellation and develop the habbit of marking them up along with the anchor highs & lows and adding a reminder of 3/60 every time. New virgin level made at 1.0852
Today closing out 2.2 lots of core (hedge) holdings for a total of $16 let me endure a $750 draw down unnecessarily. This is why obeying the count and sticking with the anchor provided direction is a must.
The one yellow is in place, two plums up on the histogram and the 3/60 anchor low would be made.
Hedge shorts, $350 left on the table just by not touching anything today – and most other days.
I got myself paranoid instead of counting to 3.
…anchor low made. There is no better system out there.
First, let’s gather some thoughts around this squaring:
The first question about this Aggressor that got squared (the two upper wicks coming back beyond A), who is he to have enough market moving power to push price back up to be able to get out of the market better than flat?
Squaring is a market maker tool, this is how commercial hedgers get back their money after being in draw down (sometimes for a year).
Of course, if you are not market maker sized, you can tempt their thirst for liquidity. Say you put your target to break even and sweeten the deal with the same or larger size pending order in the opposite ditection. Around the end of the day, if your orders are within 20-30 pips, there is a good chance they would be reached after for pairing orders out taking the commission.
Now let’s talk about the market setting divergences and not being able to reach the lower 30-min 30 samp. BB mean. It means a much too oversold market with no new money coming in. There would have to be discount given to attract more downside commitment.
I would list positioning under market mechanics.
It is an opex Friday, pegging is a likely event until the hour of expiration.
1.0860 is the statistical weekly S3, it was the reason for closing my short order. 1/2 a pip off the low print.
I could picture a bounce back up to the red neckline-trendline before continuing lower.
& there seems to be no predicting power for which way price would end up breaking.
Somebody looked up my Hijacking #2 post. Since there is FOMC today, this is good thinking.
You can see the clear and present Aggression coming from below. The 2nd “0” attempt is going on right now. After the close back candle prints at the upper 30 nin 30 Bollinger, the break out setup will be in place.
Aggressor pulling down pants. He got squared since.
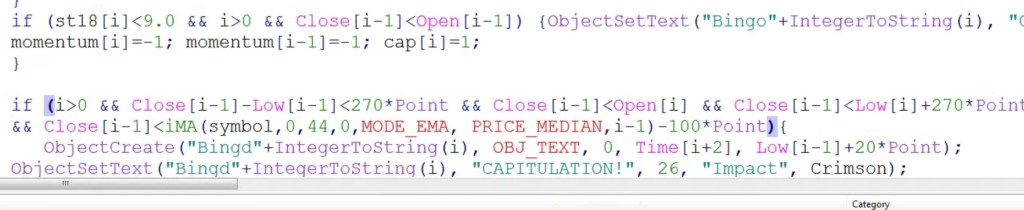
Today’s topic is preparing for the 3rd spike out.
The hot mess with the black frame (& count 3) was an anchor high.
So far we had 2 spikes outside (yellow impressions down on the histogram) and the 2nd one made a coast lower to set a reversal divergence.
The 30-min fractal that prints inside the 30 BB would be a D| or a D-pitch.
Normally the last spike would come from the other BB, but since it is too far away, there could be an aggressive Zero response from just beyond the S30.
The last spike is usually very strong, from the 0 it can go 58-100 pips. Also, becoming parabolic is a possibility which would mean more divergent pitches until an anhor low gets made.
The mentioned 1.0820-1.0810 is quite possible now.
Astonishing stuff. Eric gives a boost to Dave Gahan with samples borrowed from earlier DM albums such as the Violator, the Devotional etc. Too bad not many have heard of him.
Trading appendix.
Dr. David Paul said: when you need to go long, you would not want to.
If the market is not going after the 1.0821-1.0811 end, then it is going after the 1.1117-1.1127.
I was asked about support / resistence lately.
The daily 50, 20 and 9 are converging as we speak. It would be terribly easy to flip the boat, an 80-pip, regular daily ATR move would do it.
The momentum is up for the 2nd day.
If this would pop the upper daily Bollinger, it could use it as a conveyor to work its way higher.