Letter

(may be useful even without links)

There is a lot to get lost in, but I would not start with candles.

I would look at videos from the Stoic Trader first and perhaps some We Trade Waves videos tho get a feel for pivots and consolidations/continuations as well as how market makers drive the price to obtain more liquidity (margin calls = money flowing to the broker either from the trader’s equity or from new deposits). You can try Fx Pip Collector, but do not get too deep into Elliott Wave. 

Elliott Wave Options deals with some additional TA, I watch Ron Walker’s The ChartPatternTrader (DeMark counts & divergences) and Mike Jones trading for some additional info.

Northman Trader is best to get a grasp on volatility compressions and higher timeframes & moving averages.

As for candles, I find dojis very important for targets & fake outs and there are some candle combos that are great hints such as the 3 marching soldiers. Dojis are often sophisticated accumulations for larger volume.

Bulkowski has a web page about chart patterns and the 3 domes and the house on the peak and its brother are recurring themes.

The flat top – drop idea is from Oscar Carboni.

You already know that I am a moving averages guy, I give lots of credit to the hourly metric and I count closes / separations relative to the 8-hour EMA of opens.

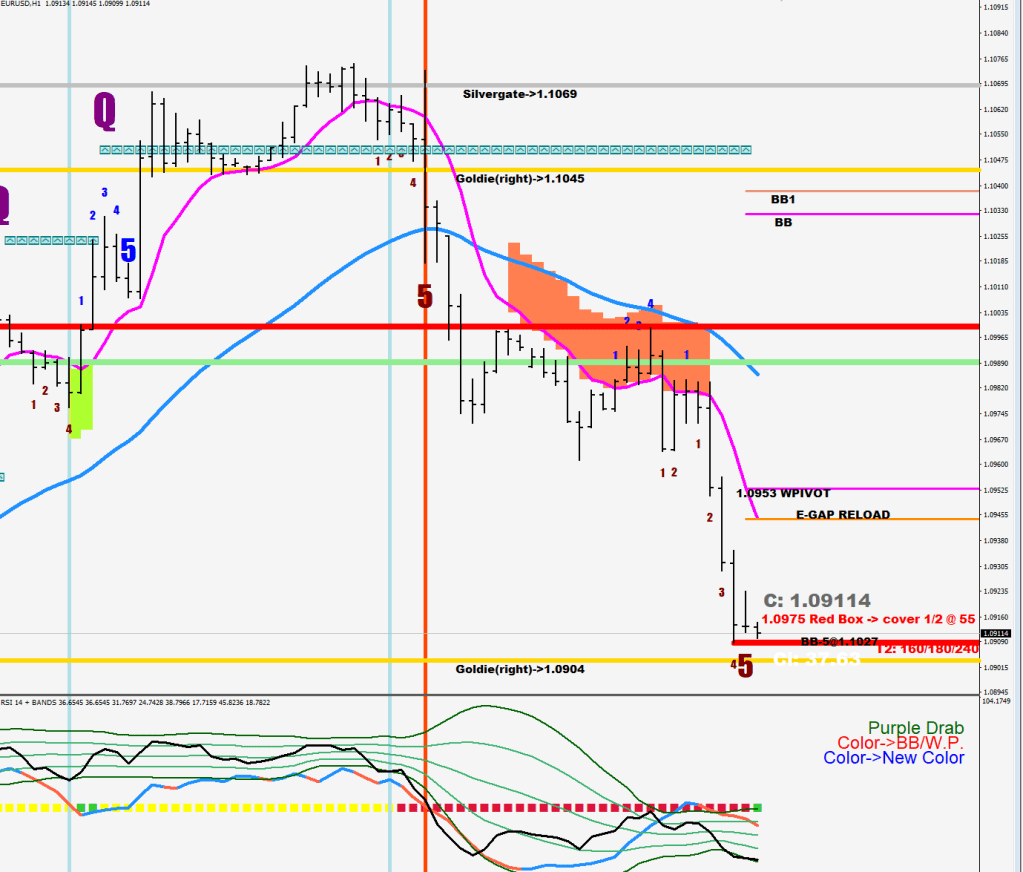
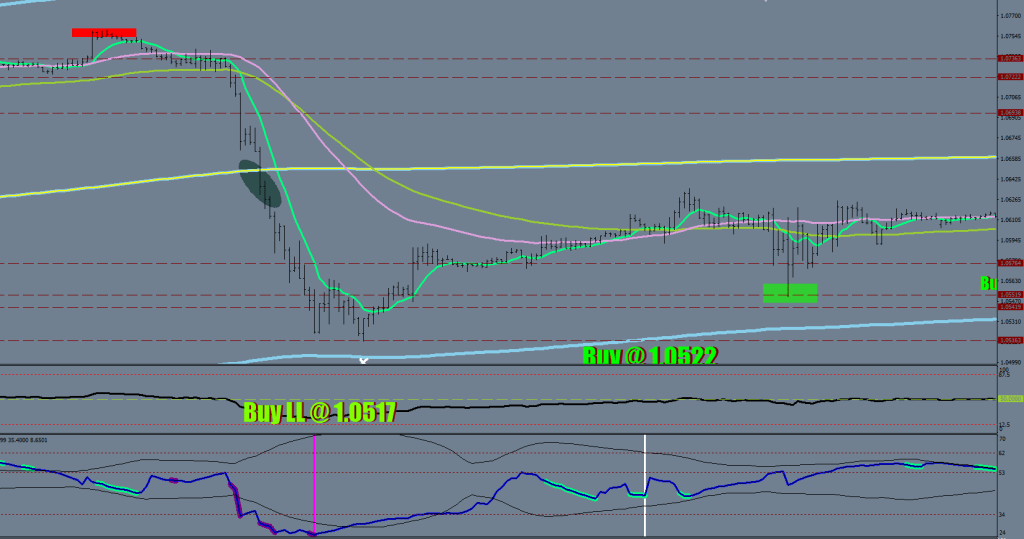
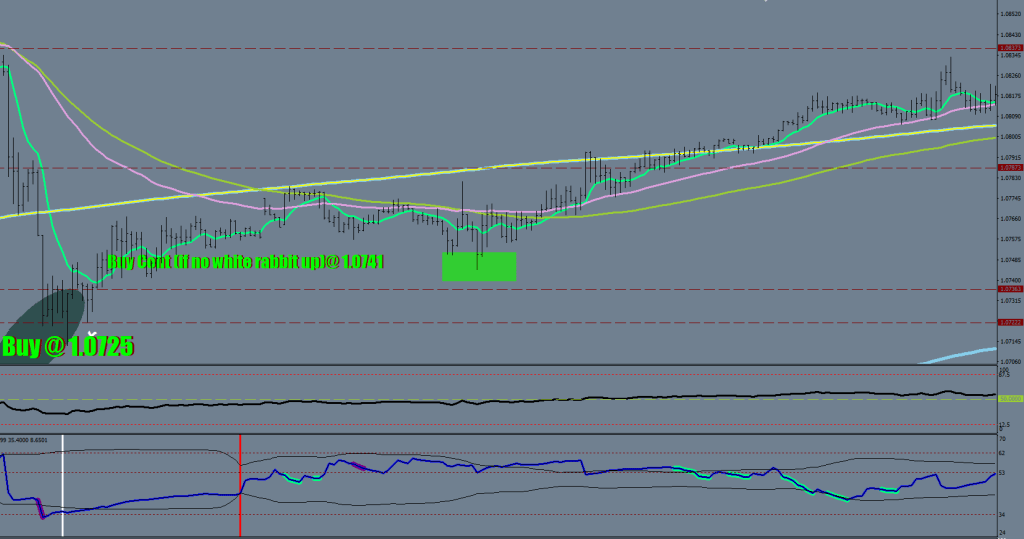
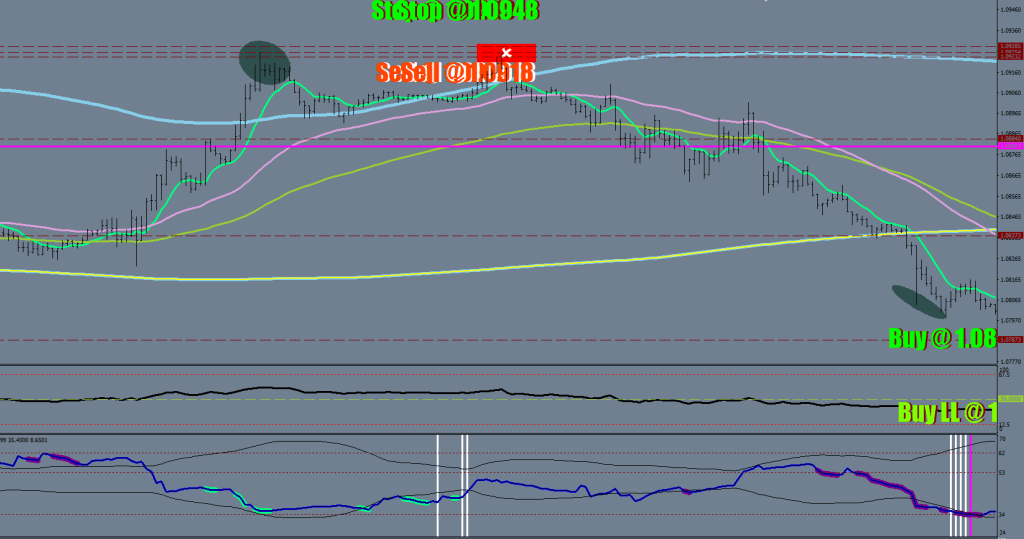
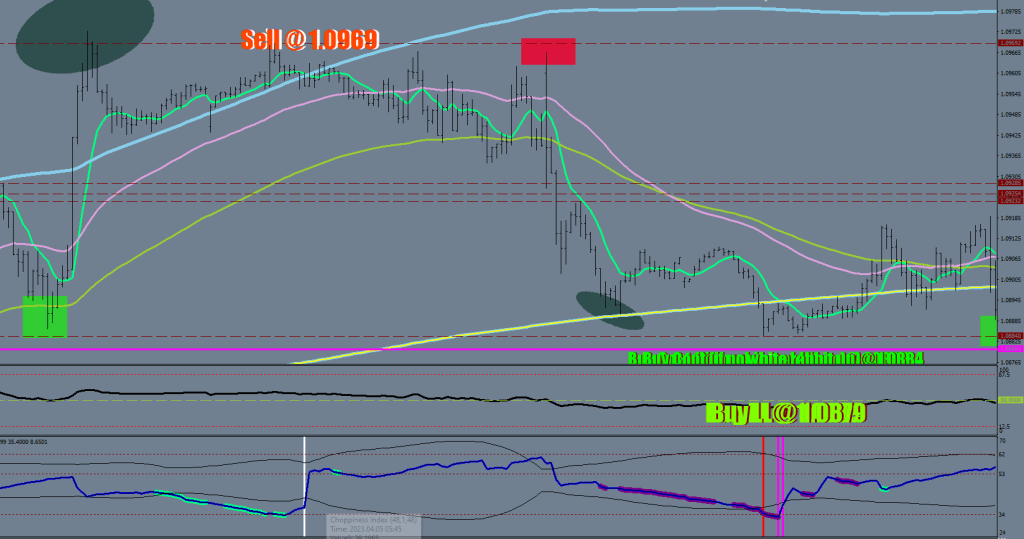
The ink hasn’t dried on the echo, but for now price fell shy of the Check Point 1. The 3 numbers on the bottom rights are the “home” candidates for a market staying bullish. For a more sideways market, the lower red line comes in play.

The last sell call came with a moratorium of 30 pips. Again, just shy.

I now plot the numbers up to 8, within 8 the Gear must be decided for or something else is cooking.
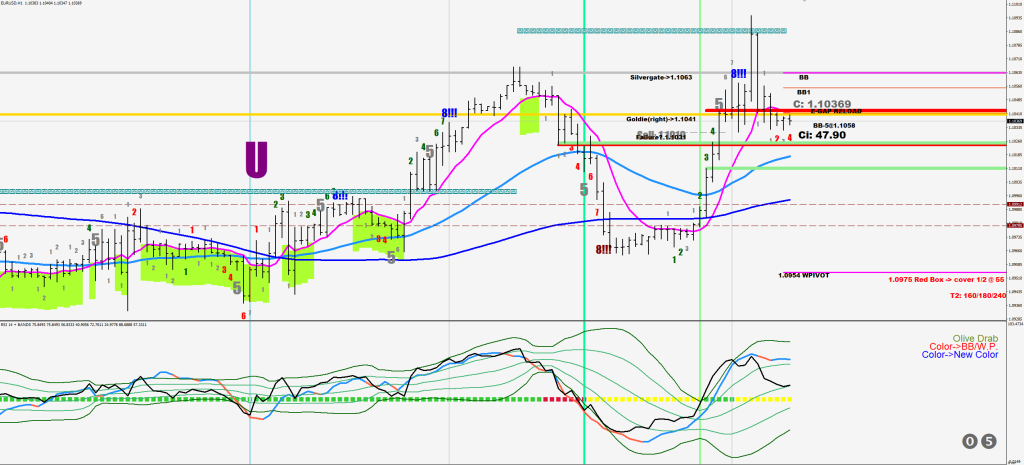
Looks like they want every bit of liquidity they can get.

A close below 1.0880 would be an indication of leaving this zone.
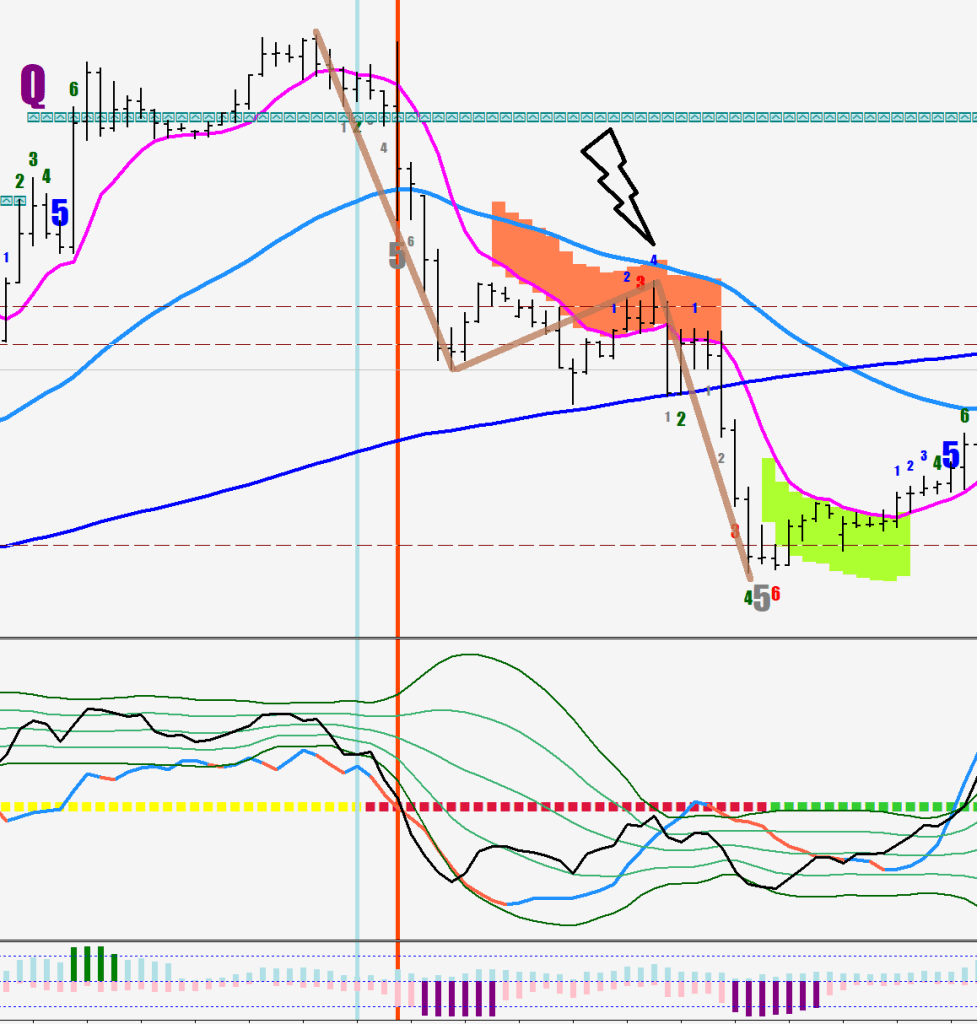
The Gear Selector

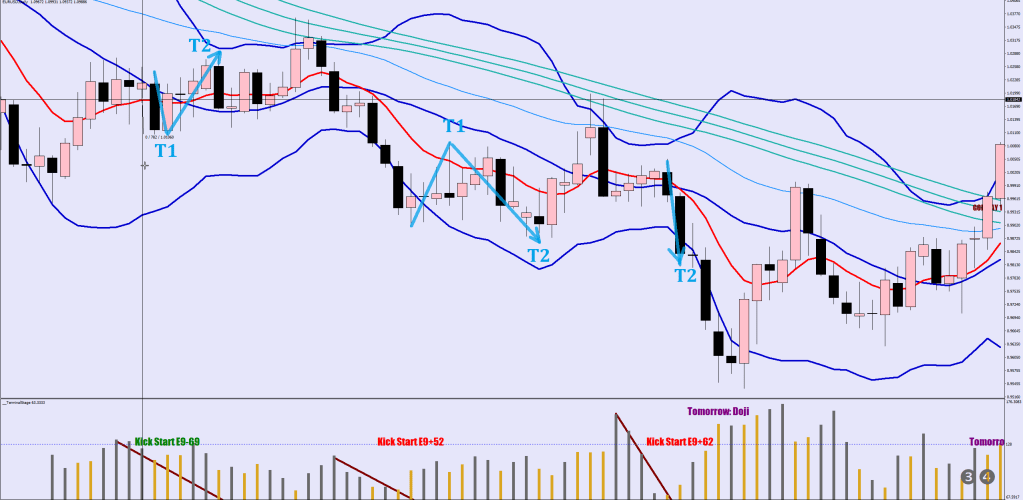
First, let’s talk intermission. ABC corrections in a trend.

The take away from the first two images is that the zigzag has only one episode where price produces a count on the B side of the Moon.

Zeus points at a #4 up there.

Let’s see what we could conclude with this next one. Can you see the ABC looks? How many #4s were printed above the 8 EMO?
So that’s for the zigzag part.

How about a trending leg? We need to examine the 3 Lucozades. It seems, getting in on the 2nd hourly close would had proved to be a low risk / add on entry for 3 shots The last one was waning a bit, 2 more closes printed – early warning. The gear selector refers to the key number. It could be something from 2 to 6.

6? Yes, a trend may be kicking in extra slowly at times.

Interestingly, there was again 3 of these. The final run by the way was 20 hourly candles floating above the 8 EMO. Ominous enough not to want to buy the next dip.

So what about the current move down?

My guess is that this is going to be a trending leg (trhere is alread a difference of a separation way in excess of the last up move’s correction’s 8), which means that you could build a position and hold until after the 3rd block would be printing above the 8 EMO. Let it show you what gear it wants to select first.

I find space synth music to be therapeutic against depression.

Terminal Stage Spencer

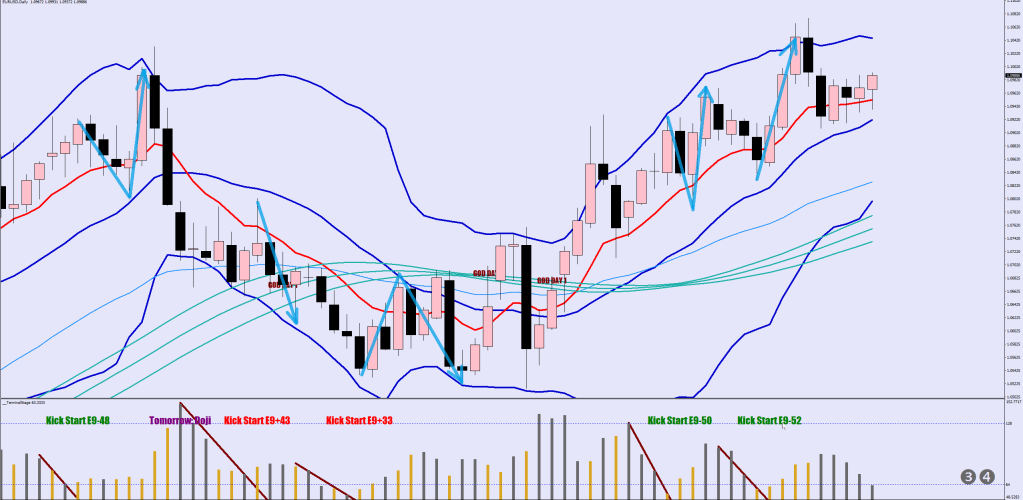
A start of a conversation with the daily volatility trends / changes.

So the plots are the previous 3 days’ ATR in pips in gray, and if the current day exceeds this level, the paint over is gold.

 ExtATRBuffer[i]= ((High[i+1]-Low[i+1]+High[i+2]-Low[i+2]+High[i+3]-Low[i+3])*10000/3);
  if ((High[i]-Low[i])*10000>ExtATRBuffer[i]) ExtATRBuffer2[i]=ExtATRBuffer[i];

As a Stage 1, we notice a contracting volatility sequence of 4+ days that is broken by a step up golden volatility stick (the one after the drawn brown slanted lines),

How could this sequence be utilized for a tradeable signal?

My thinking is that a new leg is going to come start from beyond the 9-day EMA (HL2 – in red) with some displacement and then the market would engage in challenging the daily Bollinger Band. No guarantee that it would get there, but it should give it its best shot and make a lower low / higher high for sure.

  if (i>0 && ExtATRBuffer2[i]!=EMPTY_VALUE && ExtATRBuffer[i]>ExtATRBuffer[i+1] && ExtATRBuffer[i+1]<ExtATRBuffer[i+2] && ExtATRBuffer[i+2]<ExtATRBuffer[i+3] && ExtATRBuffer[i+3]<ExtATRBuffer[i+4]) {
    ObjectCreate("Leap"+i,OBJ_TEXT, indicator_window, Time[i], 138);
   if (Close[i+4]<iMA(symbol,0,9,0,MODE_EMA,PRICE_MEDIAN,i+4)) ObjectSetText("Leap"+i, "Kick Start E9+"+DoubleToStr(ExtATRBuffer[ArrayMaximum(ExtATRBuffer,4,i)]/1.9,0), 19, "Impact", clrRed);  
   else ObjectSetText("Leap"+i, "Kick Start E9-"+DoubleToStr(ExtATRBuffer[ArrayMaximum(ExtATRBuffer,4,i)]/1.9,0), 19, "Impact", clrGreen);  
 }

So there is a call point first that may not have been reached yet, call it target 1 and a target 2.

You know, for starters. There has been a 4+ day volatility drop.

A golden prompt (if the logic still stands, since the 4th canle back was a close above the E9) would call for a buy again at a new low below 1.0910 (just below the S20) for another run for the upper Bollinger.

Candelocity

Hi, I’m new to candles. Are they scented? What’s a Yankee Poodle?

Introducing the afterlearner series. Aztec Style.

Some ideas.

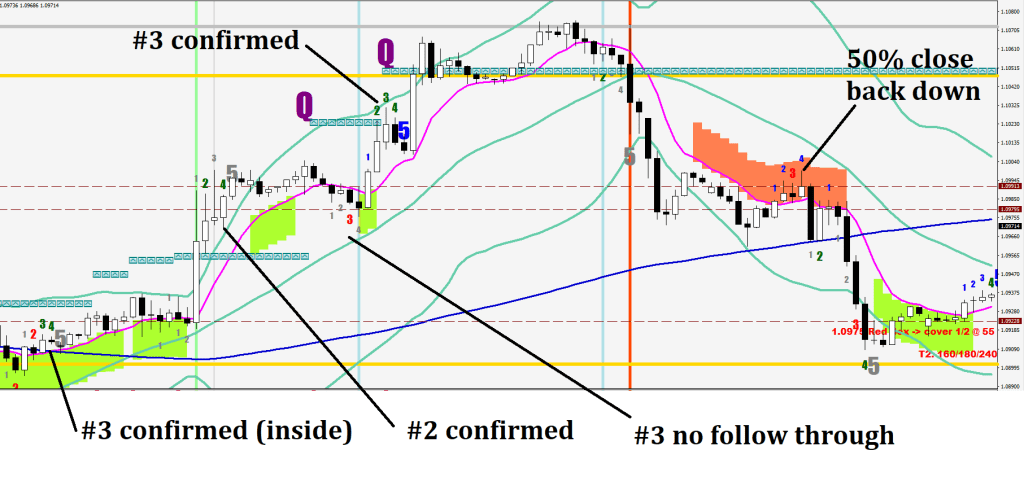
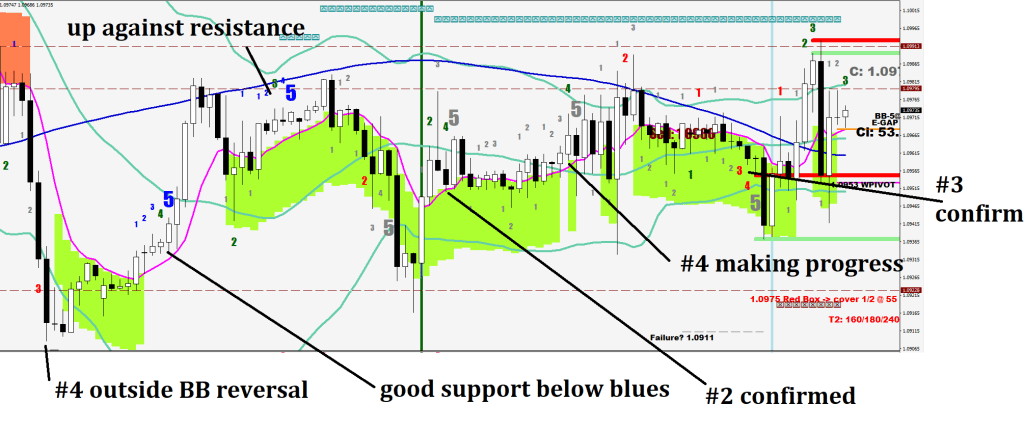
#4 – inside cadle = continuation

#3 & #4 separated from the EMO & one of them was a doji – reversal, otherwise continuation

#4 – goes outside the 30 sample BB – reversal

#4 is a fake out beyond #3 – reversal

What is new here is the idea of wanting to see 4 closes on one side of the EMO before having to evaluate based on weighted evidence revolving around Candle 3 & 4.

 if (ucount[i]>0 && ucount[i]<6){ 
        ObjectCreate("Counteru"+IntegerToString(i), OBJ_TEXT, 0, Time[i], High[i]+90*Point); 
        ObjectSetText("Counteru"+IntegerToString(i), IntegerToString(ucount[i]), 11, "Impact", Blue);
        if (iMA(symbol,0,207,0,MODE_EMA,PRICE_LOW,i)<iMA(symbol,0,356,0,MODE_EMA,PRICE_MEDIAN,i)+270*Point) ObjectSetText("Counteru"+IntegerToString(i), IntegerToString(ucount[i]), 11, "Impact", Gray);
        
        if (MathAbs(Close[i]-iMA(symbol,0,120,0,MODE_SMA,PRICE_MEDIAN,i))>150*Point)      ObjectSetText("Counteru"+IntegerToString(i), IntegerToString(ucount[i]), 11, "Impact", clrNONE);
            if (Low[i]<E8[i] &&Close[i]<High[i]-(High[i]-Low[i])/2) ObjectSetText("Counteru"+IntegerToString(i), IntegerToString(ucount[i]), 16, "Impact", Red);
            if (Low[i]>E8[i] && Close[i]>Low[i]+(High[i]-Low[i])/2) ObjectSetText("Counteru"+IntegerToString(i), IntegerToString(ucount[i]), 16, "Impact", DarkGreen);
        if (ucount[i]==4 && High[i]<High[i+1] && Low[i]>Low[i+1] && Close[i+1]>E8[i+1])  ObjectSetText("Counteru"+IntegerToString(i), IntegerToString(ucount[i]), 16, "Impact", DarkGreen);
 
        else if (ucount[i]==4 && High[i]<High[i+1] && Close[i]<High[i+1])  ObjectSetText("Counteru"+IntegerToString(i), IntegerToString(ucount[i]), 16, "Impact", DarkGreen);


         if (ucount[i]==5) {ObjectSetText("Counteru"+IntegerToString(i), IntegerToString(ucount[i]), 31, "Impact", Blue);
            if (iMA(symbol,0,207,0,MODE_EMA,PRICE_LOW,i)<iMA(symbol,0,356,0,MODE_EMA,PRICE_MEDIAN,i)+270*Point) ObjectSetText("Counteru"+IntegerToString(i), IntegerToString(ucount[i]), 31, "Impact", Gray);
         }
      }
          
      if (ucount[i]==4) {
              
               if (MathAbs(Close[i]-E8[i])>150*Point)  {
                   ObjectDelete("Counterp");   
                  ObjectCreate("Counterp", OBJ_TEXT, 0, Time[20], Close[0]-40*Point); 
                  ObjectSetText("Counterp", "Sell: "+DoubleToStr(NormalizeDouble(Close[i],4),4), 21, "Impact", Maroon);
                  if (iMA(symbol,0,207,0,MODE_EMA,PRICE_HIGH,i)>iMA(symbol,0,356,0,MODE_EMA,PRICE_MEDIAN,i)-270*Point) ObjectSetText("Counterp", "Sell: "+DoubleToStr(NormalizeDouble(Close[i],4),4), 21, "Impact", Gray);
               }
               else if (MathAbs(Close[i]-iMA(symbol,0,120,0,MODE_SMA,PRICE_MEDIAN,i))>150*Point){
                   ObjectDelete("Counterp");   
                  ObjectCreate("Counterp", OBJ_TEXT, 0, Time[20], Close[0]-40*Point); 
                  ObjectSetText("Counterp", "Buy: "+DoubleToStr(NormalizeDouble(Close[i],4),4), 21, "Impact", Blue); 
                  if (iMA(symbol,0,207,0,MODE_EMA,PRICE_LOW,i)<iMA(symbol,0,356,0,MODE_EMA,PRICE_MEDIAN,i)+270*Point) ObjectSetText("Counterp", "Buy: "+DoubleToStr(NormalizeDouble(Close[i],4),4), 21, "Impact", Gray); 
               }
               
      }
     if (ucount[i]>=5) dir[i]=1; 

Candlestick flips and confirmations are good for shits & giggles & prompt hedging.

The real signal is RSI coming back from (the dead) a 2SD stretch.

Ominous looking is that 120 MA bowing down (blue).

My bony is over the boner.

Nemesis, the final challenge.

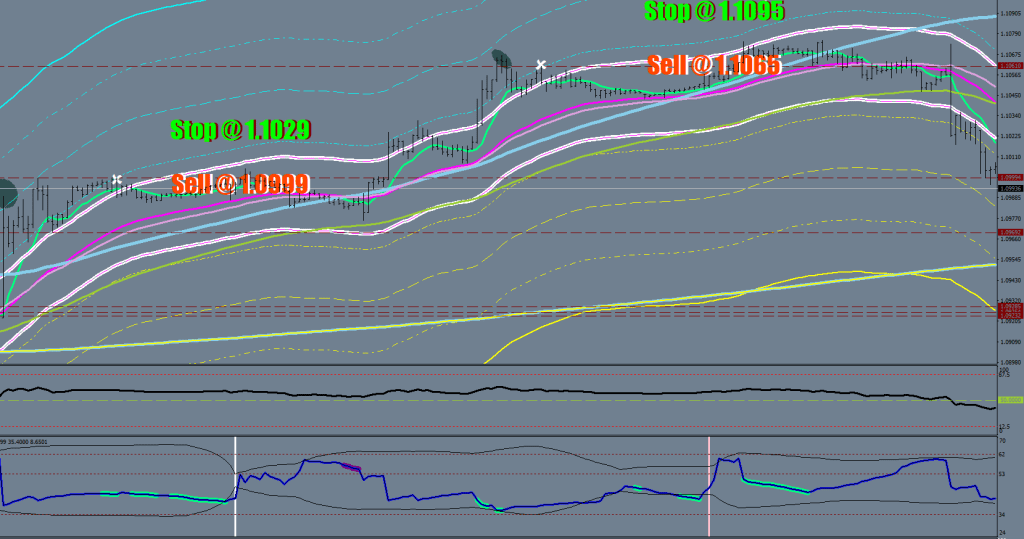
At this point I”m still thunking that this is going to fail either 1.0990 or 1.1032. My bet is on the latter.

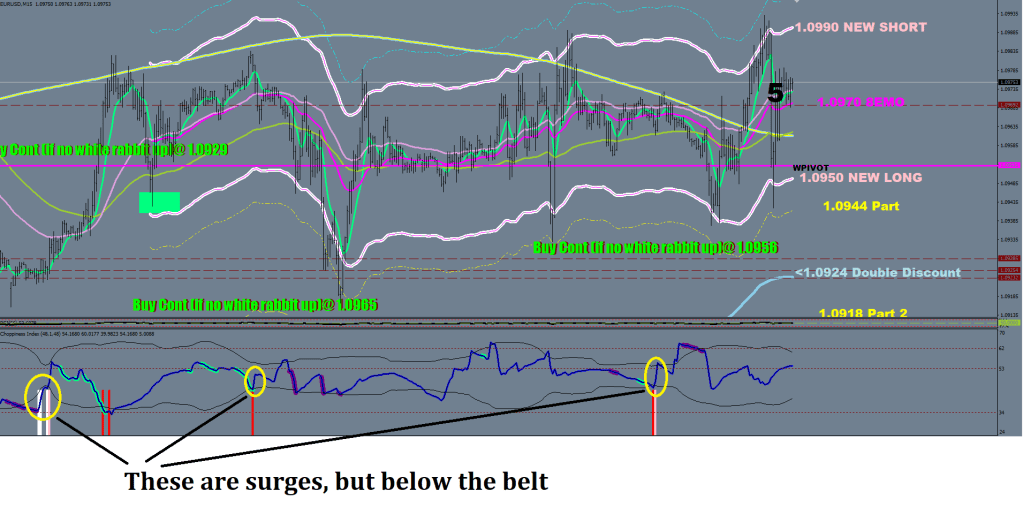
What am I looking for exactly? A 10-15% sudden surge in energy within 15 minutes whilst searching the pockets above the belt (120SMA).

The little pocket of newly found energy would be able to afford you future volatility expansion.

As my coworker, whom responded “I don’t do much thinking on a Friday”, similarly I don’t do much living on a Friday.

Stalling VS Failure

Shocking stuff, as per usual.

The market does not fail levels i.e. support & resistance, the market fails maintaining volatility.

See, yesterday the level the market could had challenged in order to fail, was 1.0990

Since it came into sell orders on the way, it only made it to 1.0982, stalled & retreated.

Today the variables are different: the 3-day ATR has changed as well as the consolidation mean.

Therefore the level to challenge (for a likely failure) is 1.1035.

Try to grasp this idea of relativity. What was resistance yesterday, may be nothing today, and the real resistance is maintaining the level of volatility.

By stalling and raising the consolidation weight higher, more immediate upside became possible

pointers

A high has’t been recognized. A low has.

The most important line for premium / discount on a chart is the hourly 120 SMA.

I don’t think you would be able to figure out much until you get the measuring point and the volatility stick right, but just keep on anchoring those VWAPs like an angel in the meantime.

This would be the last time I’ll insert how to find the consolidation weight. Nothing to do with daily closes / opens.

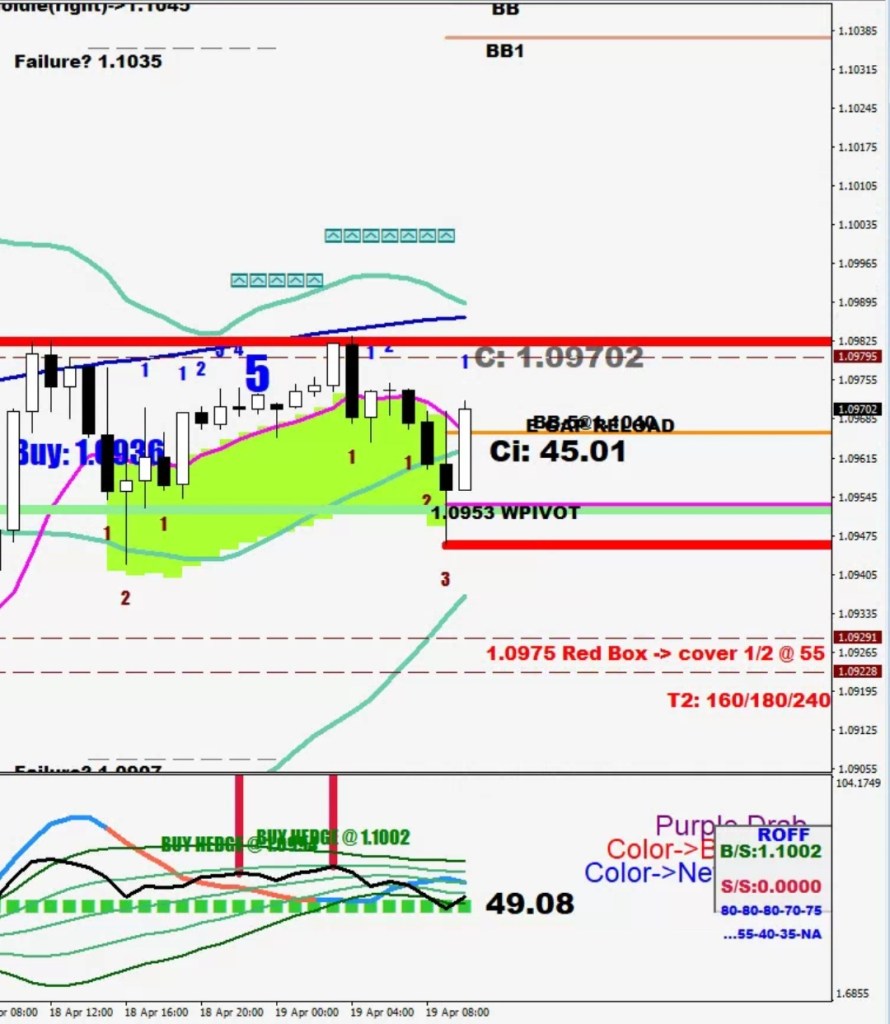
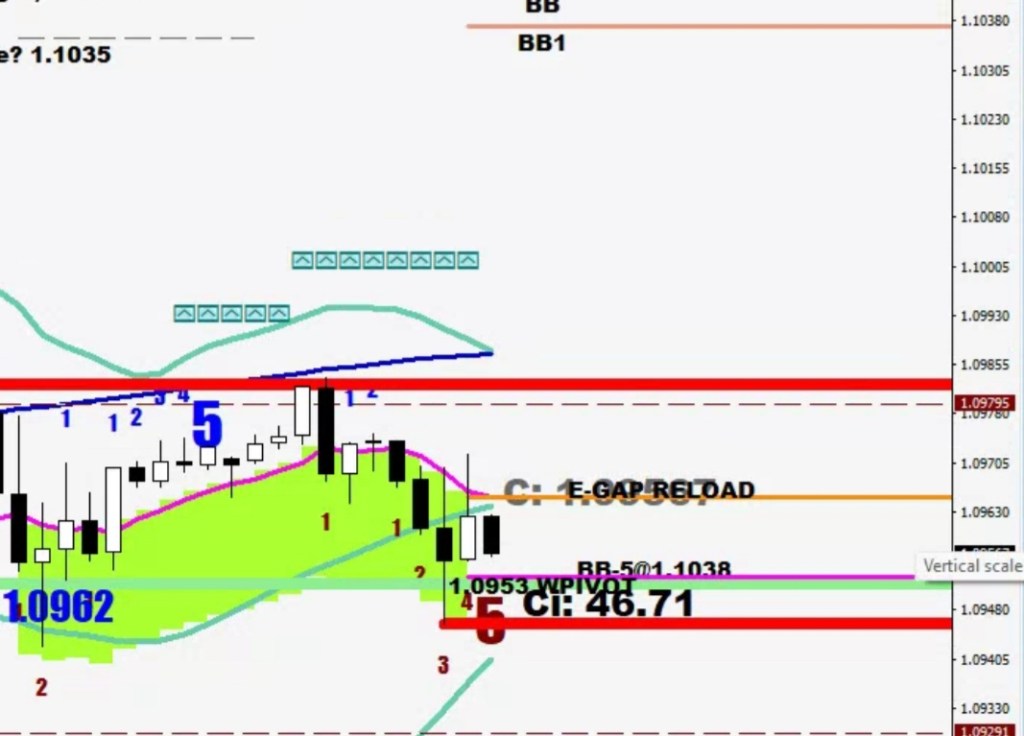
This is a hanging garden. Just added this exception yesterday. #4 down (from the 8 EMO) prints with its high connected to the vine. Now 1.0962 is a buy and anything in the next 30 pips down.

Don’t know any other songs about Hanging Garden.

Here’s some Smashing Martens for reconciliation.

The low has been recognized. The high has not. You would need the CI to step outside the womb first.

Here you cannot see how the consolidation weight is moving higher. I gotta take a walk, man and make some color changes when I get back.

The Thing About…

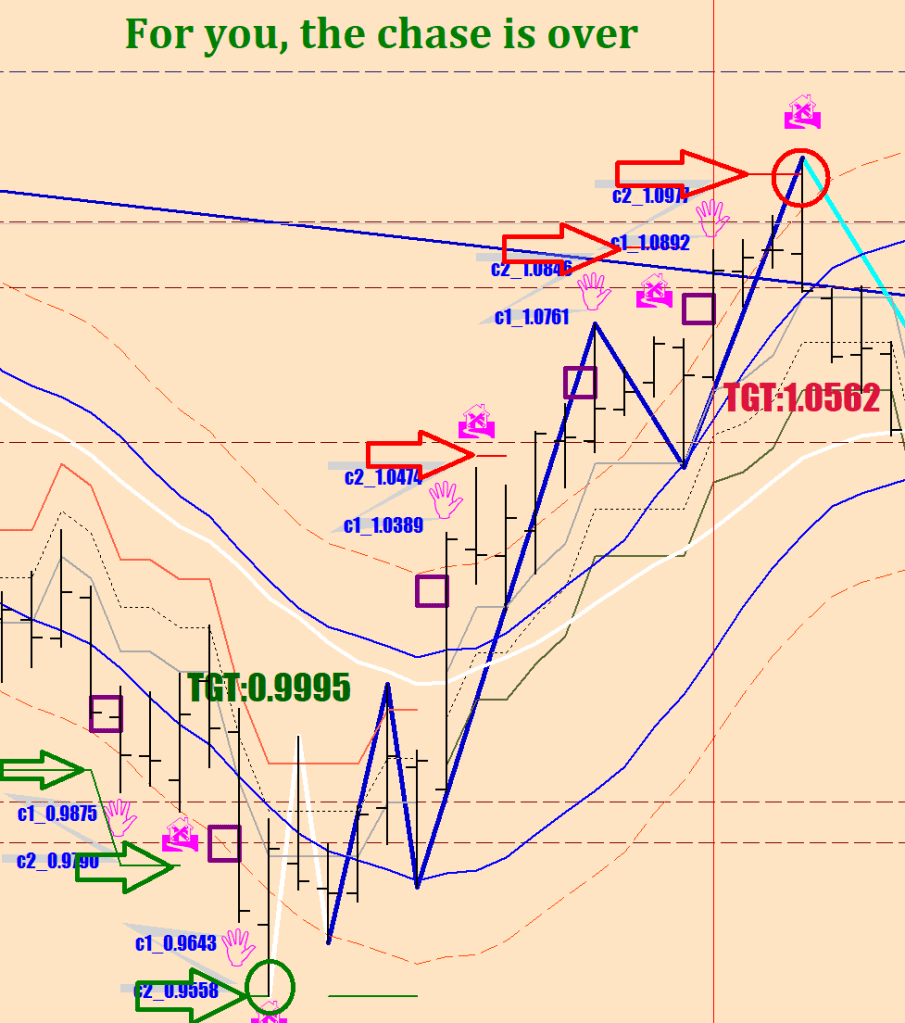
The thing about a push (which is a weekly close outside the 14-sample window envelope) is that it would likely followed by an echo within the next 2-4 weeks.

The thing about the purple boxes is that they represent some early, aggressive entry level suggestions for a push that may come on quickly.

The thing about the 3 statistical support levels (measured from the swing high) that they should provide the “home” for the price to return to after the echo had ended.

Robert DeNiro Chasing

A theme that seemed to be in place for the last couple of years is that these Push and Echo sequences did not end until the Echo went far enough beyond the last push.

I found this distance to be about 132-135 pips.

bofd[i]=iLow(symbol,0,iLowest(symbol,0,MODE_LOW,2,i))-1320*Point;   
bofu[i]=iHigh(symbol,0,iHighest(symbol,0,MODE_HIGH,2,i))+1350*Point;  
    

So what now? We should at least consider that this theme is still on.

Now, as a curiosity, my mind is currently preoccupied with flow charts based on the previous days volatility change relative to the 3-day average, because I believe this can provide a game plan with more or less binary decisions. I.e. if the Goldilocks was hit then the right was purchased for a No Break Extension for the next day, if there is a consolidation in between, another Goldilocks measurement is put in place. If the Silvergate distance was achieved (see yesterday), then the likely outcome is a challenge of the Goldilocks and a likely failure just shy of it would mean the end of the move.
Why am I doing all this? Because I’m that type…

Rabbit Grease

They’re multiplying.

Pink for the one so strung out albino.

In the pink of an eye you can tell that the enegy ended up on a high note. What’s the use of that?

A capable bunny is prone to being seduced.

The points of the following screen shots are: the 4 expressions that I came up with are of course filters. Yet, there is no curve fitting going on here, these plots have true predicting power. I know that there’s a fine line, but it has not been crossed yet. Trust me, I’ve been making indicators for 13+ years.

A pink and a white combo is the shit. Only the Wave 3 and the Wave 5 up had it.

If it s..cks like a duck & f..cks like a duck, it’s a sex maniac duck.

Cocaine’s got my brain & I sweat ’cause I’m ice cold.

Back to grand racismo, we all heard the joke about the bus, where there are only blue people and the light blues sit at the front, the dark blues inthe back.

To underline that everyone on this planet is aspiring to be a Nazi, two things.

Asians often buy bleaching soap to make their skin peel faster to achieve a lighter shade.

I was staying with a Bangladeshi couple, where the wig made remarks about the husband being too dark.

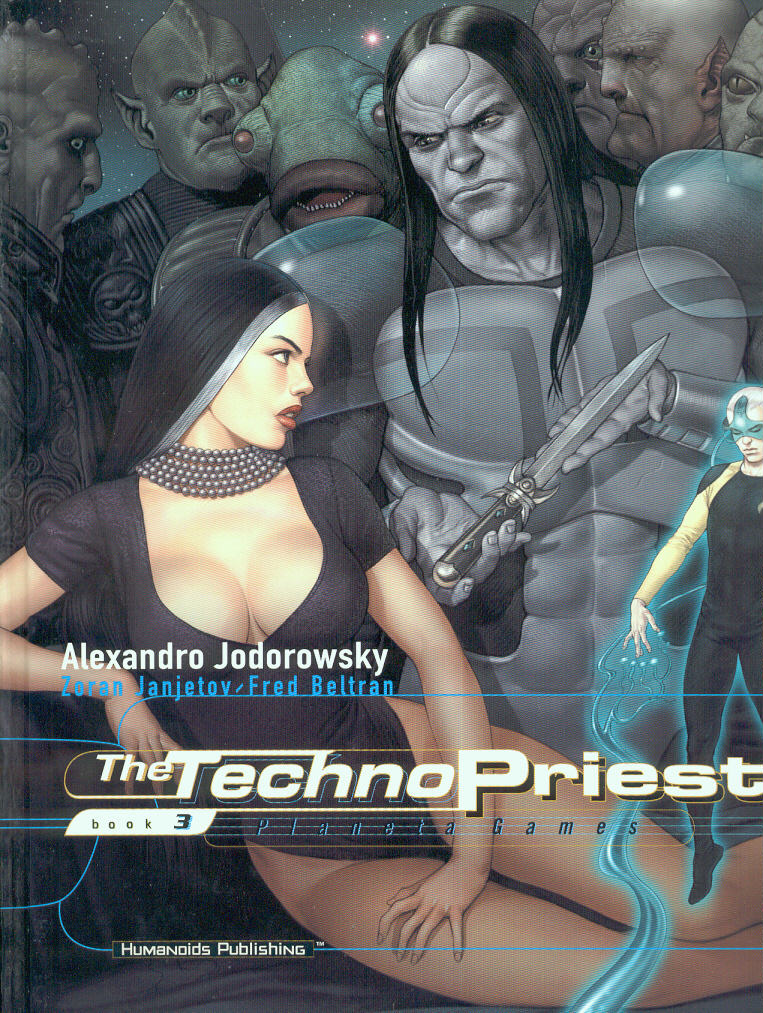
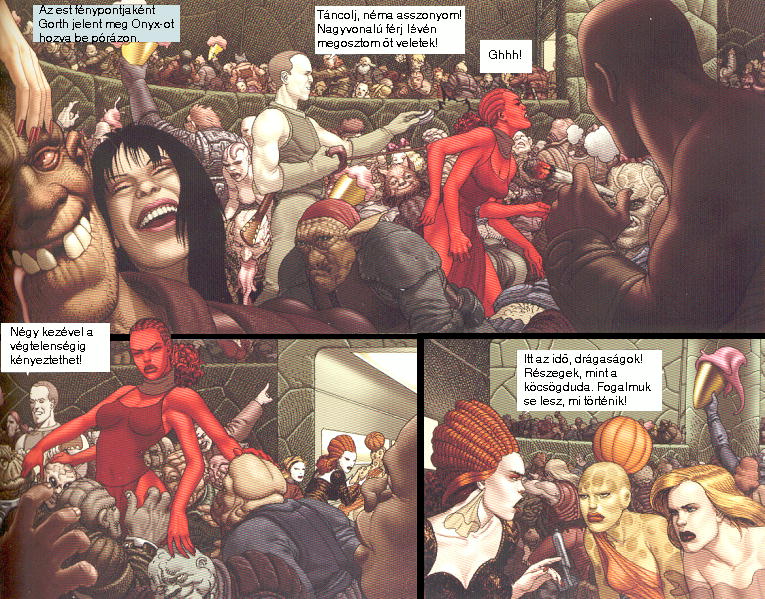
Alexandro Jodorowsky flips this theme on its head in the Techno Priests comic books, where Albino is disadvantaged one versus the handsome brother with ash-like skin.

There is every human baggage here, from fat shaming to ultrafem tomboys, virtual reality and the point of drinking is to vomit on someone – go figure!

In Hungarian

To top this off, we used to say about our daughter that she was the only Chinese in our family, and bullied her for having no nose. You cannot start preparing for life early enough.

…and when a child is born into this world, he has no concept of the toneless skin he’s living in.

Quick Tabs

I find these things to be true. Some miscalenous knowledge might come in handy if you want to stay ahead of the market.

No counter volatility (less than 29 pips) = continuation.

Teal T (4H fractal falling shy of the 30-sample 4H BB HL2 after a fractal print outside) = Return to 4H S30 / E32

case & point:

Other

A Goldie hit is a registration for a No Break Extension the next day.

Two consecutive Goldie moves = ABC

(Goldie is the 3-Day ATR minus 10 pips)

When I said about my 5-count idea, you didn’t think for a second that it isn’t gonna be implemented…

///8EMO Counts


if (Period()==60){ 
   for(i=420; i>=0; i--){
         if (Close[i+1]>E8[i+1] && Close[i]<E8[i]){
            dcount[i]=1;
            ucount[i]=0;
         }
      else   if (Close[i+1]<E8[i+1] && Close[i]>E8[i]){
            ucount[i]=1;
            dcount[i]=0;
         
         }
      else if (Close[i+1]>E8[i+1] && Close[i]>E8[i]){
           ucount[i]=ucount[i+1]+1;
         }
      else if (Close[i+1]<E8[i+1] && Close[i]<E8[i]){
           dcount[i]=dcount[i+1]+1;
         }
   
      else {ucount[i]=ucount[i+1]; dcount[i]=dcount[i+1];}
   
   }
} 

deletetxt1("Counter");     


///8EMO Plots


if (Period()==60){ 
   for(i=420; i>=0; i--){
   dir[i]=dir[i+1];
     if (dcount[i]>0 && dcount[i]<6){
        ObjectCreate("Counterd"+IntegerToString(i), OBJ_TEXT, 0, Time[i], Low[i]-40*Point); 
        ObjectSetText("Counterd"+IntegerToString(i), IntegerToString(dcount[i]), 11, "Impact", Maroon);
        if (dcount[i]==5) ObjectSetText("Counterd"+IntegerToString(i), IntegerToString(dcount[i]), 31, "Impact", Maroon);
      }
     if (dcount[i]>=5) dir[i]=-1; 
   
   if (ucount[i]>0 && ucount[i]<6){
        ObjectCreate("Counteru"+IntegerToString(i), OBJ_TEXT, 0, Time[i], High[i]+90*Point); 
        ObjectSetText("Counteru"+IntegerToString(i), IntegerToString(ucount[i]), 11, "Impact", Blue);
         if (ucount[i]==5) ObjectSetText("Counteru"+IntegerToString(i), IntegerToString(ucount[i]), 31, "Impact", Blue);
      }
     if (ucount[i]>=5) dir[i]=1; 
  } 
}

Thought Beings keeps on coming out with original stuff

What next?

I’d expect the 60-sample 60-minute slow stochastic to go oversold.

We hit S2,

the bounce in theory should make it back to the 8-EMO with this B leg up. It should do a count again with 1 or 2 hourly closes above it, then proceed down to the low 1.09s.

There may still be buyers at the Red arrow, the daily stochastic embedding is still strong, but to get a deal, they would probably want to see a discount first.

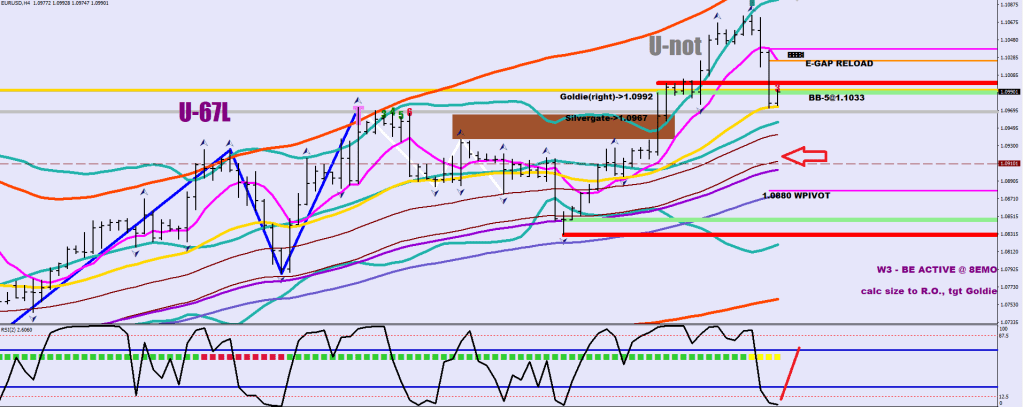
The red line on the RSI2 shows what a Wave 2 up print would look like on the 4H chart.

Discount starts below 1.0954 (green yellow line = S480)

If nothing else, the Lower Guard Rail should pose a limit as a completion of a mean reversal.

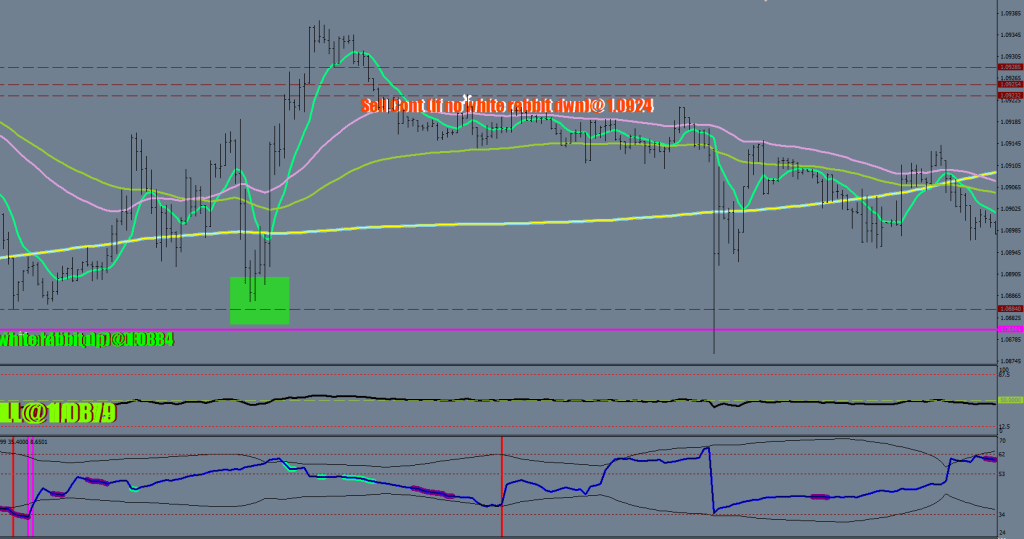
A white rabbit should confirm the new low.

Maybe

Maybe it was a mistake to einstand the Russian’s Dollars.

It is hard to call a top like that.

No new White Rabbit after the busted one.

If the week finishes like this RSI2 reading ()87.5+ for the 4th time = embedding), this is now officially a bull market.

Next outskirt was placed at 1.1158-68. This is going higher still at a minimum for the money flow divergence.

N-Tanglement

Here’s an array of hope for you.

All you need is just a little moving average & the ability to count to 5. At 6 you are over qualified.

Overheated conditions don’t just fizzle out.

The squeeze is setting in, like someone’s trying to say, let’s get it on!

The market is in the resting range. 1x stretch is the bending position before the run from the guard rails. There is a LEMA at 1.10 (sienna). Also is about 3x stretch (purple) – it would make sense to at least stretch out that much before a snap back.

A smidge before the dirt box price reverses. The runway is now clear for a take off. The double embedded rainbow is a guarantee.

The MA is of course the hourly 8 EMO. Exp. average of opens.

The first encounter of a run that was kicked off by top percentile 30-min money flow pulls out a counter board.

1, 2, 3… eng. Could not muster 4 closes below, therefore upon the next encounter, if you would see 4 consecutive closes below the line, things will have changed.

This next one was a bit different…

You would had been just fine putting a stop loss underneath the 1st 4 candles that went below. Your protection would had been the longs on the up move and notice this – once price broke that low, it barely moved up at all beyond that point.

Here’s the famous one. Made good money with it, but until you get the closes below, you are guessing the high – that’s the point here.

Let’s not get this wrong!

Do the Loco-motion with me.

Let’s go, let’s go boys, count with me & sing.