
This is not the complete article, it is just something I wanted to post before I forget. I shall continue with this page later on.
The following image & comment was my inspiration for this 2-part series:
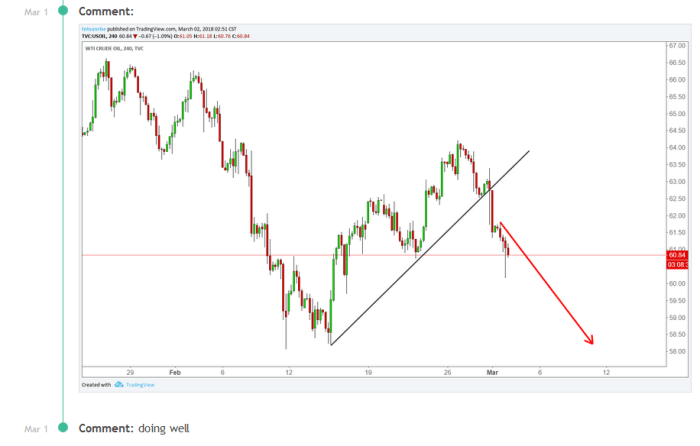
I was absolutely certain that this OIL short was not gonna work out. Was considering posting it to my blog, but… there is not much audience here, and paricularly not in the Crude gender.
He did not have the crucial deflector (2H Lema) displayed on his “price action” chart.
Frankly, on my cell screen this was not plotting either – yet another difference from the desktop version.
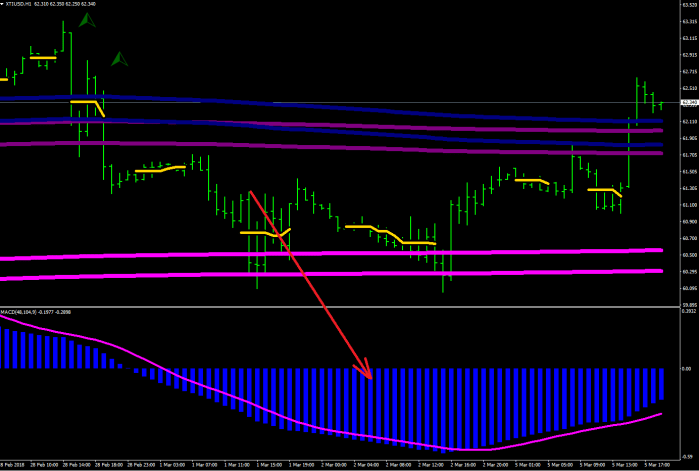
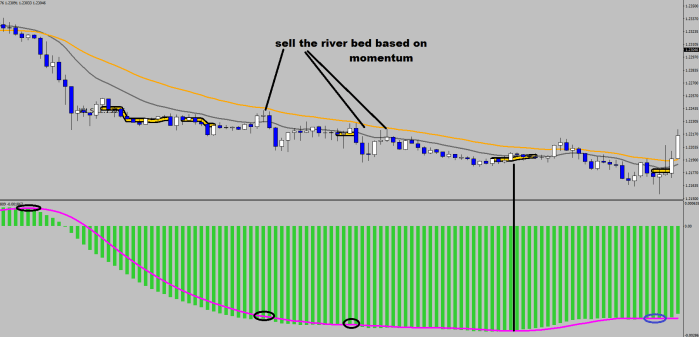
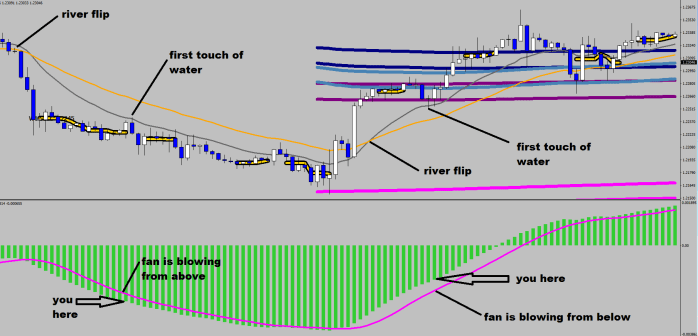
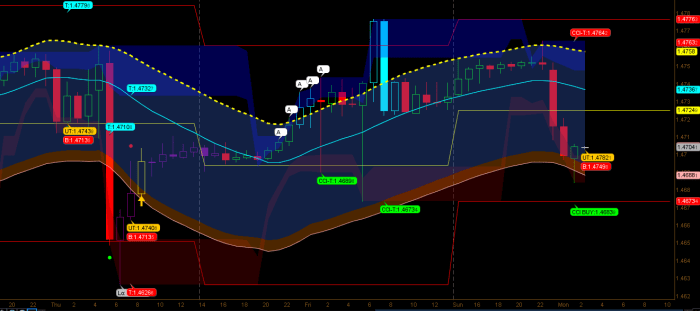
Water & Mud are The River, the two moving averages that I use. MACD signal line: the location of the fan blowing.
Water line is a 16 EMA HL2.
Mud line: 36 EMA.
MACD: 48,104,9
Best time frame for these averages is 1h, second best is 15 min and the third is 30 min.
I know, I used have the beautifully shaded High Tide Low Tide TOS charts (still there on my old blog). Keeping it simple came with the different platform. I miss those deep blue, semi transparent, colluding shades though.
All this does not mean that for instance the SSO SDS strategy of Craig does not work. Not at all. If you want to buy an hourly pullback beyond the 8 EMA and put your stop beyond the 21, feel free to do so.
