
This piece was originally posted on the Current read page.
I am giving people indicators, but they can only learn the practical usage and the thinking from this blog. This is an all time lesson as such.
A wave 1 comes from beyond a root point.
See how the wind (MACD) remained down all the way during the move back up.
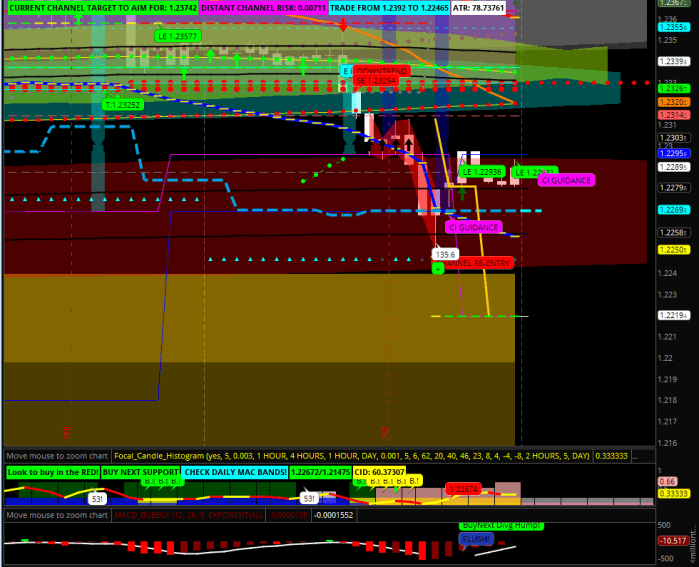
The 3 thick horizontal lines are the two root lines + the halfway mark between them.
The bounce back into the end of Wave 1 (Wave 4) coincided with the pro volume candle’s low (green line)
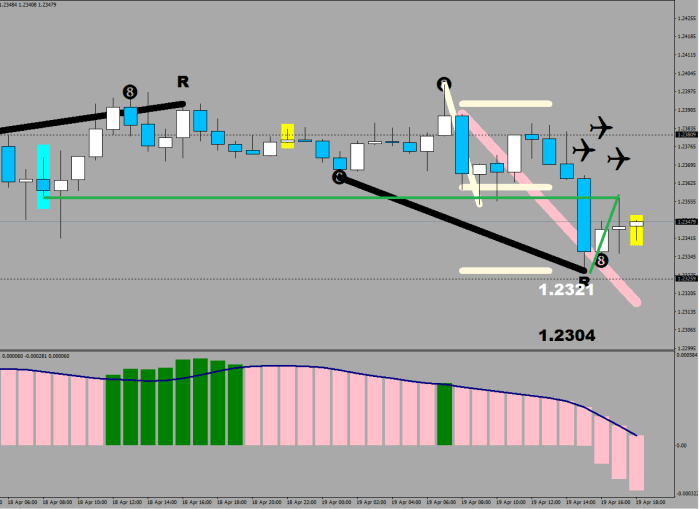
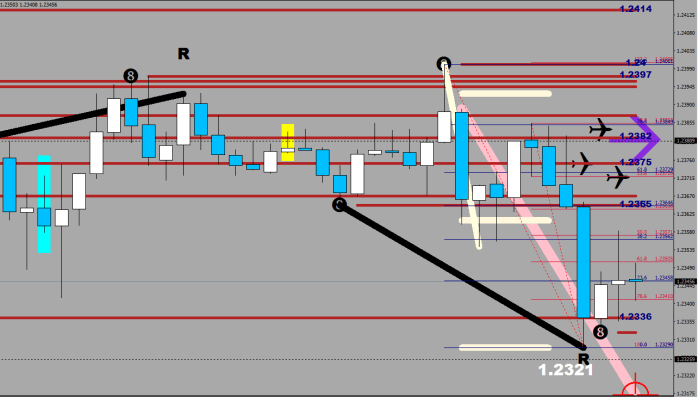
After plotting the qualifying moves (thick red & green) – since the last move is a red down (happens to be the Wave 3), it is clear that you are looking at a retracement only in the up move, that would be the starting point of a wave 5 down – which could either stall out at the 55 pips black dash and storno the whole move or take it down much closer to 1.23097 – which would likely yield a consolidation at some point effectively moving the consolidation weight lower.

If I also plot the 88 lines, you would see a double pump at the end, that would increase the chance that Wave 5 would be a short one: if they decide to buy the inner brown, at 1.2336 and put a stop beyond the lower brown, the move would be cut short.
Also take note of the white spinning top. As soon as its bottom is crossed back up from below, the bear time would be over with.

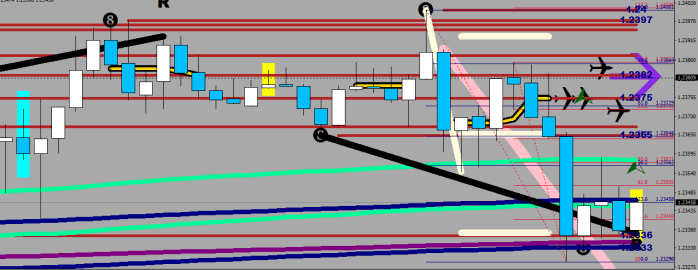
In terms of deflectors, price is currently tucked below the green river monster (15-min LEMA), and is having a second go at the 30-min LEMA and the 1H LEMA is right here as well. On regular days, the price tends to play ping pong between the green river and the 2H LEMA – starting at 1.22763.
We seem to be witnessing a letter “h”, a formation that price cannot get out of lower for a while. (It came back down for a re-test after a significant bounce (>23%) too quickly.)
Check how the Root point has just migrated higher.
….
End of the air lifted part.
The outcome was a drop to the 2H LEMA (in magenta) and there was an extension made (to the end of its cloud – not displayed here, but a 1.272 extension), 1.2260 by the way was last week’s low, and it got superseded to exchange positions through the revolving door. The sell off starter from the Green River, and the new wave kicked in upon beating the fractal on the left (revolving door again).

Current move up to the root does not qualify for a Wave 1. You are still below the root point, and the back test of the bottom is highly likely.
By the way, the bounce happened off the 4H lower root. (Bottom left “R”). (You can also find the last flame signal on my Stochastic/RSI2 oscillator.)
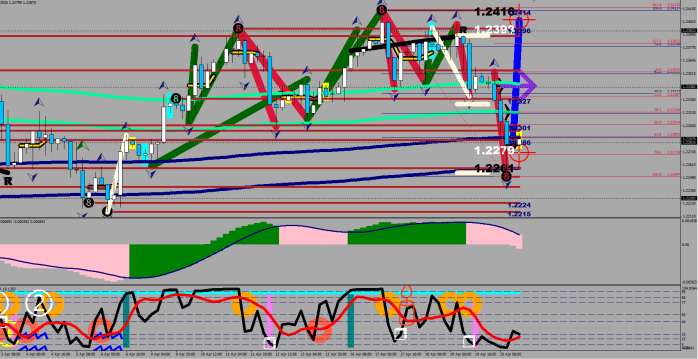
In the current setup, the three components are the following (more in the Principles article): the wind is negative, the position is above/at the 2H LEMA, which is neutral and price is below the Root point which is also negative.
The above image displays the cloud around the LEMA. Since this was a flush move, the next, lower low would come with a divergence and would be a buy. The projected distance lines put this value at around 1.2219, which as you can see would be in the oversold section of the comfort levels.
