
Computers are dumb, we are dumb and our programs are even dumber.
There are a limited number of things we can do.
In trading, no matter who you are, you would end up using more or less the same ideas, the same variables.
The if then statements turn everything black and white.
I have tried to show you at times already the issue with using closing prices as a basis of an oscillator versus the weights, the actual road traveled – weighted.
One problem with closing prices as part of your examination is that the arbitrary point of time, the top of the hour/ 30 min or whatever the denomination may be, is just that. Arbitrary.
You may end up losing information. How?
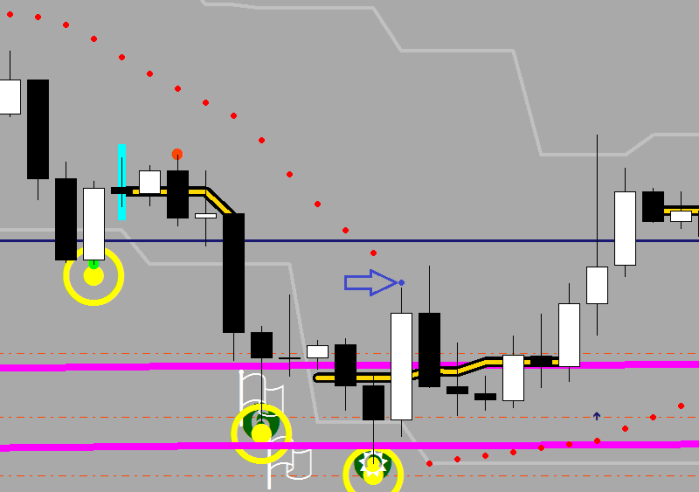
Here is an example of a fractal marker.
An upper fractal is a peak that has its two left neighbors and two right neighbors fall short from. Look at the two long white candles that have no fractal marking at the high point.

Why? because the next candle exceeded the high. Perhaps merely by seconds after the forming of the white candle was done. Black and white, disqualified. The blue candle likewise wasn’t a fractal, for it had no two neighbors falling short of its peak to the right.
Yet, I would argue that we saw a fractal.
Anything that would include taking into account the fractals, i.e. counting the number of upper fractals from a swing low, would be at times inaccurate.
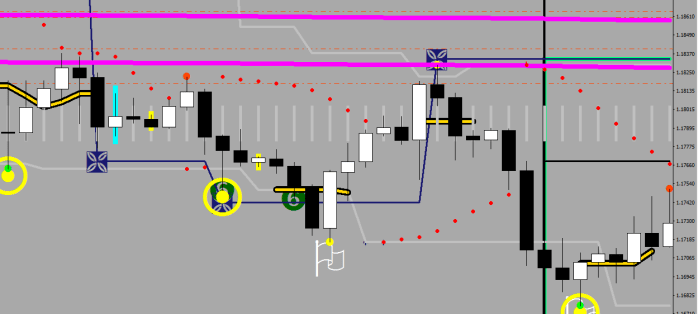
If you engage in algorithmic trading, you would find yourself looking for means – lines that define where the price should be. With such a search, you may end up stumbling upon the hourly E16(HL2), like I did. Since I am plotting mostly on 30 mins, I had to opt for its brother, E32.
If you want to find, quick, high probability trades, you can – and most likely would – start monitoring the separation from the mean, and you would pick a sample size. The longer the separation was on for, the farther price got pulled away from your line, the more likely it is to find resistance on the re-visit. Longs get out, shorts get in kind of thing.
The thick gray line is the E16. The regression channel looking is simply a set of lines 18 pips apart. As you can see, price spends a great deal of time being in the gray zone.

The red distance is in excess of 36 pips (18+18), and it occurred during your sample size leading up to the next upper fractal that discharges on E16.
This is your first algorithm. How much can you hope for? 36 pips (to the white line). What stop should you use? 18 would do.
Please take into account the configuration of EMA 135 vs EMA 424 when deciding on the preferred side.
The above entry can be basis of a hedging routine, such as my E16 hedger. When the separation does not occur, the price could walk through the E16 without resistance. I’m sure you have seen this a million times.
This is what algorithmic trading is. Picking up on a feature that seems to repeat itself and exploiting it for it has high probability of working out.
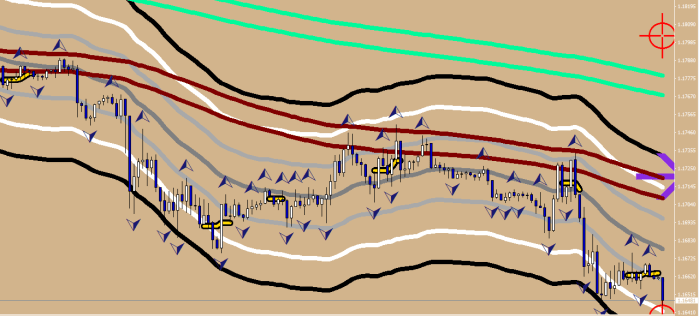
Let’s talk about thinking ahead. Is there another 40 pips guaranteed somewhere?
Look at the 4H PSAR.
Similar idea, mean reversion…
What if you knew / predicted the location of that blue dot before it occurred, and placed a short order 5 pips shy from it? 44 pips with – say 18 stop again? Not bad. But what can you actually aim for?
There are two of such encounters on the following picture. Can you find them?
One resulted in 116 pips to the swing low, the other was only good for 30. Could not you decrease the stop to 15? You certainly could.
A side effect of this is that you can become aware of things about to happen.
Like the sell off on EUR on Friday.

Can you find where it fell short by 5 pips from the standard PSAR settings?
…and from now on I have the prediction printed on the screen, so that I can stay on my beloved 30.

double para;
if (iSAR(Symbol(),240,0.02,0.2,1)<iSAR(Symbol(),240,0.02,0.2,3)) para = iSAR(Symbol(),240,0.02,0.2,1)-(iSAR(Symbol(),240,0.02,0.2,2)-iSAR(Symbol(),240,0.02,0.2,1));
else if (iSAR(Symbol(),240,0.02,0.2,1)>iSAR(Symbol(),240,0.02,0.2,3)) para = iSAR(Symbol(),240,0.02,0.2,1)+(iSAR(Symbol(),240,0.02,0.2,1)-iSAR(Symbol(),240,0.02,0.2,2));
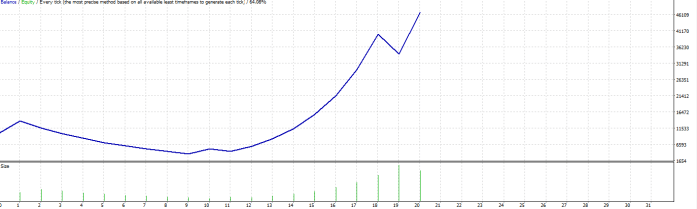
After finishing the above post, I thought, Why not make a PSAR trader?
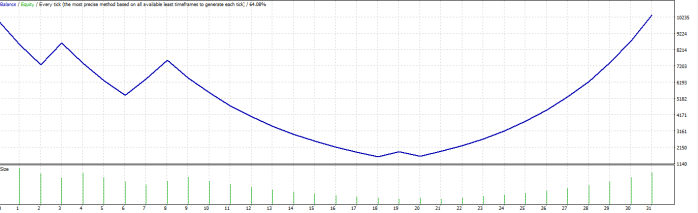
I don’t recall ever seeing such a nice parabolic bow upwards right off the bat with any idea, so I went on to exploring more.
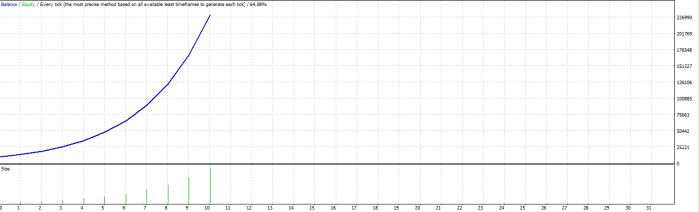
Added more filters, doubled sizing…
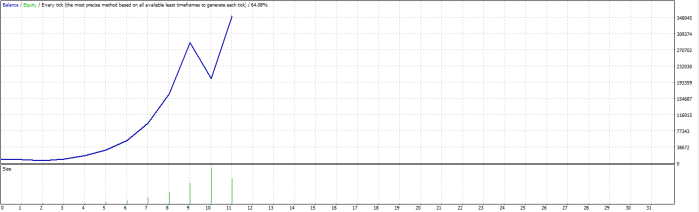
…and when I stuck with shorts only, utilized the 4H LEMA, changed the stop loss to 30 pips and kept target at 40, see the result for yourself:
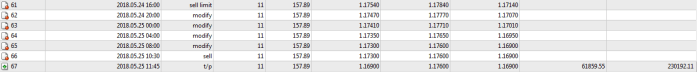
Friday’s trade it would had opened at 1.1730 – as you can see…
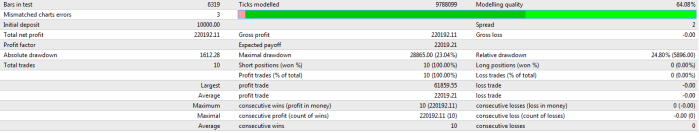
I could change the Normalization of the Doubles to 4 digits’ length – but apparently, there’s no need for it.
…
Things like this, the finding, the thinking from start to finish, the ability to implement like a one man army makes me believe that I am possession of the finest quality of brain. Imagine the frustration that derives from it when I seem to be unable to sell myself, unable to come across / succeed in life.
