
This mostly applies on the upside.
When you see the 3rd “Sync” swing high in a short period, chances are that you are in a wedge. There are 2 different shapes that can make price reverse. A head and shoulders and a wedge.
Fig. 1
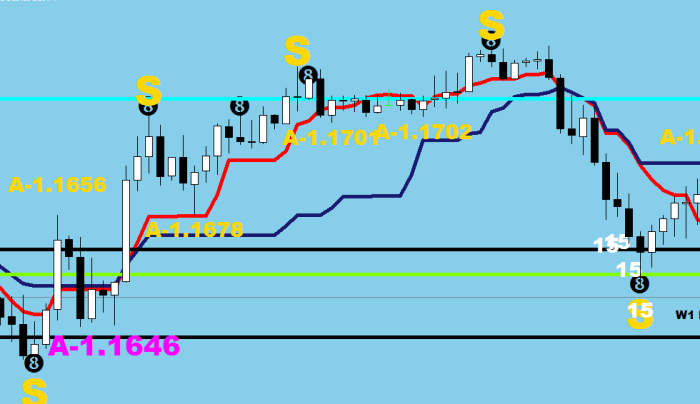
3 “S” on the top – check. The red and the blue lines are standard Tenkan-sen and Kijun-sen (Ichimoku indicator). Of course they lag a bit, but you can get the sense of the volatility just by looking at it. The wedge is over when the Kijun-sen gets volated. You should go short just below it.
Fig. 2
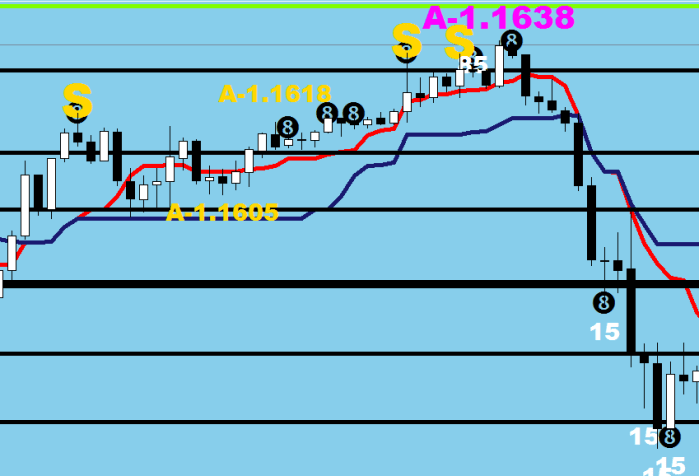
3 “S” check. Break below Kijun-sen, perfect.
Fig. 3
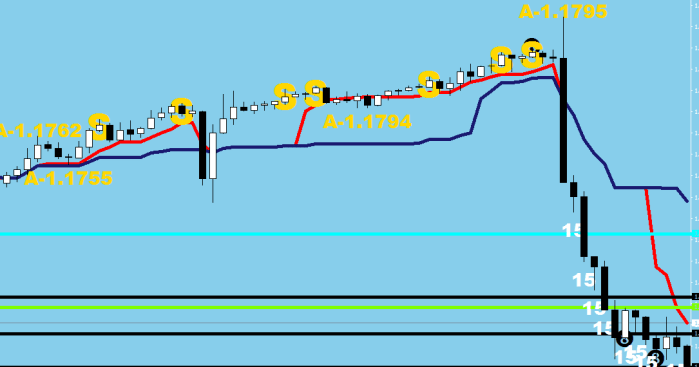
This one shows why you should not try to guess the top, and only go short upon the blue line’s break. (After the 3rd “S” of course).
