
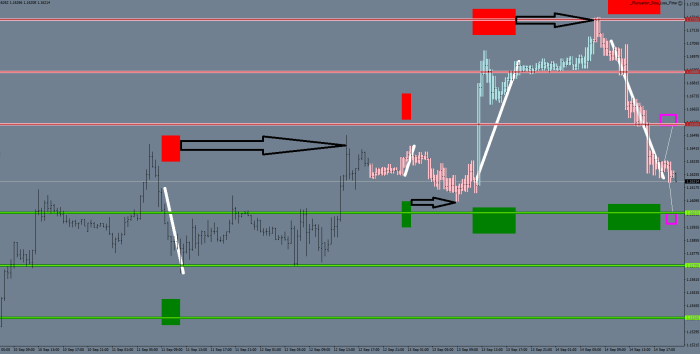
the market prints an end line (white ones)
now you have a support and a resistance box
you play whichever gets touched first for an entry
for examplar…
while (j2<500 ){
j=j2+FMinimumSampleSize;
if (iFractals(Symbol(),0,MODE_LOWER,j2))
while (j<j2+22){
if (iFractals(Symbol(),0,MODE_LOWER,j2) && RSI2[j2]<8 && stoch[j2]<30 && stoch[j]>44 && High[j]-Low[j2]<FMax*3*10*Point && High[j]-Low[j2]>FMax*10*Point/divider && RSI[i2]>15) break;
j=j+1;
}
if (j2<j+12 && iFractals(Symbol(),0,MODE_LOWER,j2) && RSI2[j2]<8 && stoch[j2]<30 && stoch[j]>44 && High[j]-Low[j2]<FMax*3*10*Point && High[j]-Low[j2]>FMax*10*Point/divider && RSI[i2]>15) break;
j2++;}
if (iFractals(Symbol(),0,MODE_LOWER,j2) && RSI2[j2]<8 && stoch[j2]<30 && stoch[j]>44 && High[j]-Low[j2]<FMax*3*10*Point && High[j]-Low[j2]>FMax*10*Point/divider && RSI[i2]>15) {LowFractalTime_2=iTime(NULL, 0,j2-1); LowFractalTime_1=iTime(NULL, 0,j-1); direction[j2]=1; }
the end line support and resistance boxes are now part of the God Awesome Indicator
that is due to be released by the last day of September, 2018
could this be a basis for an automated trading routine?
anything could be, but writing this would be a breeze
