
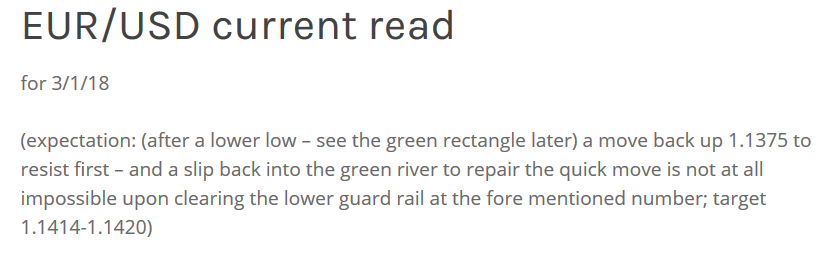
What is the market?
It is an atlas ball, that’s right, it is a snow plow…
The market is also a step down voltage regulator.
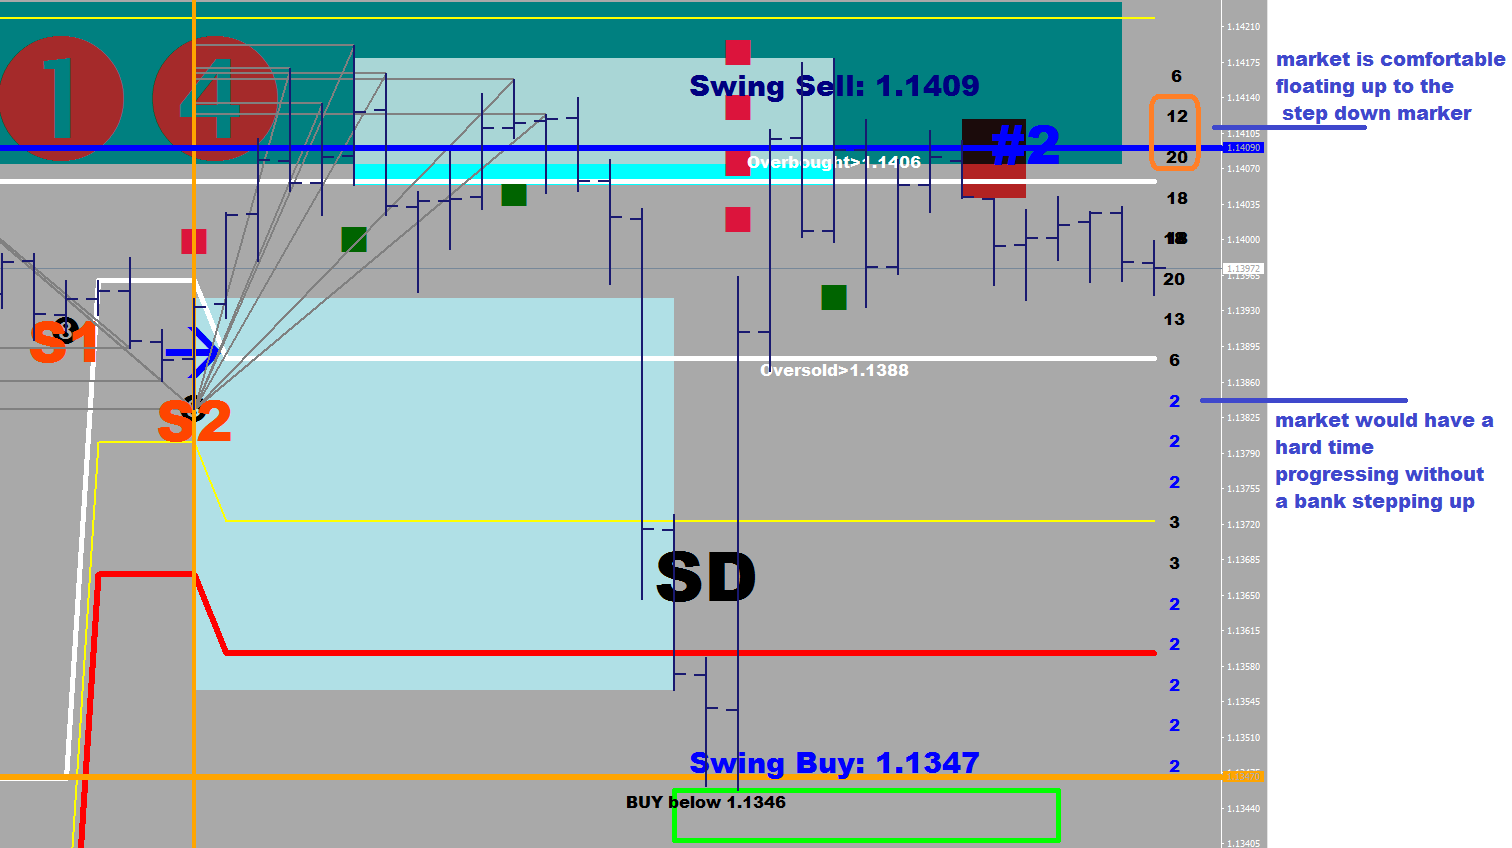
Here is what I posted upon seeing the weak structure of the sell-off on the 2nd of January:
Now, where did I get those numbers from? (Not the year, that was somehow not updated by me.)
From the market profile that was displayed by my 88 Luftballons indicator.
(I don’t have a better screen shot for the day, sorry).
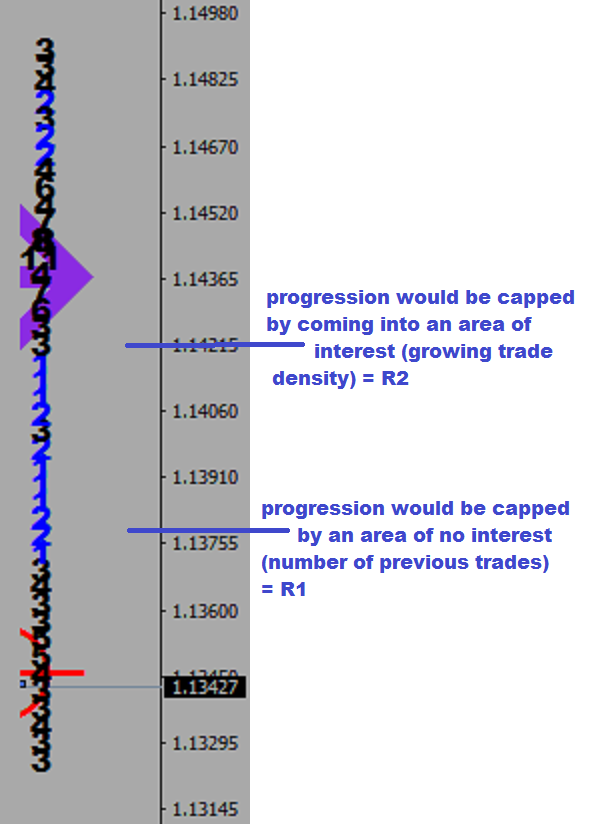
What you need to understand here is that the single prints (ones, twos) are representing the absence of time spent in the area, which comes with lack of interest. People are holding their trapped positions in the blacks, and they cover in the vacuum for a better than break even.
Price would usually penetrate the vacuum a bit, eat up the little amount of orders there, then would turn back.
The step down idea as follows:
My market profile is displayed on the 30 minute chart. Price can hit another kind of void, the big drop between the step heights. If there is say a 8-10 difference between the numbers, that means that perhaps for close to a length of an entire session (4-5 hours) an are was left out.
Filling in the blue areas is called repair of the structure, for a single prints structure is a weak structure, and is in danger of being re-visited.
Progression in the blue areas is relatively quick because of having not too many orders (but requires continuous buying/selling at market by someone with funds), other than at the step down area, which may cause a reaction first.
Littering the low density space is how the market retraces.
To say something about the future: there is no number above the 6 print, and the upside cannot be considered as finished without an excess (single prints) – that’s another repair to be had.
