
This is your homework for the summer:
Based on the images below, try to draw conclusions on
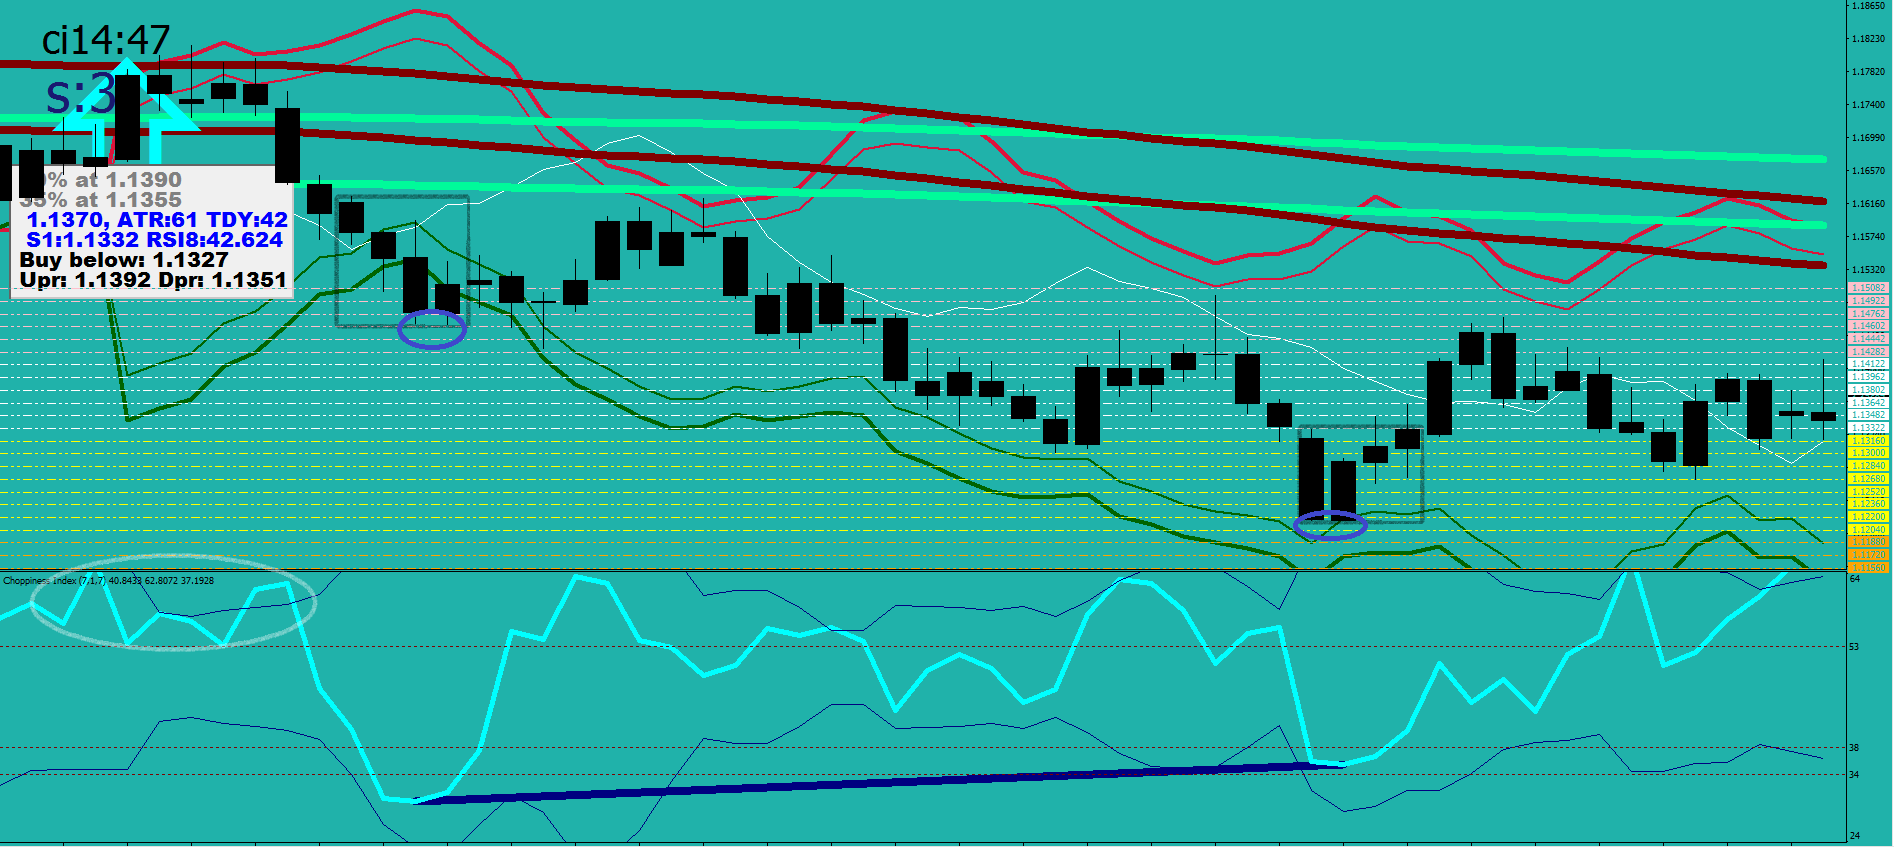
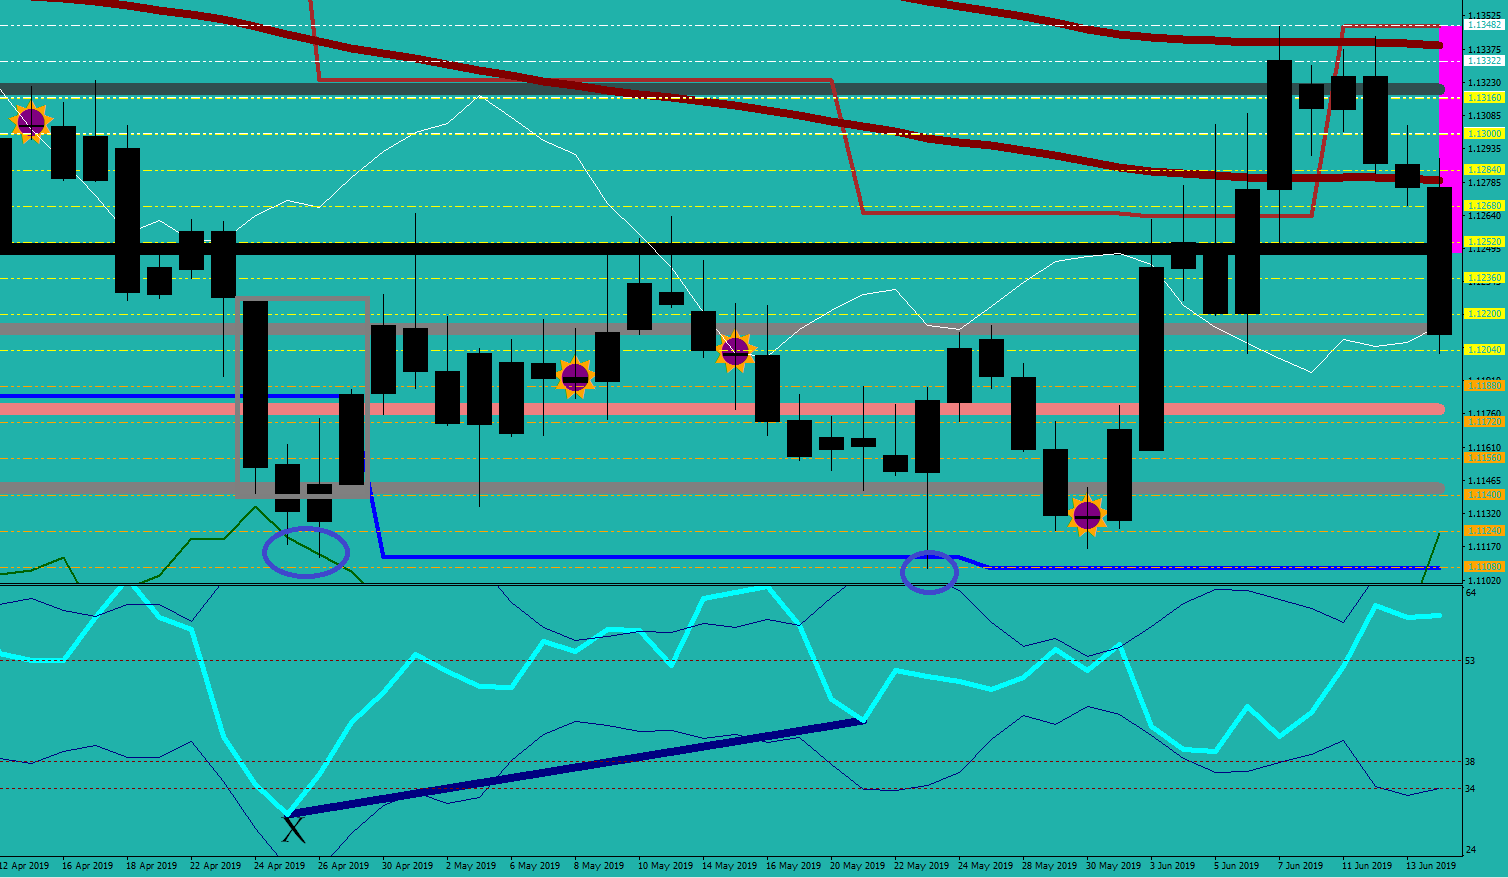
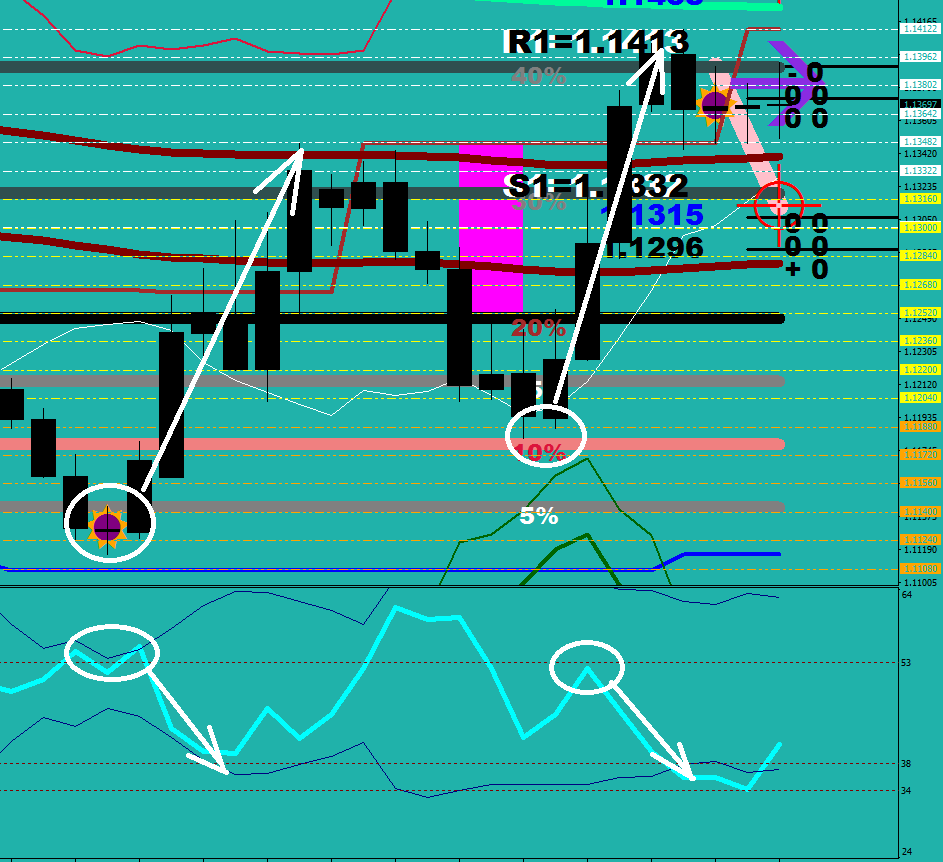
- what is an exhaustion
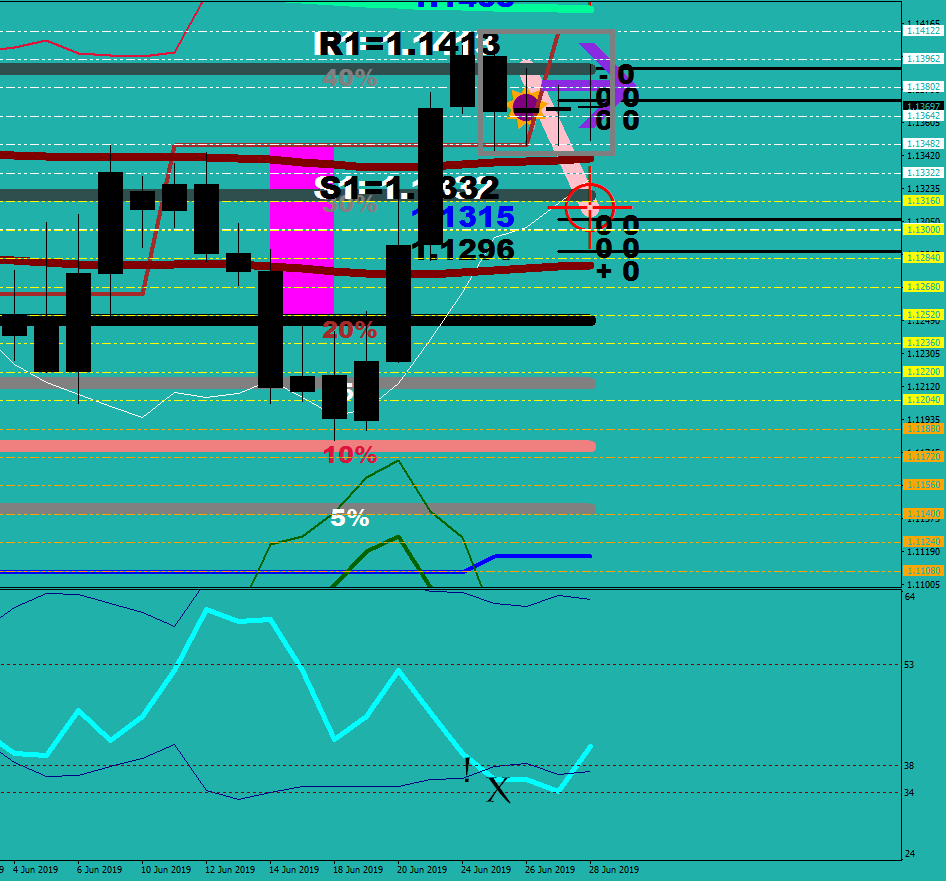
- what prompts a consolidation
- what state does the price make a starting push from?
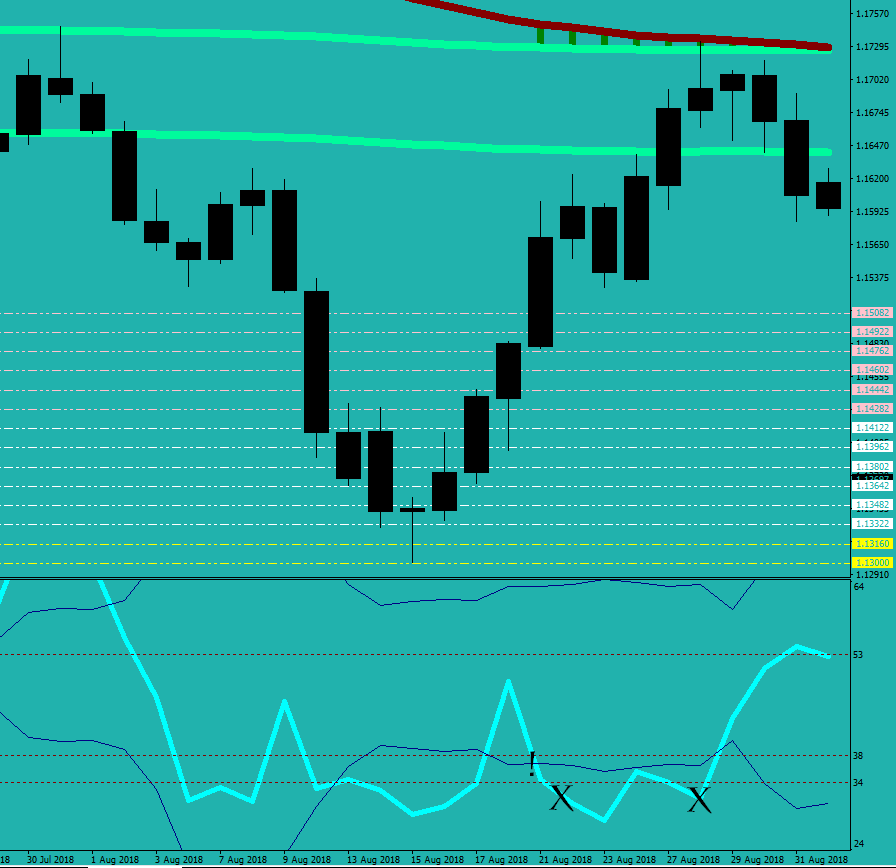
- what level on CI should be considered as highly consolidated?
- what level on CI should be considered as exhausted?
- how many candles needed at the minimum to consolidate energy?
- what happens when the CI goes outside the bands?
- what is a CI exhaustion divergence? what does it do?
- what else is needed along with the CI exhaustion divergence?


The calculation of CI – in TOS:
input TF = {default “1 HOUR”, “4 HOURS”, “DAY”, “WEEK”, “MONTH”};
def CI = ( ( Log(Sum(TrueRange(high(period = TF), close(period = TF), low(period = TF)), 14) / (Highest(if high(period = TF) >= close(period = TF)[1] then high(period = TF) else close(period = TF)[1], 14) – Lowest( if low(period = TF) <= close(period = TF)[1] then low(period = TF) else close(period = TF)[1], 14))) / Log(10)) / (Log(14) / Log(10))) * 100;
I can’t give you a copy of the Choppiness that David Moser made in 2009 for MT4, but it is out there, try to obtain a copy.
I use 7-sample CI on Daily, 4-Hour and 30-minute charts.
I use 14-sample CI to calculate the Energy bands.
