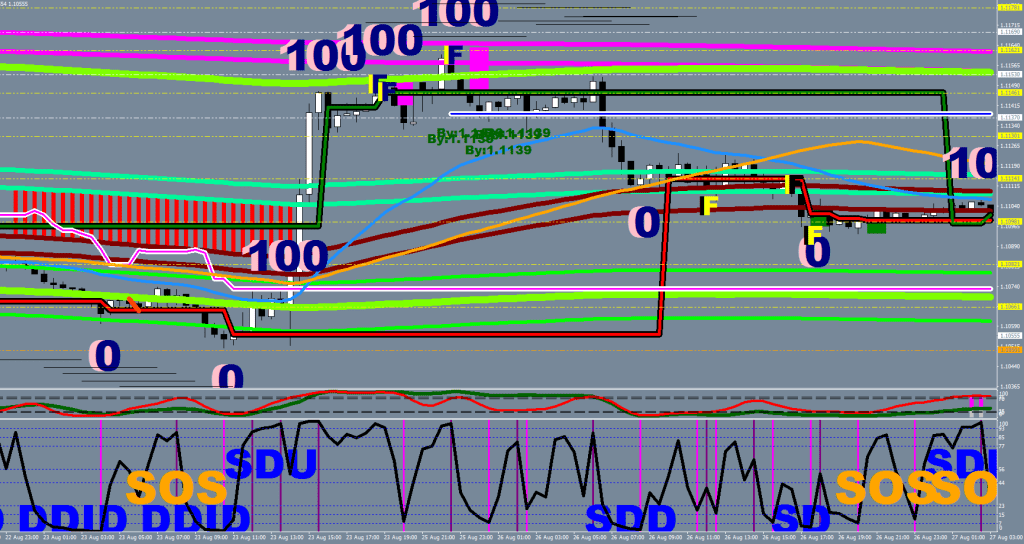
The Boogie man is a sign of strength at the wrong place and the wrong time.
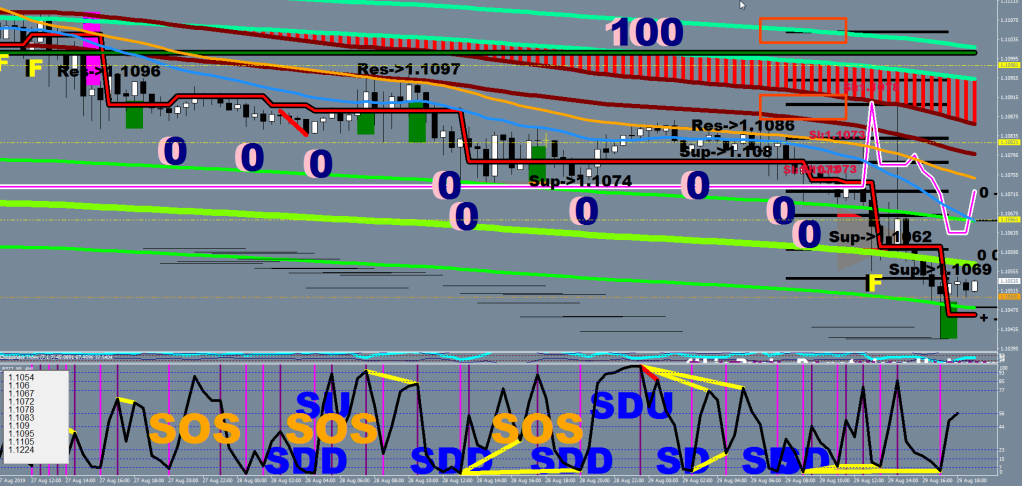
The wrong place is: in the overbought measured by 30 sample stochastic D over low/high with 3 slowing (green oscillator), and the wrong time is at the end of a cycle.
The upside attempts can be grouped as a trifecta, with the individual attempts as Whoop, Bam and Boogie.
The sign of strength means a spike on the RSI2 HL2 to above 80.
You should be interested in the upside if the SOS comes on the first strike, and should be turned off is it arrives (barely eeks out the score) late in the game.
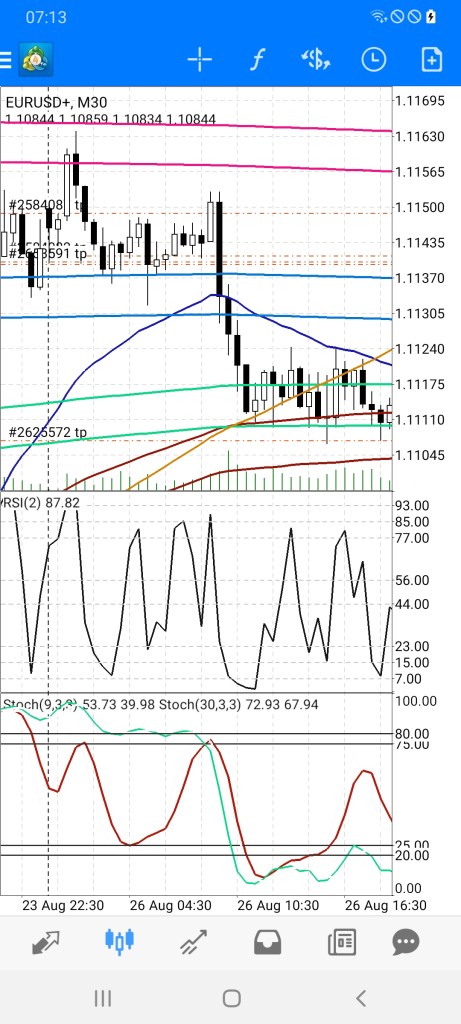
To add some extra content to this so far small blog entry, I should mention that with the reprise of Focal Candle I finally have returned to plotting hourly charts which brought along its 30SMA, so now I officially have 2 moving averages along with the standard E16.
The 30MA acts as a mediator, serves as a mean, and there are negotiations around it continue with the direction of the approach or reverse.
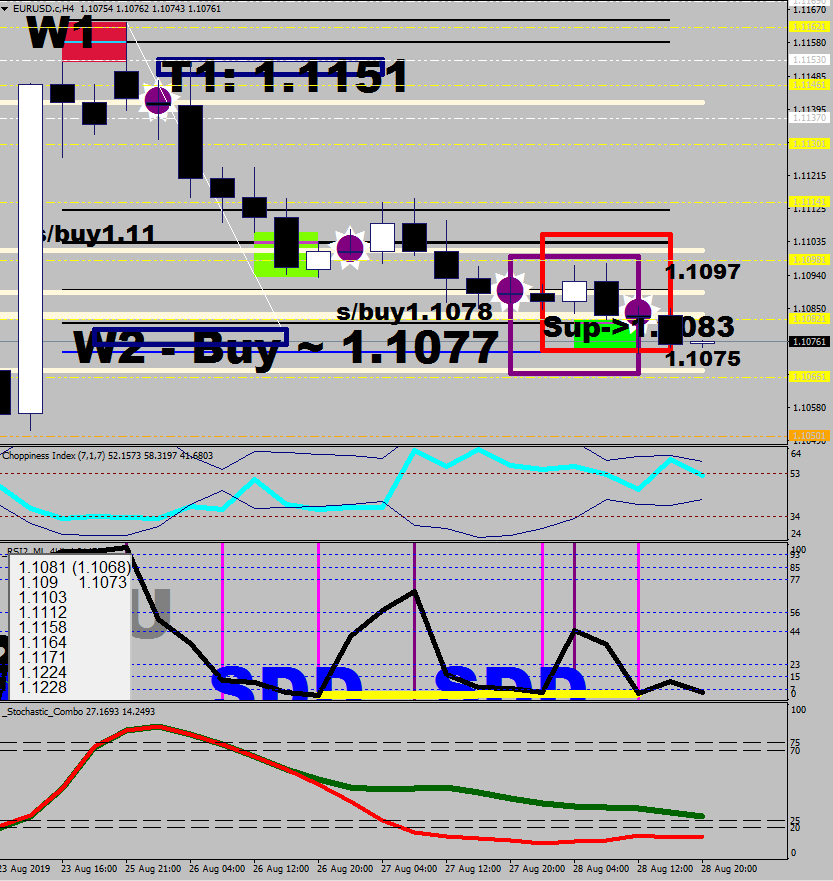
I don’t think I have discussed the 4H wave 2 finder routine so far, so here it is:
The idea is that the 4H Mr. Maroon (135E High & 135E Low) has been crossed for the first time in twenty-some samples and now we need to look up the second 4H doji in the past and have it faked out for a wave 2 / wave B.
Here it is:
…SOS attempt in the making
…now this was a tricky one. They utilized the bull vulnerability to the maximum possible extent. An SOS is a scratch if it spikes above the 30MA.
No sign of strength still since the last upper divergence. It is working on it now.
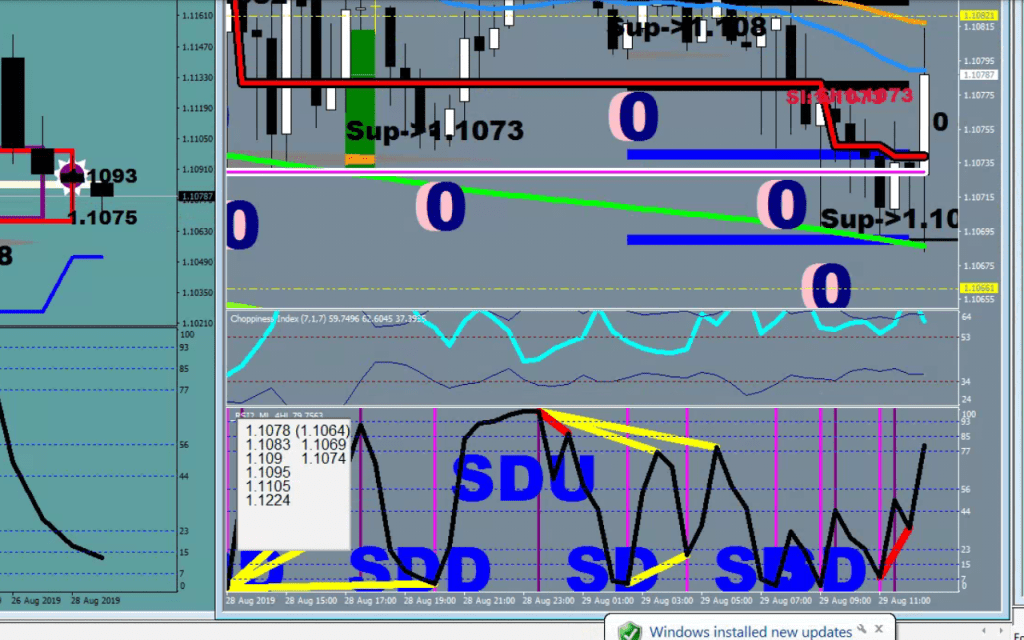
This was the ballpark target for the day based on the daily fuel:
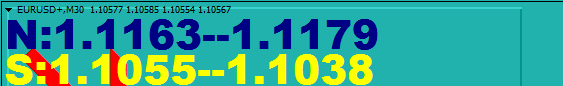
1.1042 seems to fall between those two numbers.
…one more thing, remember the steep rally a few days back?
After the SOS print, the RSI2<15 is your long entry.