Second time in a row I get tricked by a Wave 4 to believe that it was over already. Needless to mention, this throws off the wave count.
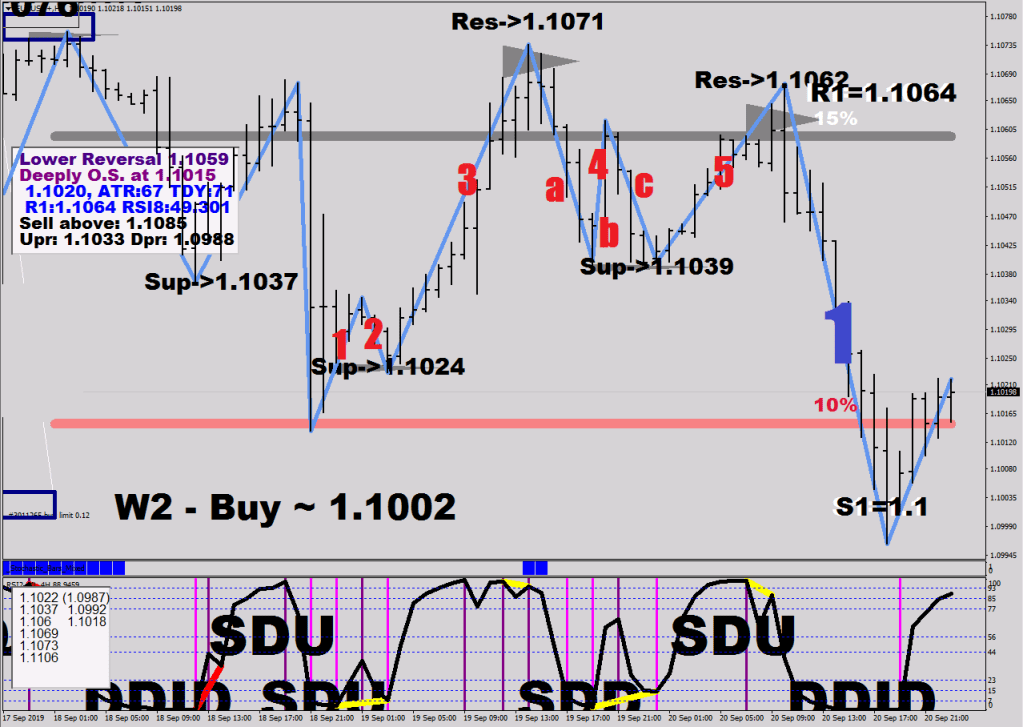
I made this image yesterday.
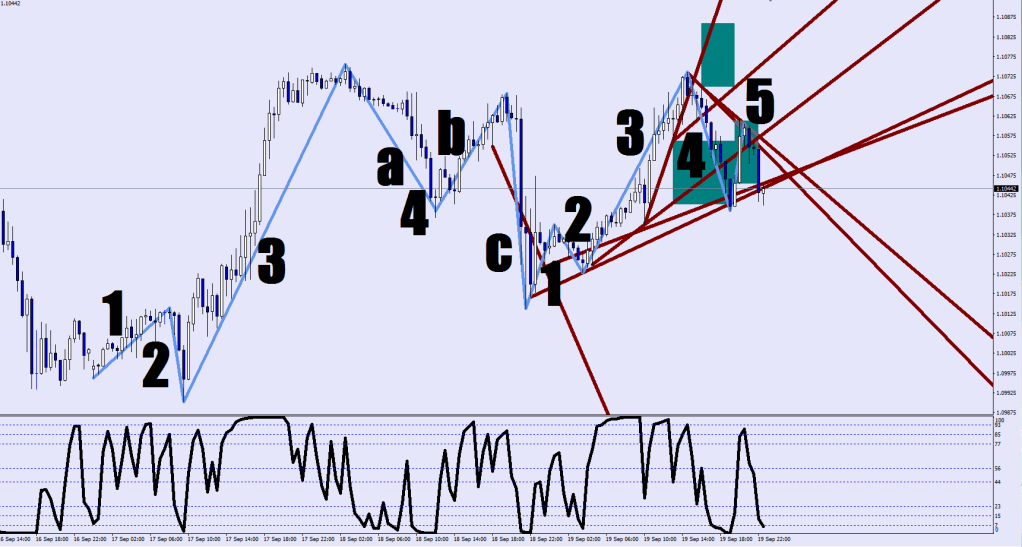
And that previous Wave 4 with its a-b-c was also longer than anticipated.
You see, Wave 2’s RSI2 extreme is the reference to the end point of Wave 4. Since Wave 3 has a tendency to expand on volatility, Wave 4 may end up showing up as three legs while the volatility starts contracting again.
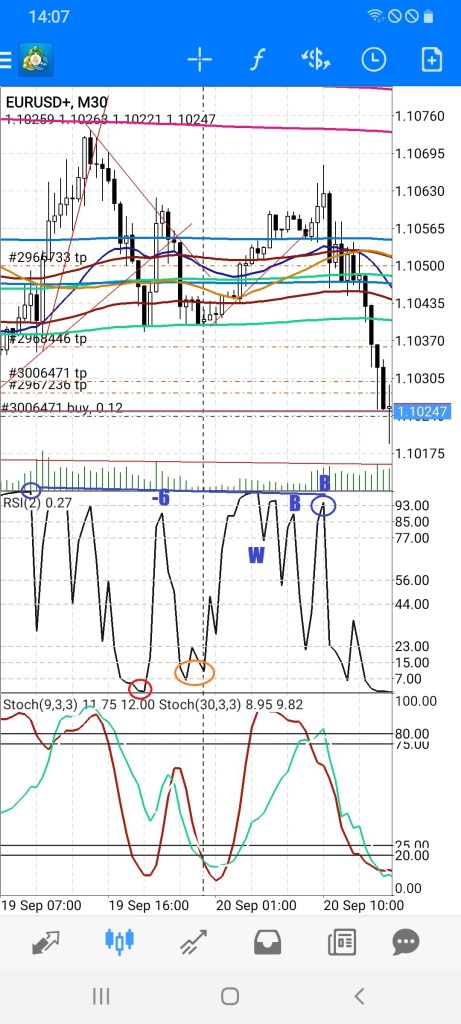
The Orange Oval are the ending, divergent thrusts of the C leg of Wave 4.
Wave 5 used the reference point of Wave 3, but it also went out on a limb by maxing out on the first try (Whoop). The “within six” reading should arrive in the right rhythm: on Boogie.
From what I see here, I can say that if the Wave 4 ends up violating E16, then you can expect one more leg out of it. One sign, that a follow-up is likely, that the RSI2 hits its limit on the pullback (0 or 100 on RSI2 30 min).
Another symptom of the 3 legged correction is that the 3rd leg takes a lot shorter time to print, because most of the orders already got filled on the first leg in the overlapping area.
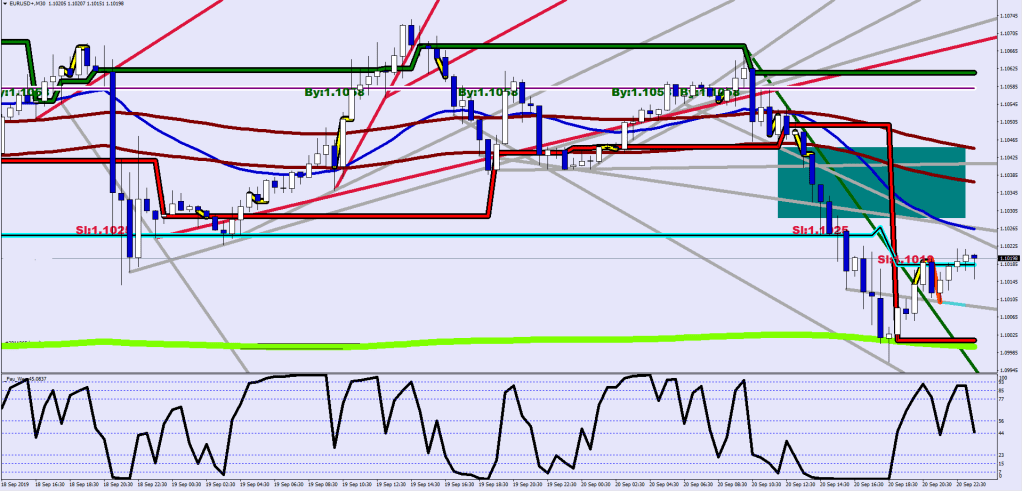
In closing, I would like to share a few things about trend lines.
- Avoid connecting the maxed out RSI2 readings
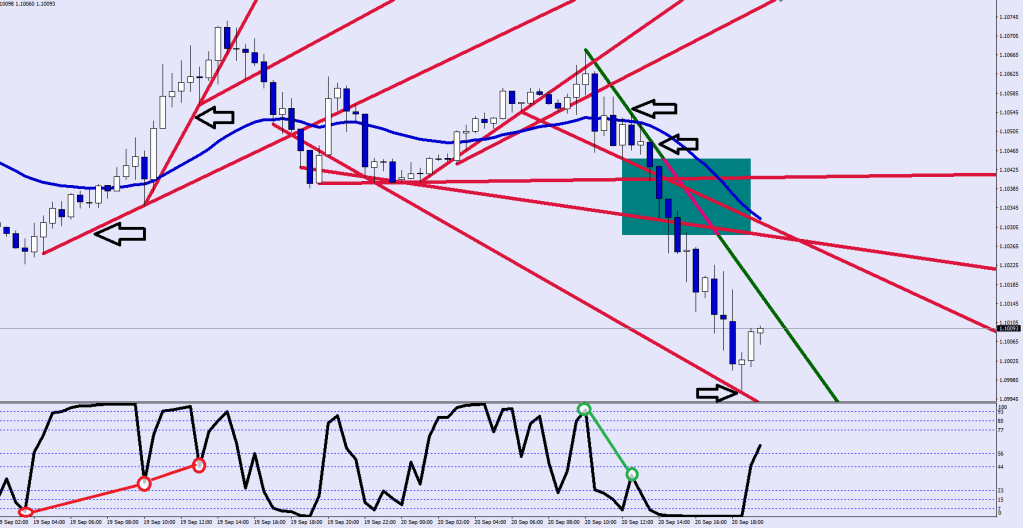
2. Using two colors can help you grasp the following thinking: when price is above the red line, it is in break out mode: trading above resistance. When price is trading below the green line, it is trading below support.
3. Trend lines can keep you in a trade longer, so it is beneficial to plot them.
4. Why don’t you make the plots automatic?