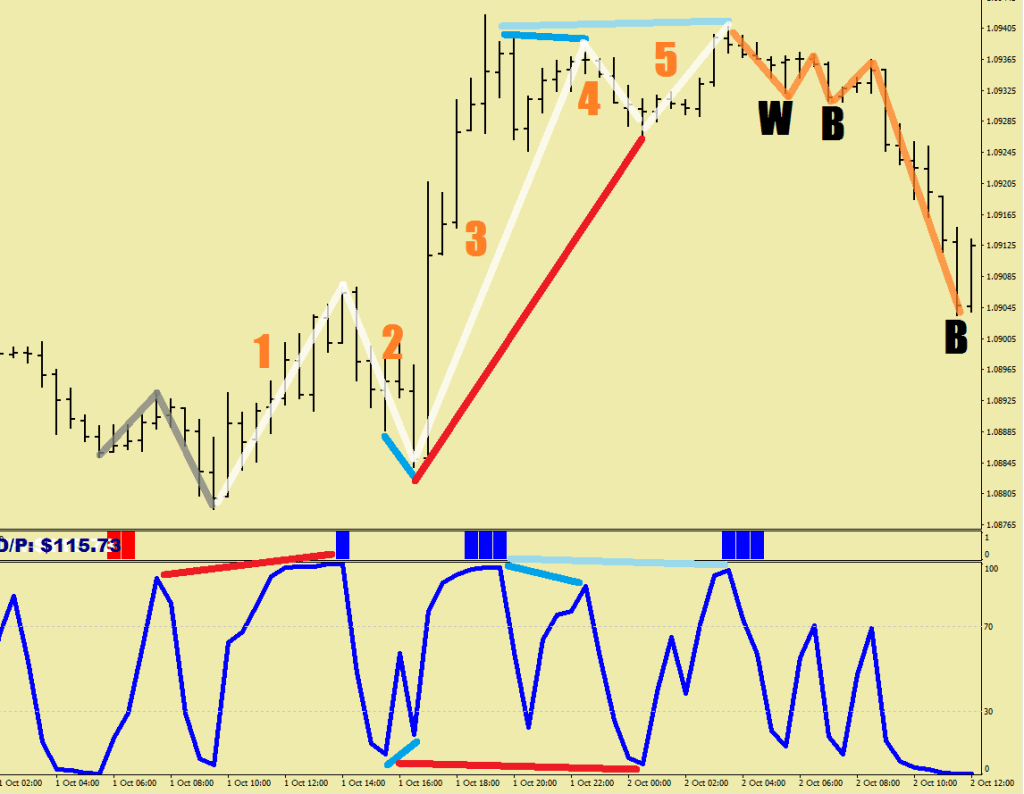
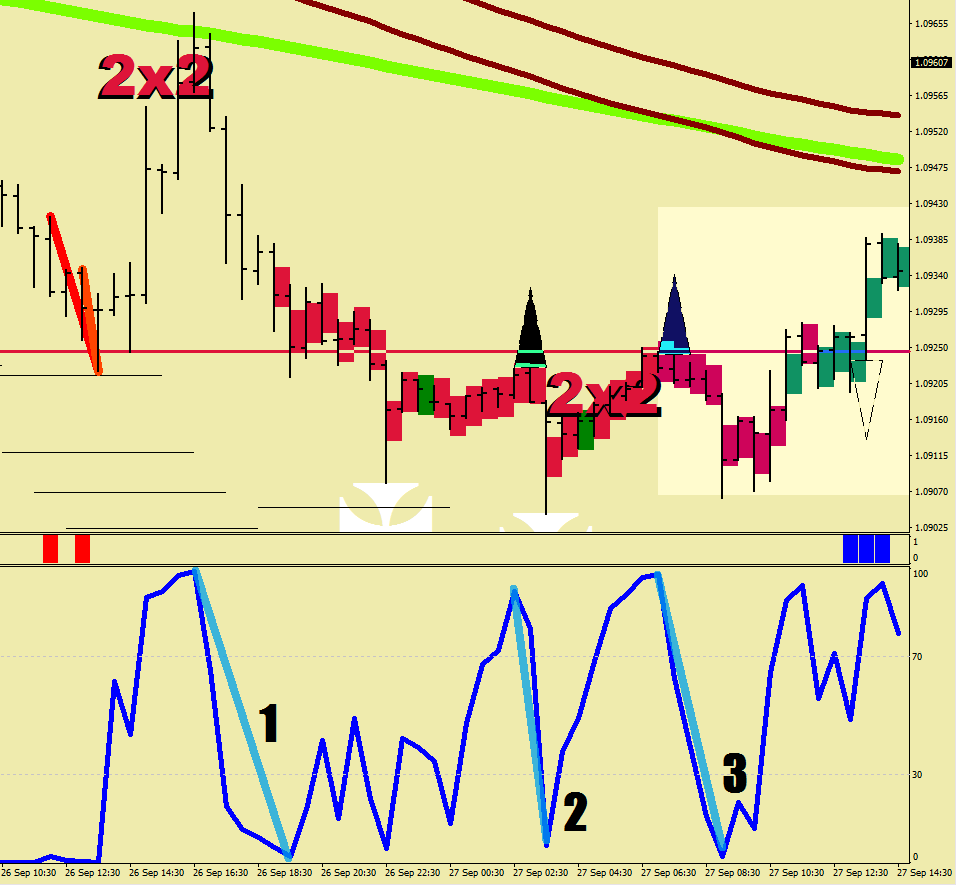
First let’s start with your exercise exercise in recognising waves.
- Please show me the volatility whip that preceded the wave structure to the upside.
- Show me wave 1 ending up with a continuation divergence to the vol whip.
- Show me wave 2 ending in a reversal divergence
- Show me wave 3 ending in a reversal divergence
- Show me wave 4 ending in a continuation divergence to wave 2’s terminal RSI reading
- Show me wave 5 ending in a reversal divergence to the peak RSI reading
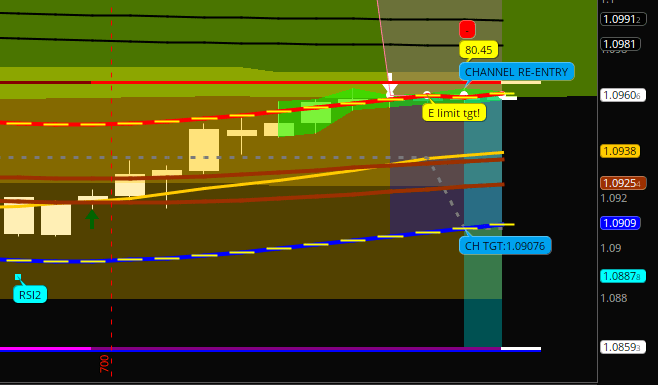
- Tell me what wave we are in, and if it has reached its target. Why? What structural support do you see for a confluence with the continuation divergence?
For plus points explain what effect did the volatility crush have on wave 5. What is the biggest enemy of volatility? What RSI reading would wave 2 up have to reach so that wave 3 down would can score its full lambda?
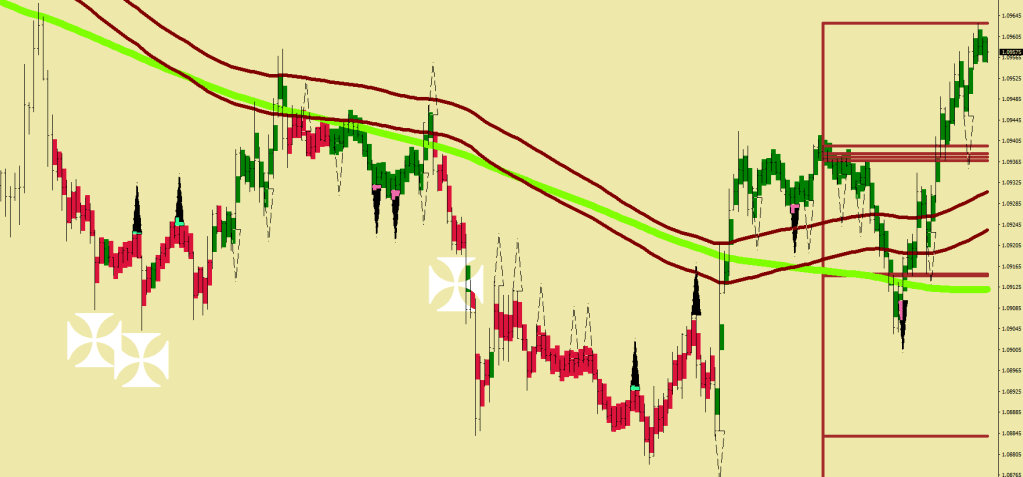
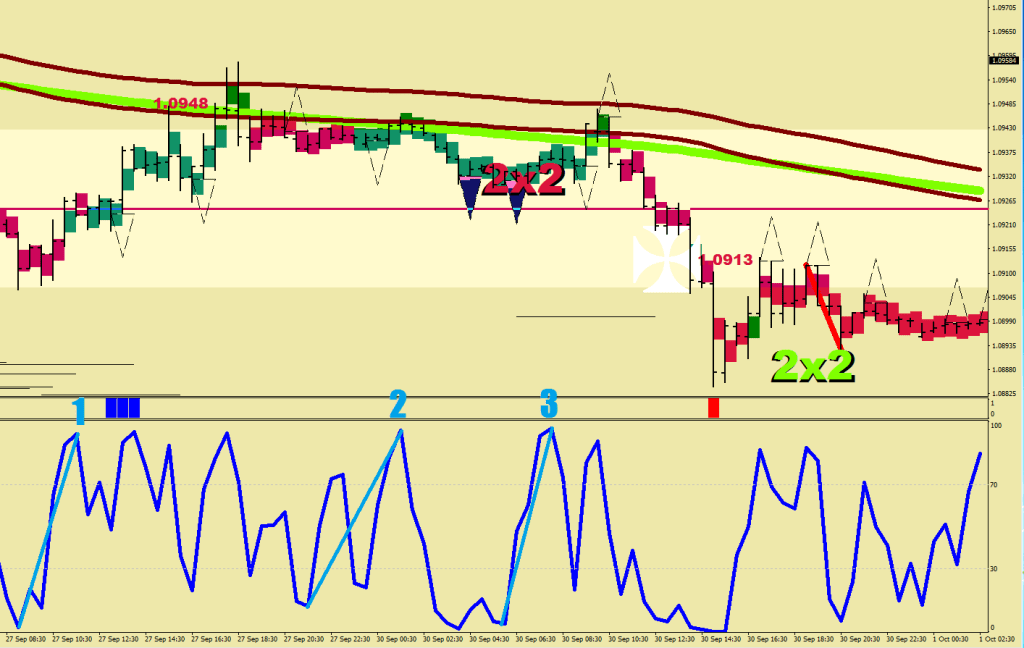
Now, for the 3 Full Lambdas
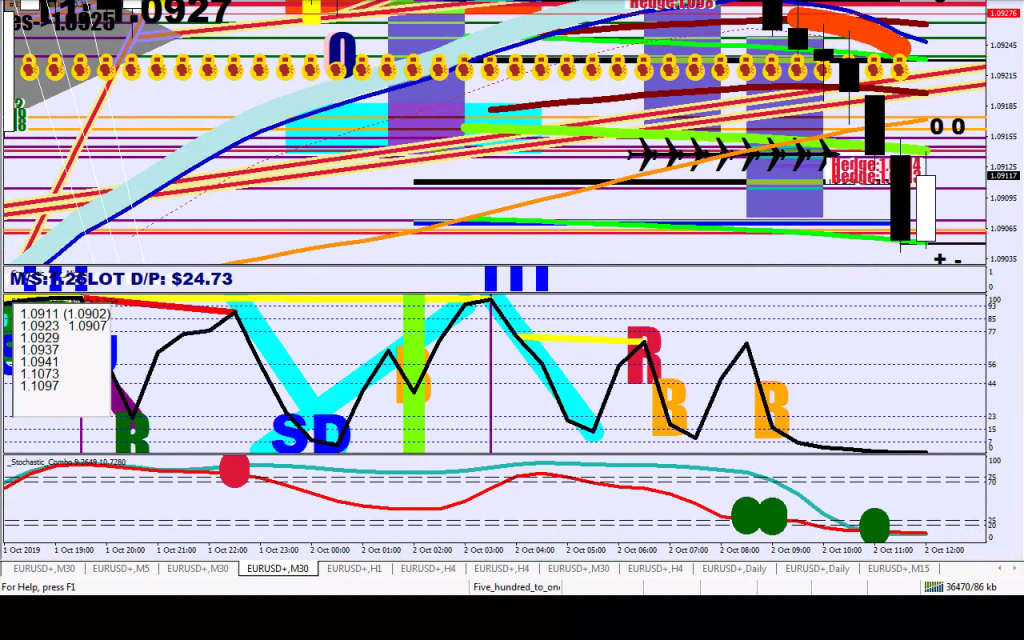
I count lambdas on 30 minute, maximum 10 samples reaching a span of 82 points.
For finding these quickly, without having to measure at all, you can utiliae the blocks I marked up on my RSI plots: if one end falls I an outer box and the other end touches one box in, price has made the span.
The next image shows 2 down full lambdas in cyan marker, but only the one on the right should be counted, for the other one was before the upside structure got completed.
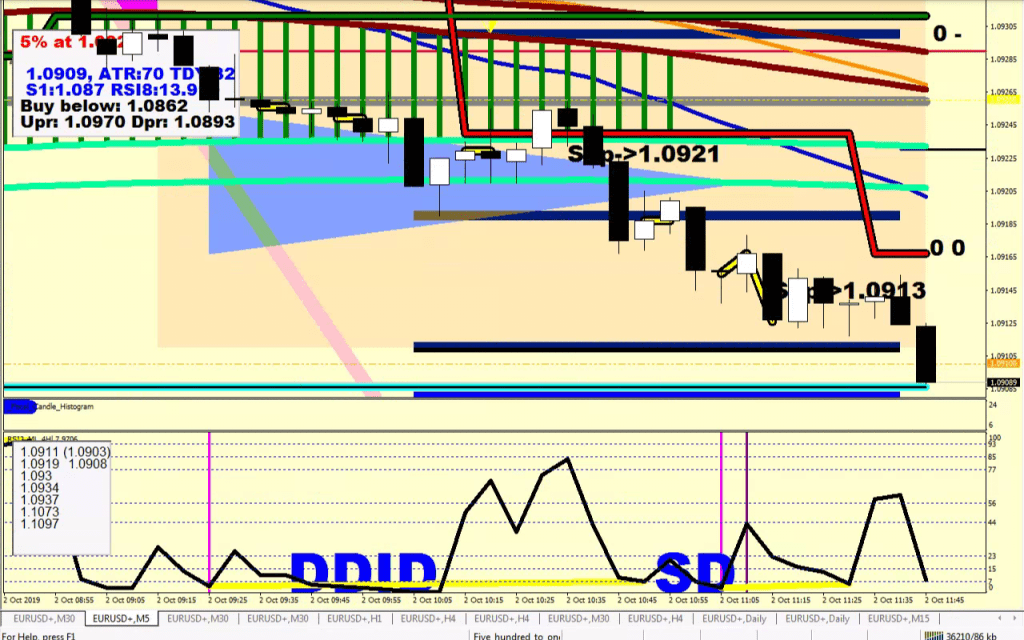
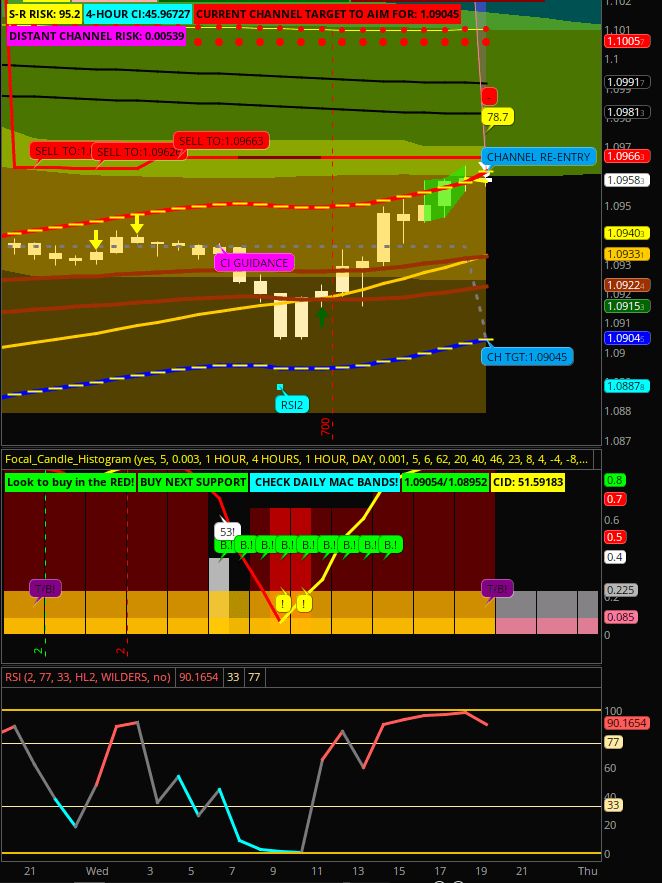
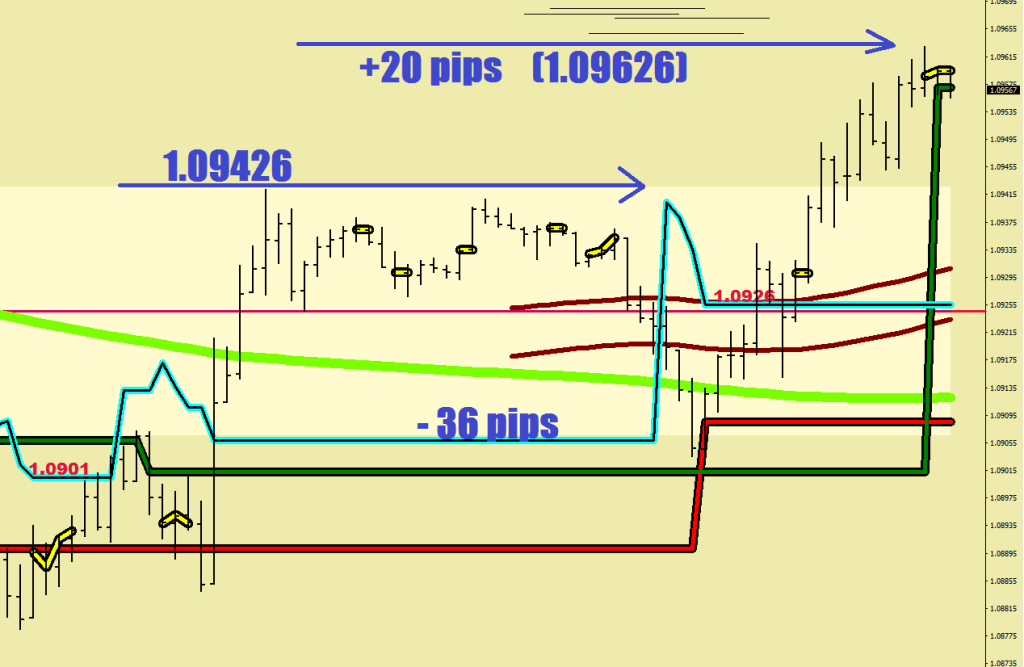
I’m not at home yet, but I need to make one correction. After a Wave 5, you do not always get a Wave 1 in the opposite direction. At times, you would get a volatility whip – one I just pointed out earlier – the second, in the opposite direction just transpired. These no break extensions are follow ups to a volatility breach. See the 4h image below.
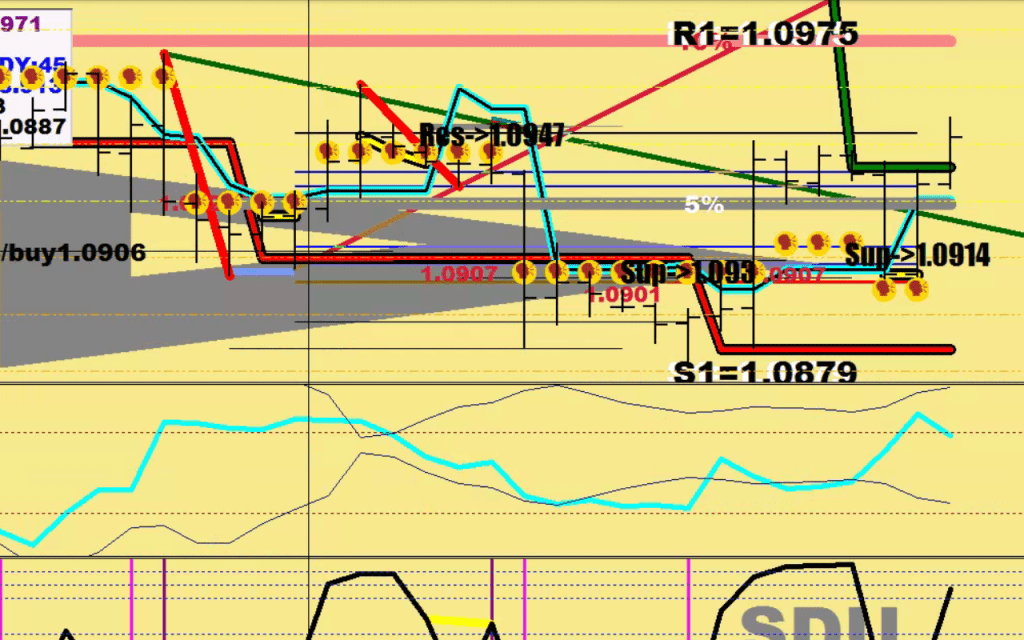
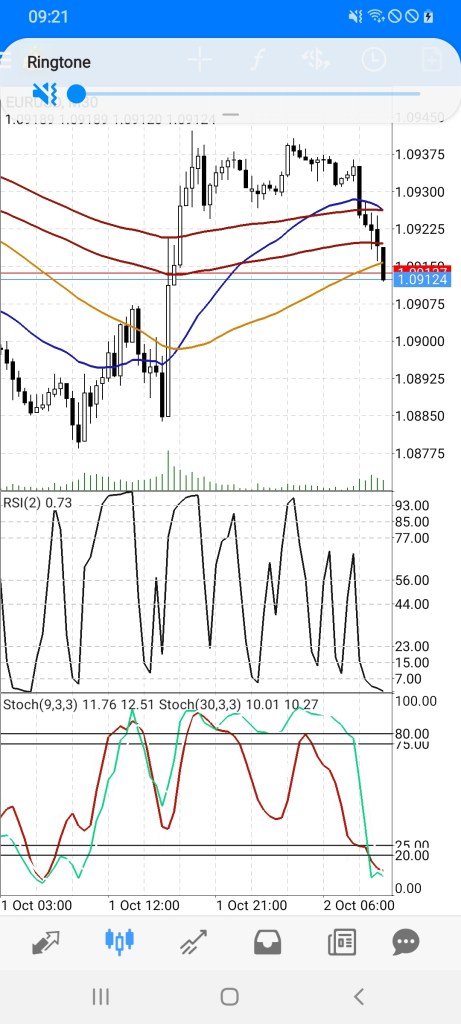
The divergences I was asking about
Current channel target reading
RSI2 Direccione
PKTE Boxes
4 pips failure
16 pips failure
26 pips failure
36 pips failure
3 Full Lambdas 1
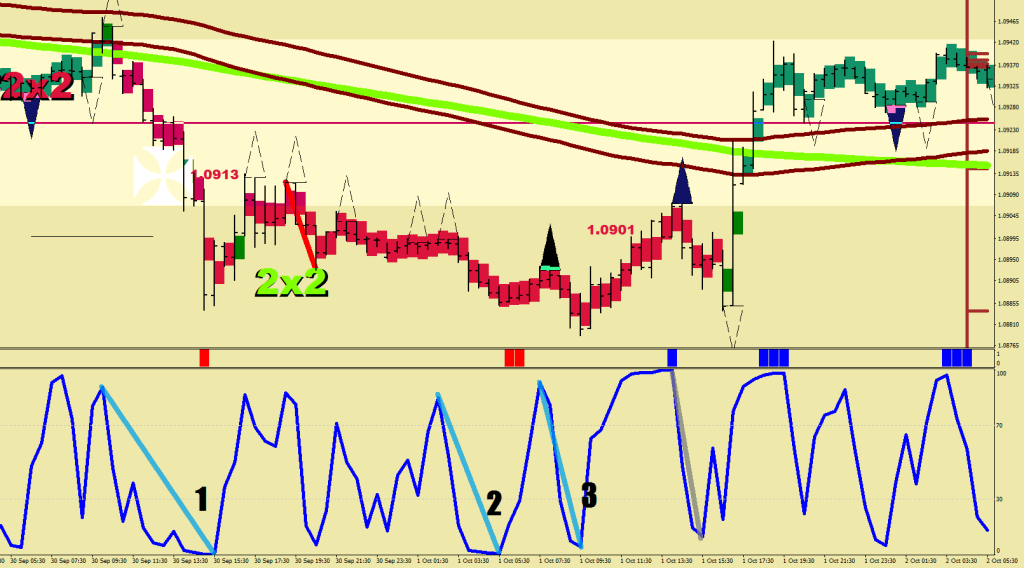
3 Full Lambdas 2
Energy limit target: 1.0859