The last wave does not end on a high/low note, hence the back test of the top / bottom for measuring purposes. The divergence at the back test of the top is shown by the black lines. The failure lines are relative from the Wave 3 peak.
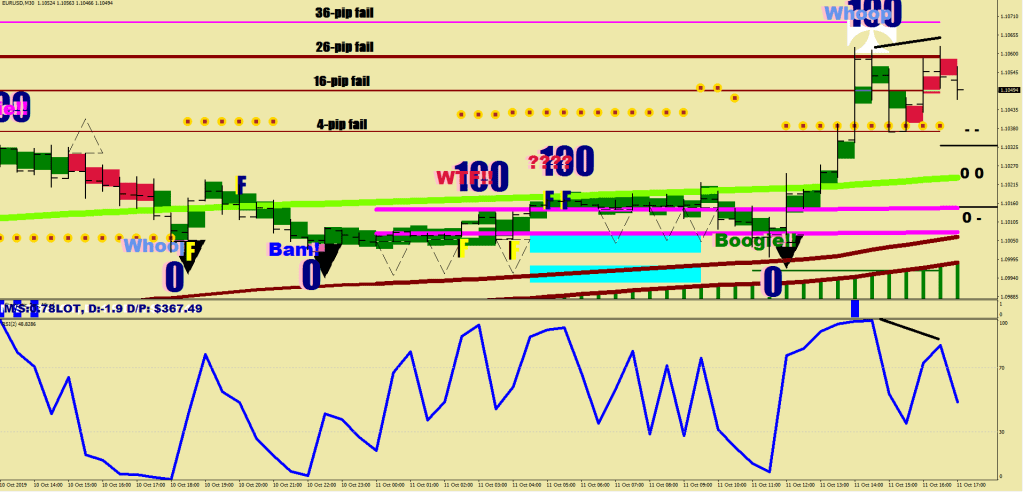
Admittedly, it was a little hard to separate the wave 4 from the wave 5 because of the undercut of the low, and 30-minute wasn’t the best for that.
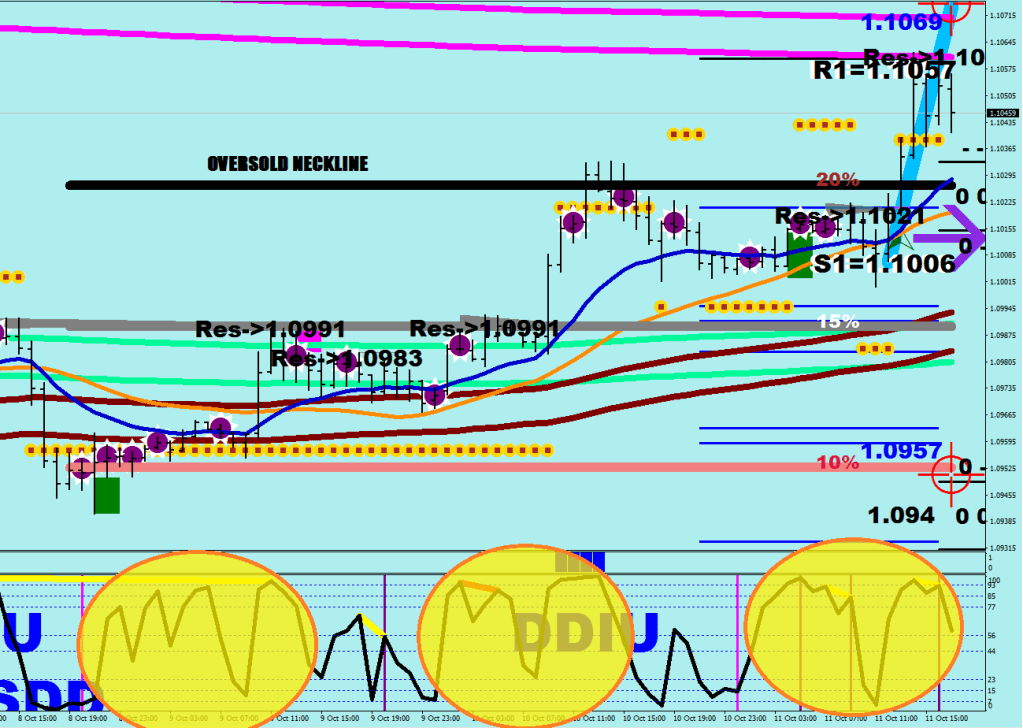
So what exactly went down (beyond a possible fake out of the long term oversold neckline / bear market).
So what now? Being outside the oversold for one day does not change anything, it is called “saving” if the next day closes back in the oversold.
If you end up with multiple closes outside, the market would have transitioned to a balanced/commuting market where the bulls should be aiming for the median at 1.1250 as primary goal.
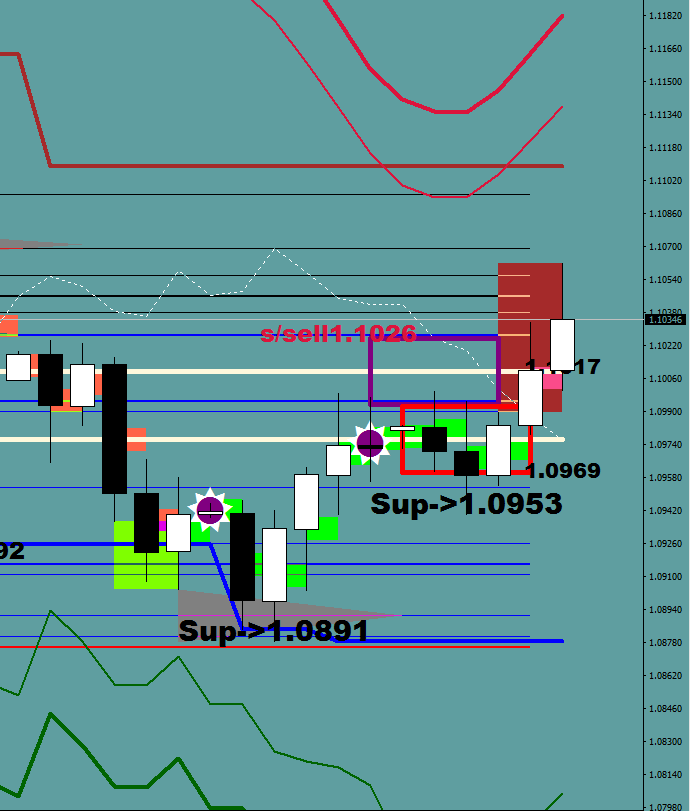
Most likely you shall see the long overdue ABC correction – usually 2 4H dojis lower for the hourly stochastic would have to go oversold twice. This would put price back below the 4-H Maroon at 1.0974 with a small, say 10-pip undercut for good measure.
However is all the selling that is about to take place would not be able to keep the price below the oversold neckline, the bear market would be over with until further notice.
It would certainly clear up the intentions to see where they place the price upon the Sunday open.
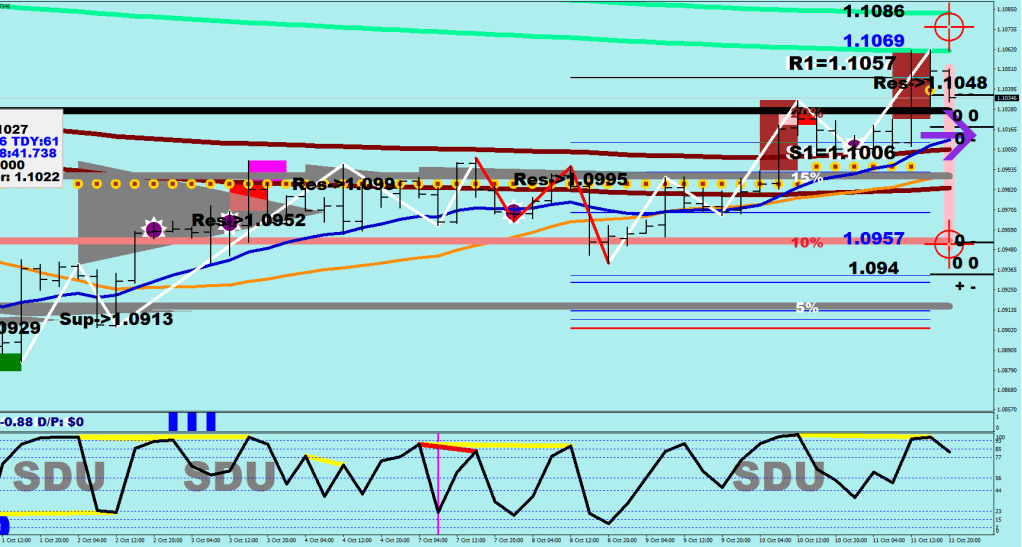
Current location of the Energy Bands
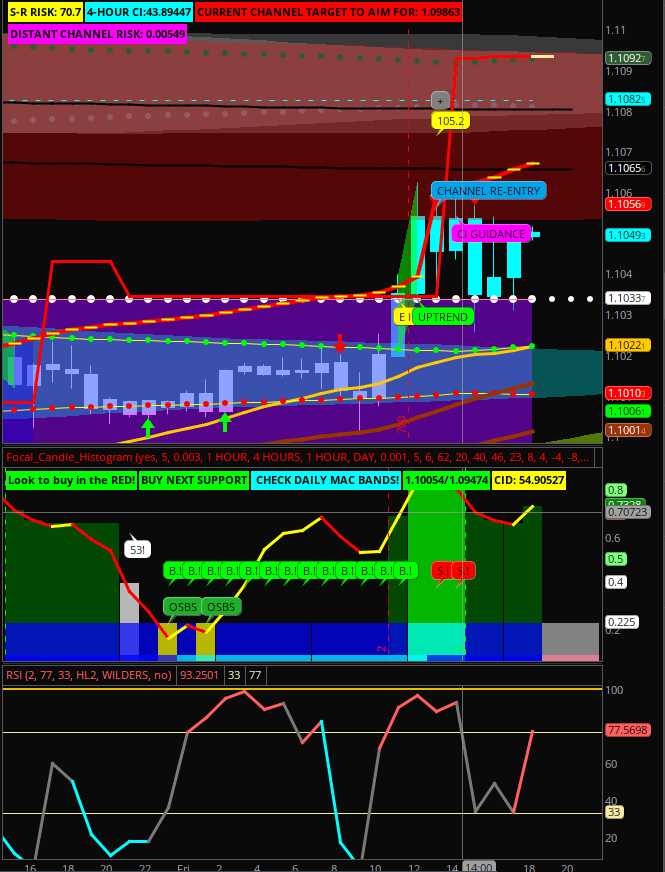
The 4-H Wave Structure: