
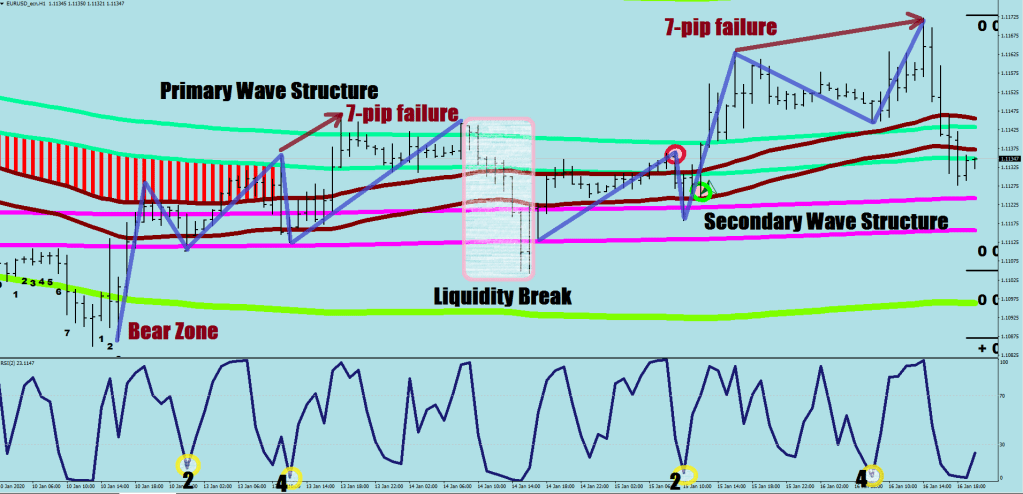
The Secondary Wave Structure is a volatility freak.
It is brought on by a prolonged, 3-wave quick break (the waves may be only visible on 15 min or even below).
The secondary structure does not have a good footing, for it does not originate from a stretched zone (Bull Zone or Bear Zone) and is preceded by a primary wave structure.
I call it a volatility freak, because the actual, directional turns (from Wave 2 to Wave 3 and from Wave 4 to Wave 5) only happen at extremes with a well pronounced continuation divergence.
Wave 1, 3 and 5 in the secondary wave all set up reversal divergences (30 minute chart) and Wave 5 has a defined 3-wave push playing out.
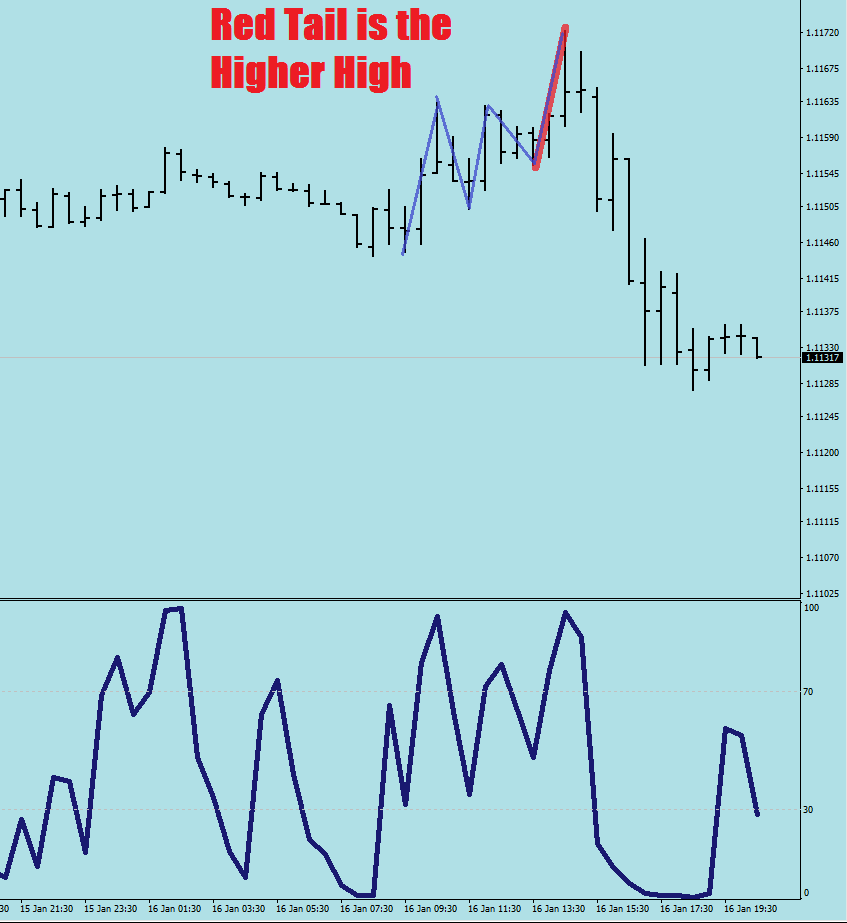
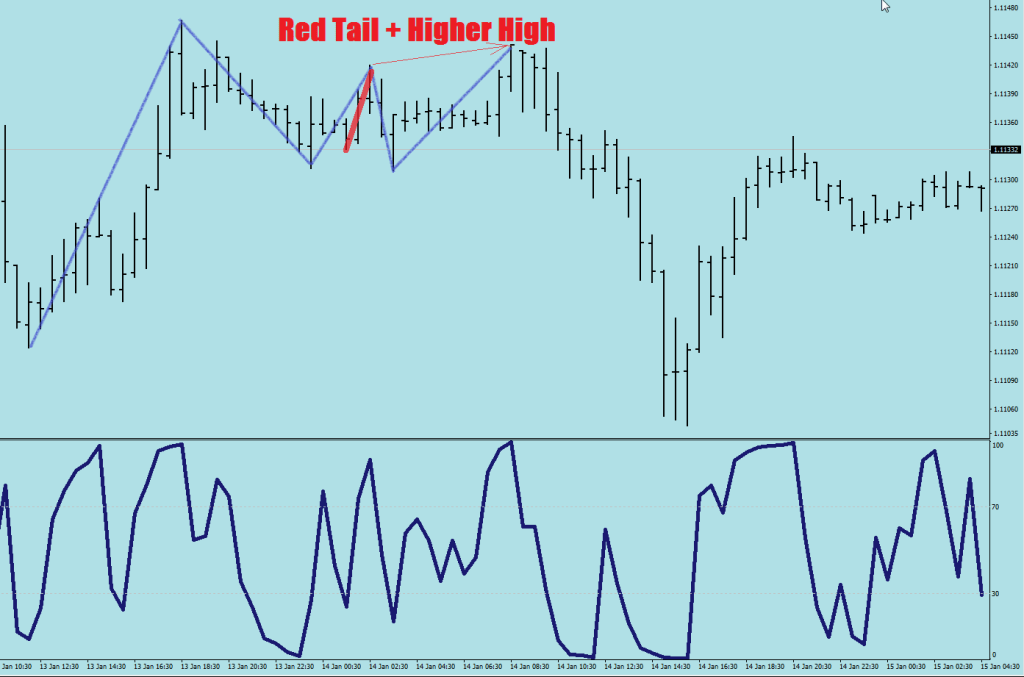
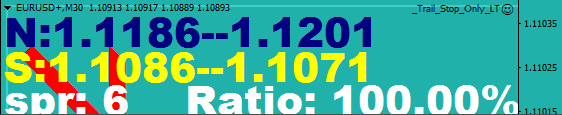
One hint would be looking for a red tail + higher high / lower low (depending on direction) on the 30-minute.

…
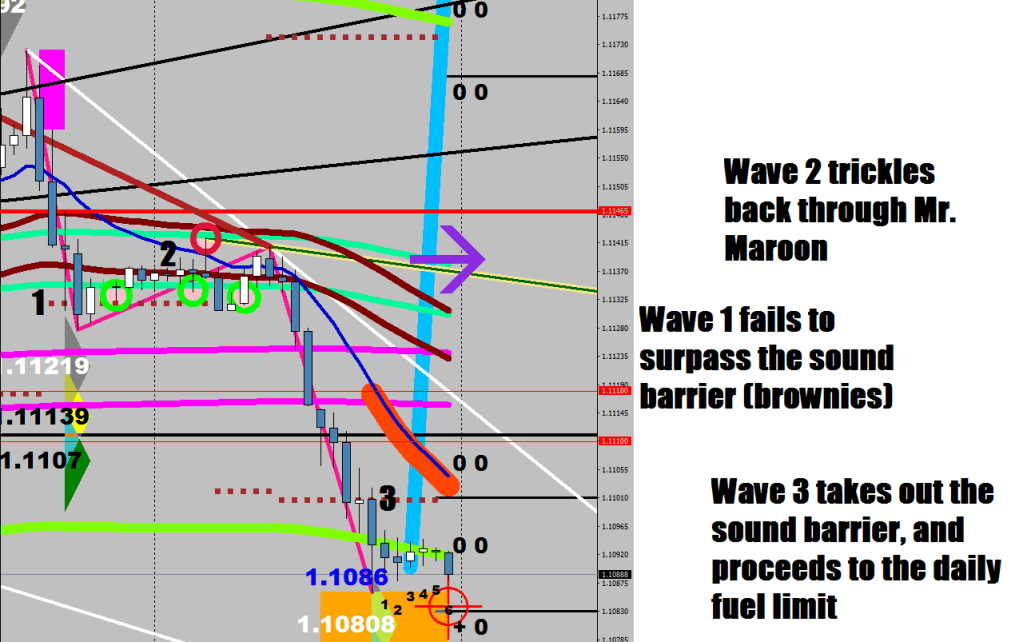
The daily fuel limit was known even before the day had started.
The final Countup is on.
The 5th Wave is expected to start from beyond E-16.
…
finding these two red tails:
ExtDownFractalsBuffer[i+3]!=EMPTY_VALUE && High[i+1]-Low[i+3]>80*Point && High[i]<High[i+1] && High[i+1]>High[i+2] && iMA(symbol,0,32,0,MODE_EMA,0,i)>iMA(NULL,0,135,0,MODE_EMA, PRICE_HIGH,i) && Close[i+1]>iMA(symbol,0,32,0,MODE_EMA,0,i+1)
      && Low[i+2]>iMA(symbol,0,32,0,MODE_EMA,0,i+2)
&& Low[i+3]>iMA(symbol,0,32,0,MODE_EMA,0,i+3)
&& Low[i+4]>iMA(symbol,0,32,0,MODE_EMA,0,i+4)
&& Low[i+5]>iMA(symbol,0,32,0,MODE_EMA,0,i+5)
&& High[i+1]>iMA(symbol,30,414,0,MODE_EMA,PRICE_HIGH,i+1)

