
So, EUR/USD is trending. The price of the Euro is being adjusted down.
This is one of the rare occasions, when the Energy Bands get exceeded.

What works?
1. The understanding of where is the mean
2. The understanding, that the channels are parallel with the mean.
3. That there is a 1x and a 3x stretch condition from the mean that are of high importance.
The mean is the High and the Low of the 207 EMA on the 1H. Plotted below nowhere, but both the guard rails in green and the purple brains haze lines are measured from it.
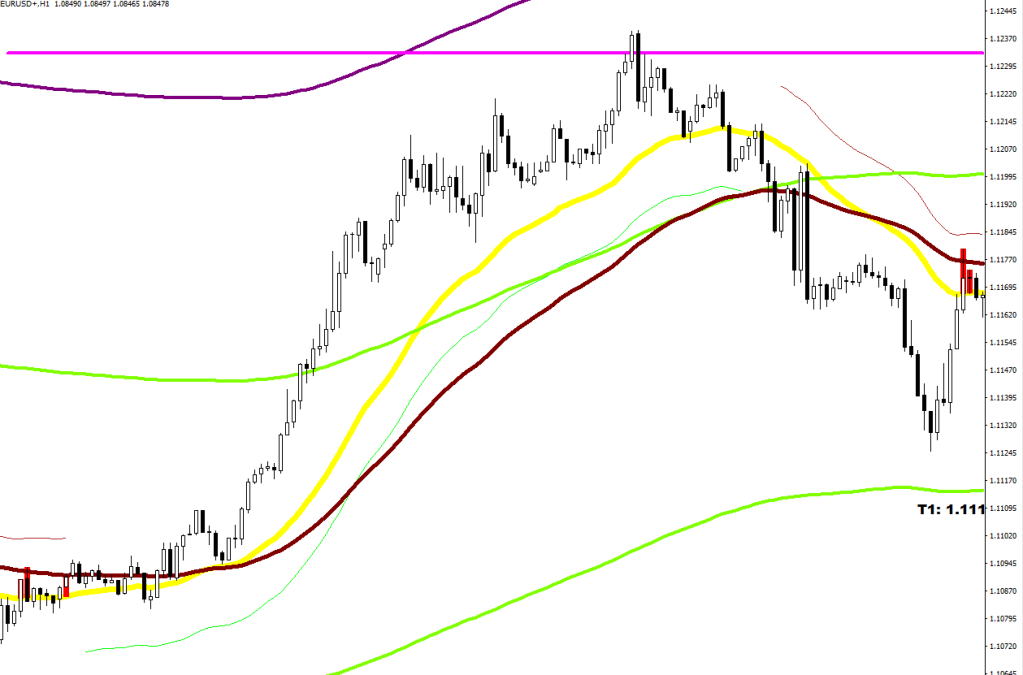
Your directional entry is always the same: the other side of the Yellow E32 lone with an RSI 2 read fizzling out.
The music is a 60 period stochastic signal line with 3 slowing. That produces the thin lines with 1/2 fluctuation distance away from E32 (kind of a warning – stop loss nearby – things are about to change) trend following lines.
As for the exits, which may end up becoming the very level the market turns at, they are derived from the location of the channel lines at the time of the invocation. Some hold out helps at times. I already added a 8-sample delay to get a visual reference.


The first channeling move down ended after a period of no entry calls by price not being able to surpass E32, and the last purple projection was the level of interest. The next lower high was the touch of the upper guard rail. The area was at hand from the green invocation boxes and the corresponding T1 prints.

The second channeling down is the prolonged down move between the green and the purple. Load above E32, unload below the encounter with a T2. Rinse and repeat. When the magenta line got exceeded – that was the end of a Wave 3 to the downside: price went too far.

Not that Wave 4 was a major move back up, it was more of a flat, time waste for a re-consolidation before the last move down. Wave 5 also had a separation section where price could not get back above E-32, and the level of interest was again the last invocation prior to this.
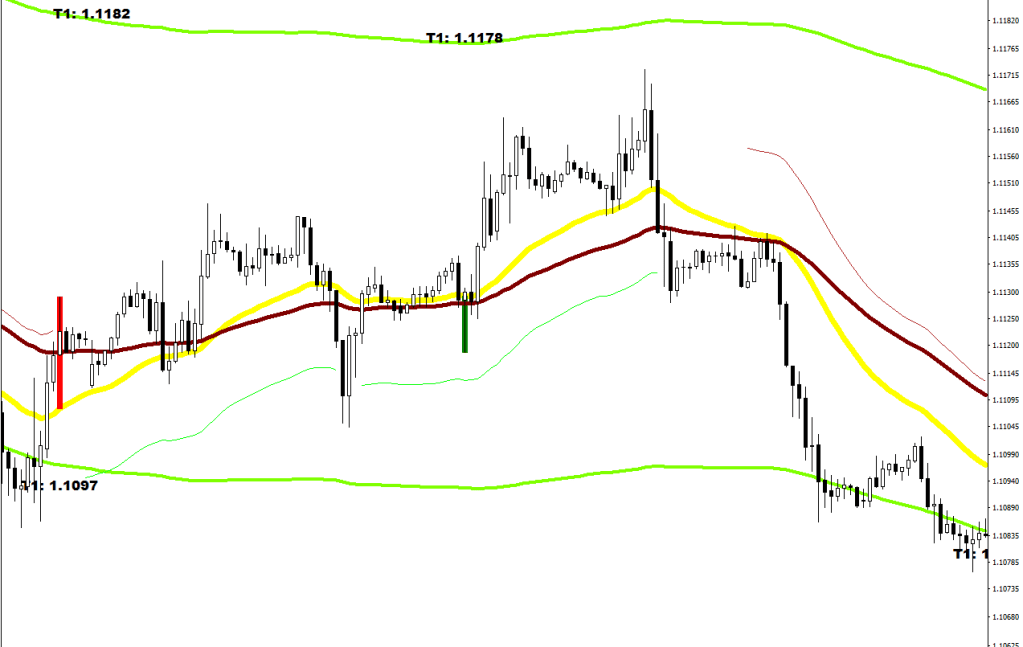
Wave 1 up was exceeding Mr. Maroon and Wave 2 pulled back did not result in a lower low – your subtle changes. Wave 1 of Wave 3 up exceeded Mr. Maroon again, and wave 2 of Wave 3 pulled back just beyond E32 for the perfect wave 3 of Wave 3 long entry.
The first touch of Mr. Maroon was a sign of strength to which the response was dumping shorts resulting in a lower low.
Now, you have seen a mean reversion and a wave 4 of Wave 3 was printing into the close.
Since I used Histograms for the shadings, I had to make an indicator pair.
Where to Buy and Where to Sell are available if you would care donate something for them. Name your price to
macdulio at yahoo.com
They are not for every instrument under the sky, but were made with the knowledge and understanding of EUR/USD fluctuation distances. I tend to throw in some perks as well.
…
New function added: The Below Counter (to understand which line to extend and the overall wave structure)
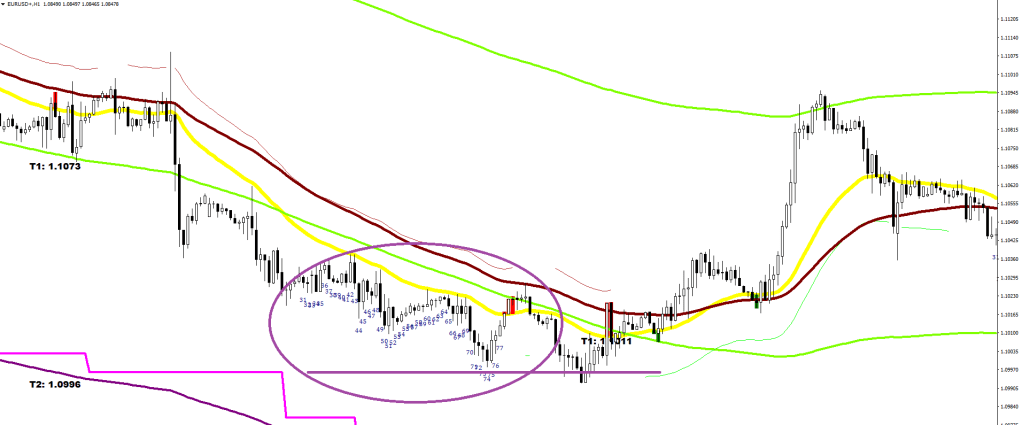


& above counter as well to keep things symmetrical

…
Level Of Interest (LOI) added


