
The RSI2 Hedge.ex4 has gone through quite a bit of evolution.
The previous RSI2 Hedge article discusses some of its plots appearing on 30 minutes for directional guidance. There has been changes since, but this article would be concentrating on the new hourly signals.

This is more or less what you would see for plots. Going into the day you can see that the suggested side has shadow contour. Buys go hand in hand with oversold RSI2s. The white stripe means full charge as per usual.
All the other trades were valid as well if they got a fill, just keep in mind that they are counter-directional ones and would need monitoring / protective stop once in gains.
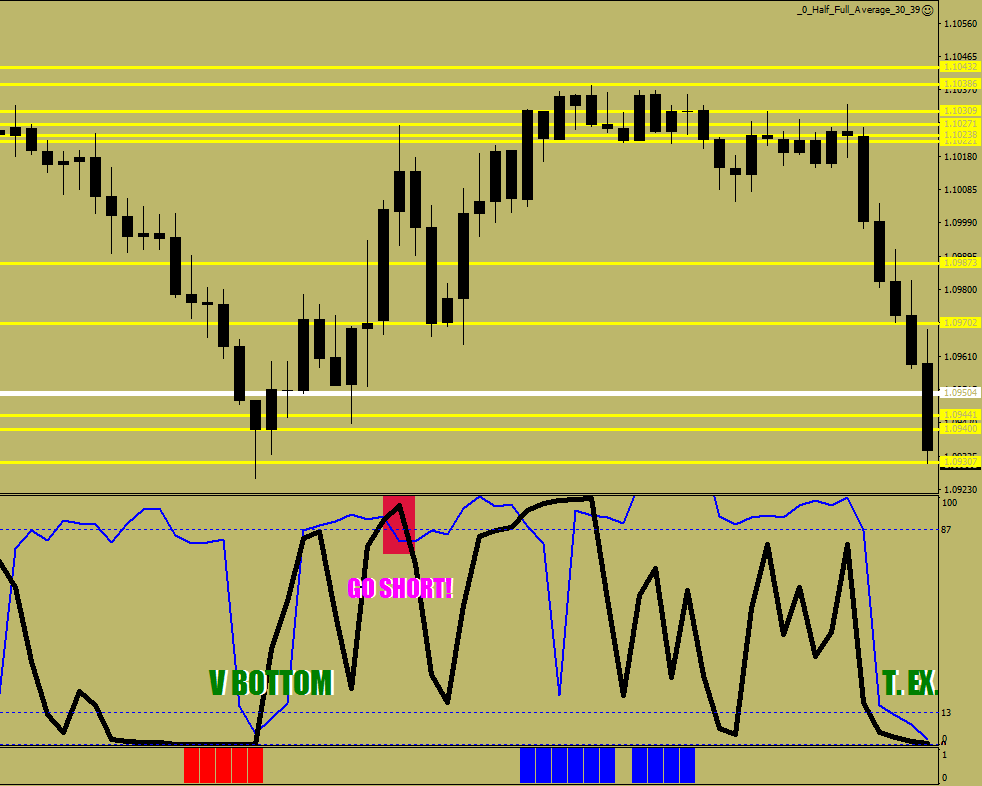
The new signals revolve around the liquidity break purple diagonals.
You can see clearly that on the way down the suggested trades were on the downside.

T. EX. means total exhaustion.
The highlights correspond to the red/green shadings below.
When you have the right side figured for you by the program, my Stochastic Bars Mixed w Levels can give you all the levels on 30-minute.
Its basic function was to show overdrive readings with blue/red bars, it has a Maximum Size figured for 1:500 leverage, the D is a directional risk (positive/negative) exposure lot size, the D/P is the P/L for the day.
The lines are figured from the overdrive values.
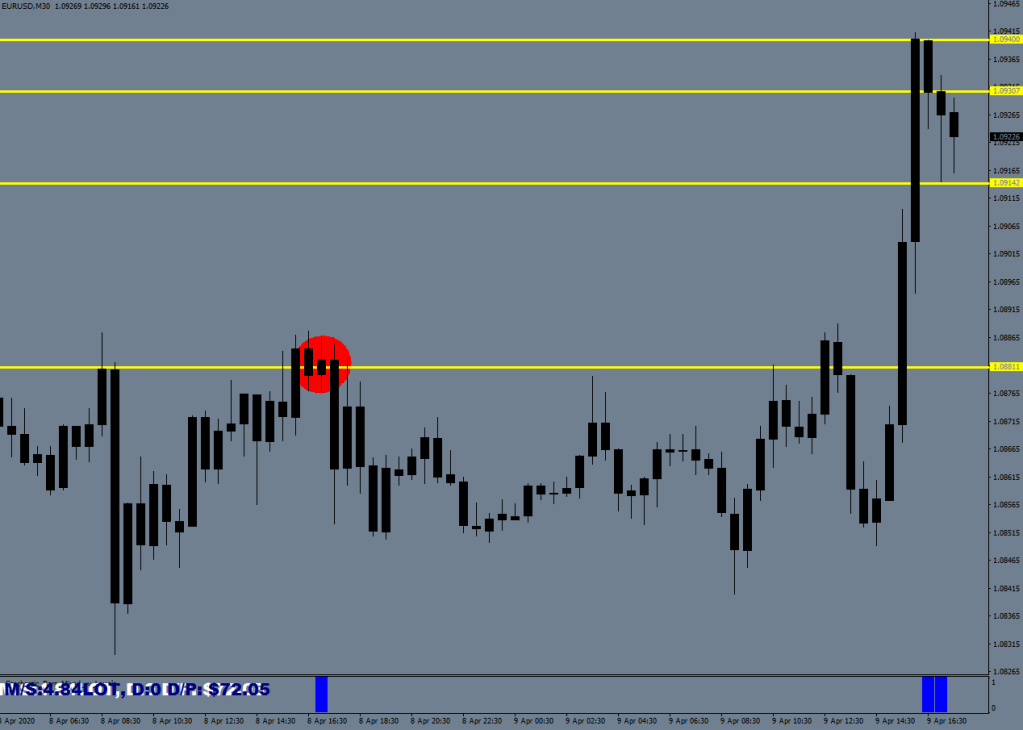
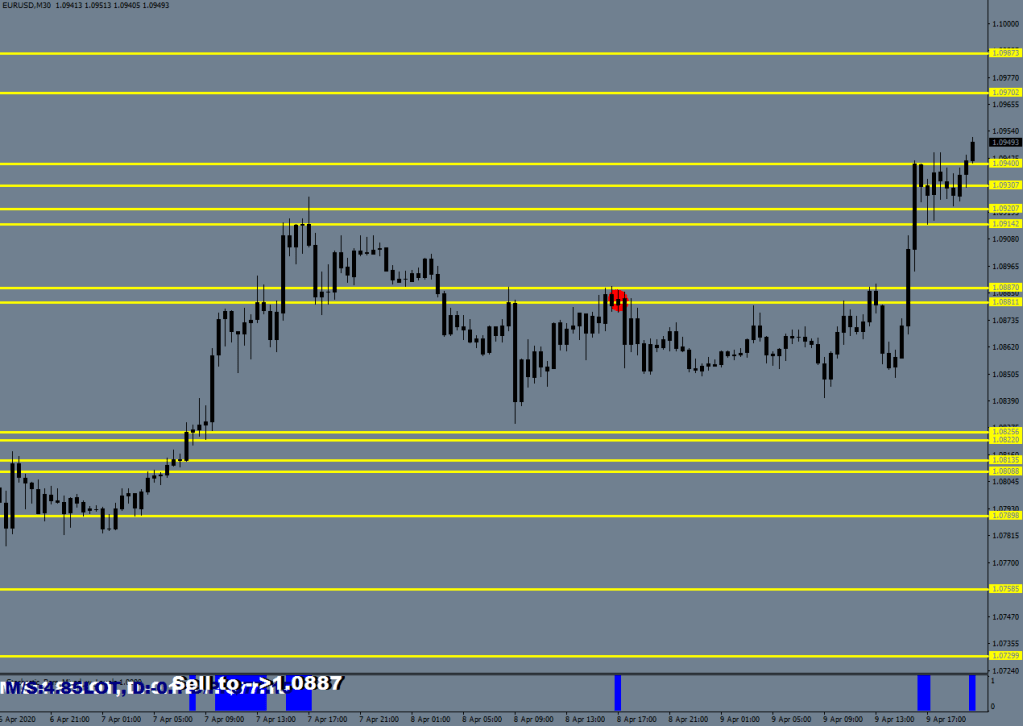
If you go back to the first screen, you can now understand that your pullback buys would have a target 1 at the nearest resistance line, which was 1.0881 and the suggested break-out trades would be good for the second resistance area out. The default look back of 500 can be changed – in fact I normally have it on 1000.
The 2nd resistance out was at 1.0940 – perfect hit. New levels were made since, but these two were in place from before.

Stochastic bars mixed also provides with some counter directional trades that I dubbed “2nd Blood”. It arranges the levels into a sorted array and gives you the value for the 1st line that is more than 25 pips away. Usually can make around 40 pips from your entry.

I can’t make trading any easier for you.
These two programs can be yours in exchange for a donation.
macdulio@yahoo.com
…
The next 2 levels:
…

…
additional signals
B/B = Buy Beat
S/B = Sell Beat
HDIR = Holding Direction
V Bottom = V Bottom


Can you see the undercut here?

Extended time remarks from here

I now have S/B1 and S/B2 listed. Not getting a fill on the one further out is relative weakness. Surpassing the further value talks of relative strength in the direction.
With the following call I gave the turn around within 12 pips of tolerance:

1.0838 was supposed to be the break-down short level. The low was made at 1.0840.
Yesterday someone approached me who was trying to make business out of selling calls for $70 a month. I saw one of those. It was suggesting to buy Cable with 160 pips of stop loss! Compare that with my calls.
Now look at the second call. The 1.0892 call for the break-out was just missed by about 3 pips. If the order displacement was less by these 3 pips, you would have had to endure a 40-pip pullback before the breakout taking place, and with large size this could had gotten particularly painful.
So, I called the turn with the break-out values within 2 and 3 pips, one after the other. The displacement was chosen carefully.
…

