We left off with this choice:

When you have a missing beat, you need to consider the possibility that it would stay without beat for a while: it may be a higher low or a lower high, thus it is a root of a new trend -> trend line. I made the plot automatic.

…
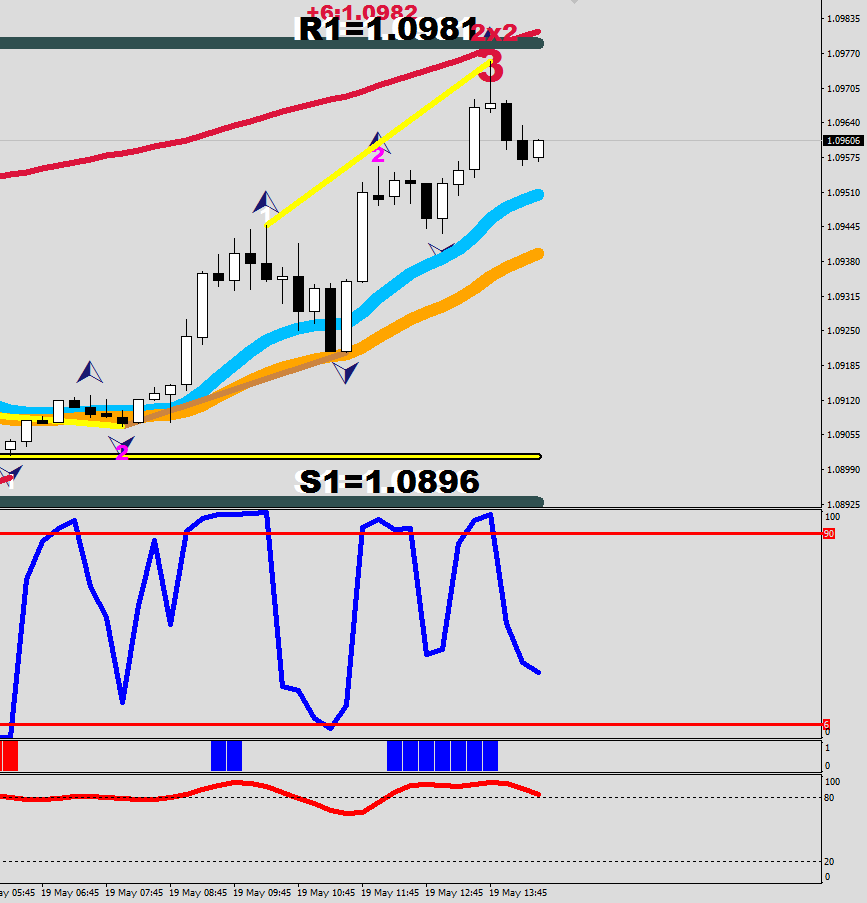
Price broke through every resistance level in one day, so now it could make a reach for the energy bands.

Daily Resistance levels:
1.0951
1.0989
1.1049

The Sell / Beat at 1.0947 in red sounds about right. The purple dash represents a liquidity break. A liquidity beak falls short of a full lambda move, for they step in and buy it up aggressively.

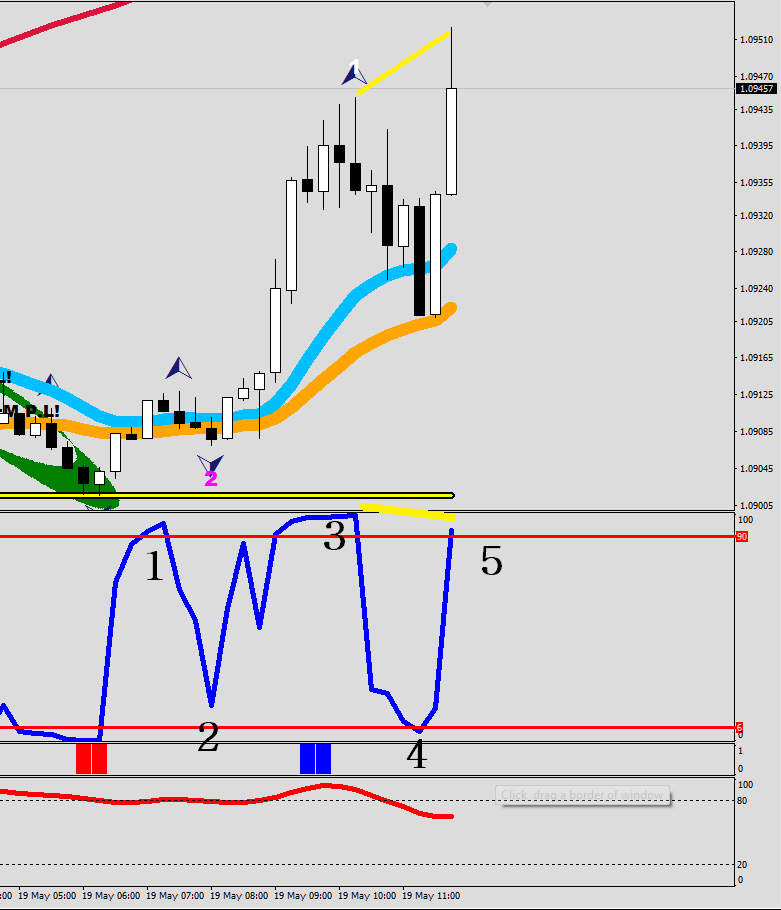
On the 15-minute you need to see a fractal without stochastic bar print (yellow example).
This was the entry.

I would consider Wave 3 finished now with this wave 5 of Wave 3 print.
Next there should be a Wave 4 down which would make the hourly 9-sample stochastic go oversold at least once (<20) and the hourly RSI2 twice (<6). Keep an eye on E32 in yellow for the start of the last Wave (5) up, which may attempt to fill the latest extension beam(s). An extremely deep Wave 4 would walk into Wave 1. I’m mentioning this because the Wave 3 up printed a “shape” which is likely going to reject price down real good due to the parabolic end. Look for a hourly ABC correction to go long again.

wave 5 of Wave 3
…
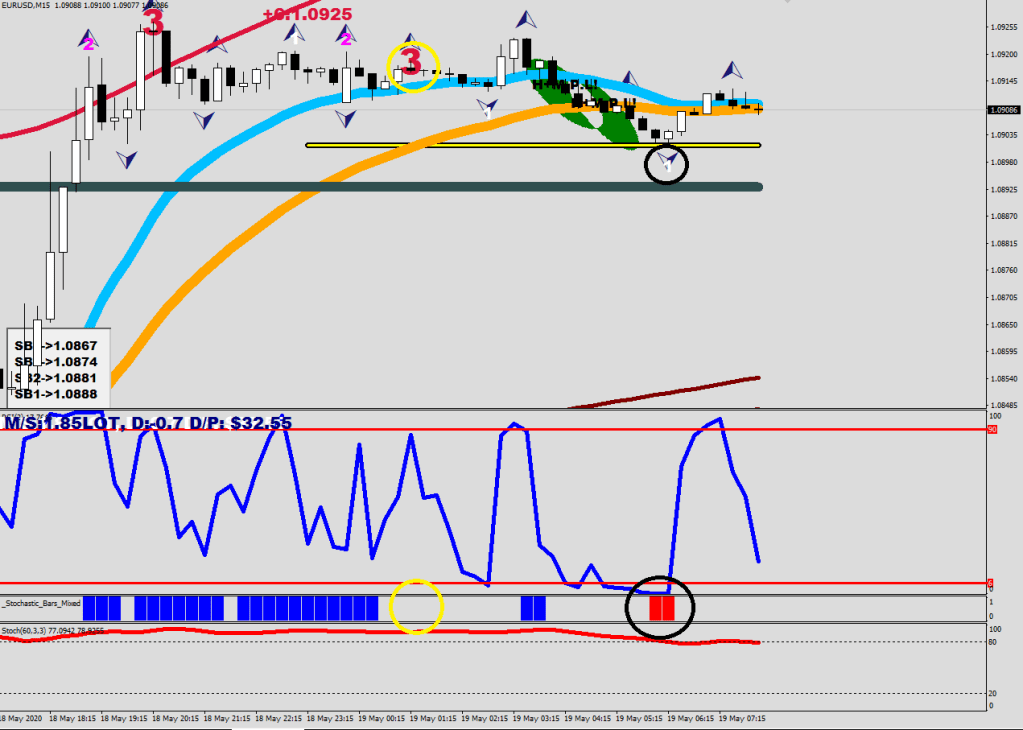
They managed to play this up to the Primary Sell Level filling an extension as well along the way. The target is Mr. Maroon.

The market is now more than 3x stretch away from the mean.
Primary Sell was hit, the extension was filled, the energy bands were hit and a prior trendline got back tested.

& the RSI2 divergence got doubled down on