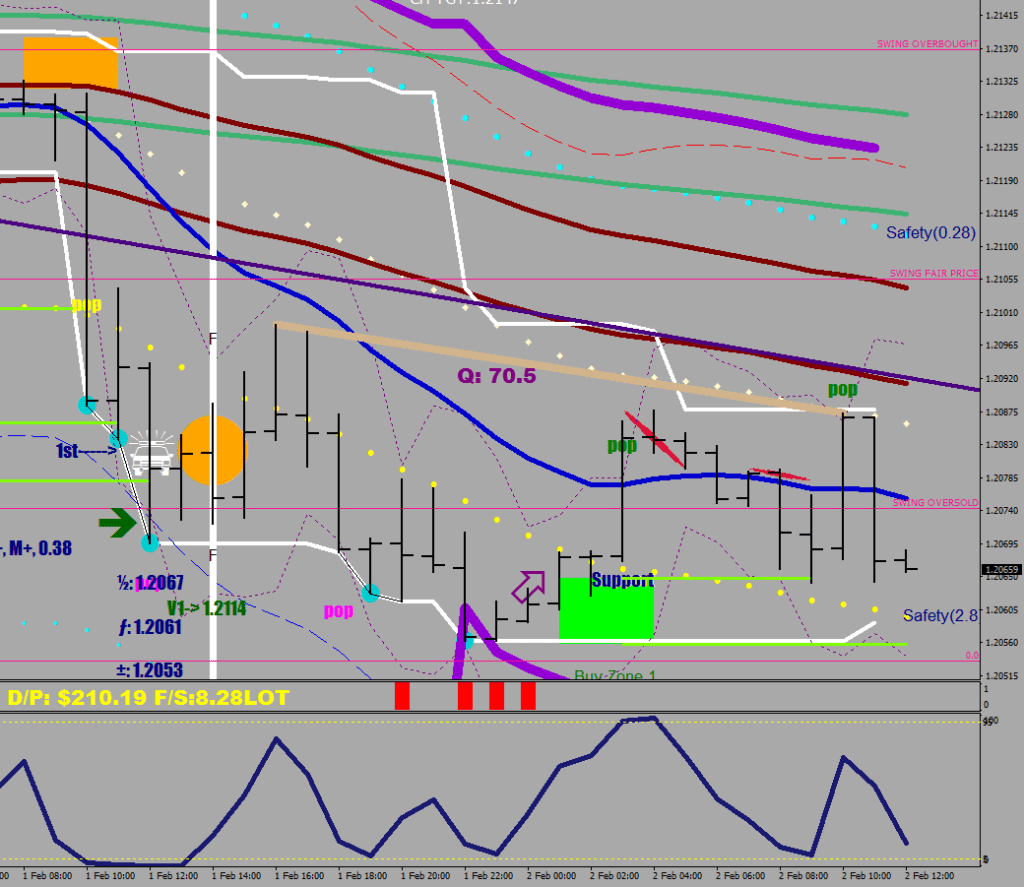
Support and Resistance can be found on the chart due to the volatility breach they caused in a direction = due to the manner price left a level (in a hurry).
On the image above to find support and resistance zones automatically, my software utilizes the breach of the dotted brackets, which are 10-pip displacements. I also invented a logical switch for “fresh green pop / fresh red pop” to find the most relevant ones.
hdn[i]=Low[i+1]-100*Point; hup[i]=High[i+1]+100*Point;The width I use is
1. from the open of the break away candle to
2. to 4.4 pips beyond the outer point of the candle
I add some displacement is the recent history was nosebleed selling / buying (RSI just hit the floor / ceiling)
The width I use is
1. from 3 pips beyond the open of the break away candle to
2. to 11.4 pips beyond the outer point of the candle
ObjectCreate(0,"SING3_1"+i,OBJ_TREND,0,Time[i],Low[i]-114*Point,Time[0],Low[i]-114*Point);
                          ObjectSetInteger(0,"SING3_1"+i,OBJPROP_RAY_RIGHT,false);
                          ObjectSet("SING3_1"+i,OBJPROP_COLOR,Lime);
                          ObjectSet("SING3_1"+i,OBJPROP_WIDTH, 3);
ObjectCreate(0,"SING3_2"+i,OBJ_TREND,0,Time[i],Open[i]-30*Point,Time[0],Open[i]-30*Point);
                          ObjectSetInteger(0,"SING3_2"+i,OBJPROP_RAY_RIGHT,false);
                          ObjectSet("SING3_2"+i,OBJPROP_COLOR,Lime);
                          ObjectSet("SING3_2"+i,OBJPROP_WIDTH, 3);
The label plays a windmill around the end of the trigger candle
ObjectCreate("SINGRock"+DoubleToStr(i), OBJ_TEXT, 0, Time[i], Low[i]-10*Point); ObjectCreate("SINGRocky"+DoubleToStr(i), OBJ_TEXT, 0, Time[i], Low[i]-10*Point);
                                if (Close[0]>Open[i]-30*Point) {ObjectSetText("SINGRock"+DoubleToStr(i), " Support", 14, "Impact", clrWhite); ObjectSetText("SINGRocky"+DoubleToStr(i), "Support", 14, "Impact", clrNavy);}
                                else {ObjectSetText("SINGRock"+DoubleToStr(i), " Resistance", 14, "Impact", clrWhite); ObjectSetText("SINGRocky"+DoubleToStr(i), "Resistance", 14, "Impact", clrNavy);
So let’s carry over these two ideas for drawing support and resistance:
- the line is merely a starting point of a moratorium zone, and would be placed on the candle’s open, not its wick
- you need volatility expansion to highlight an area, a simple trickle away does not result in a support/resistance level no matter how long the price spent there
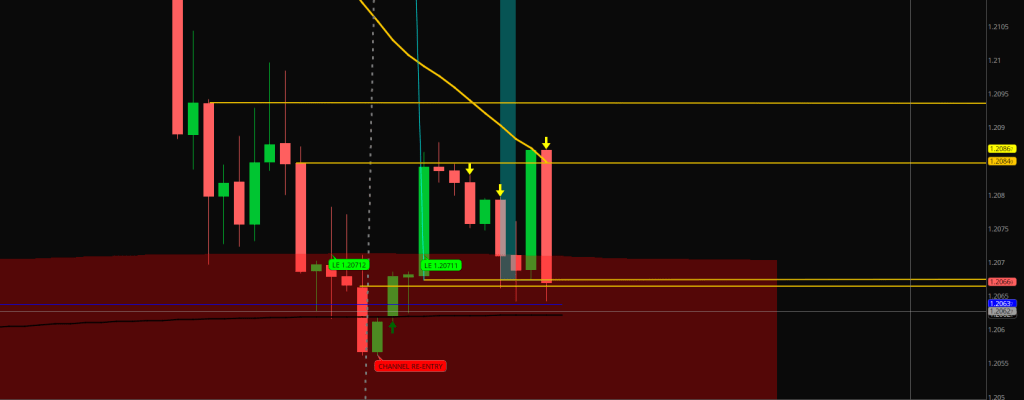
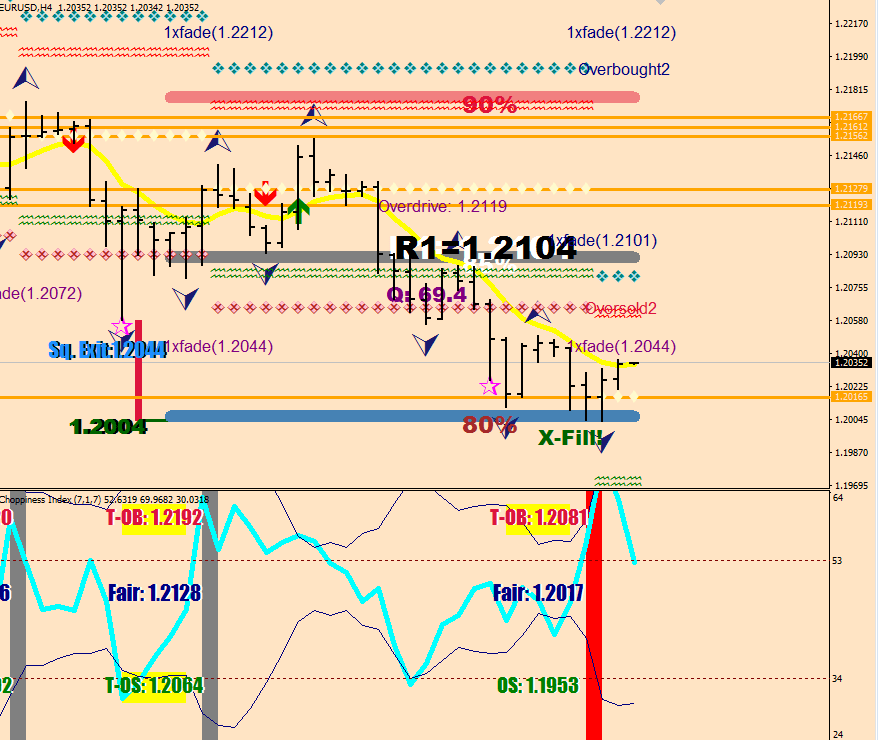
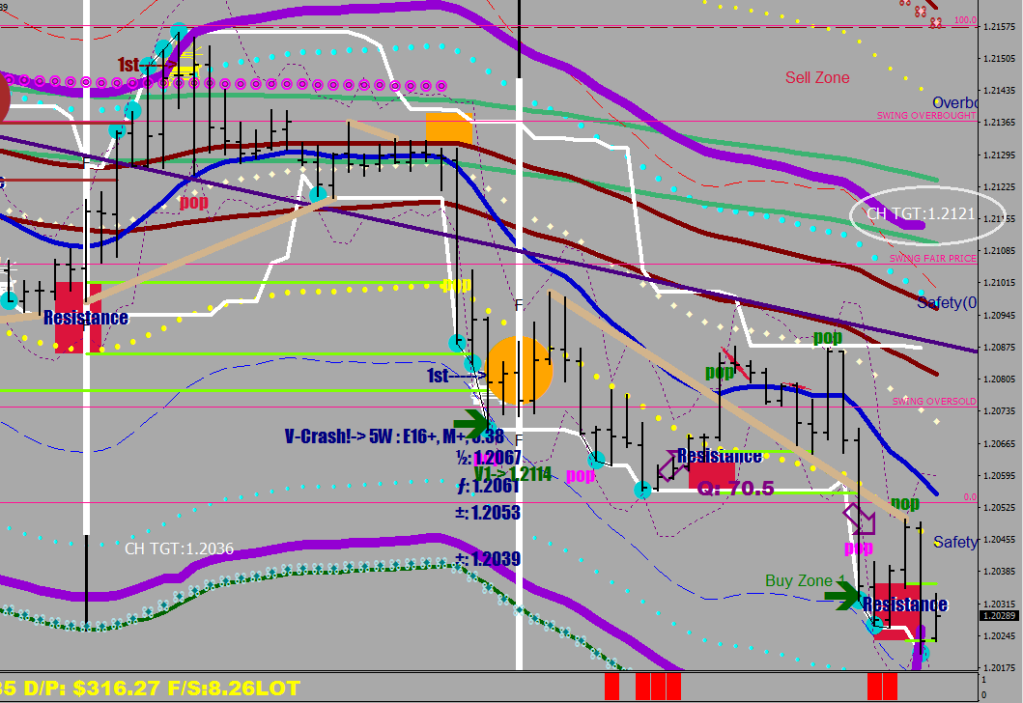
…so your lines are drawn in accurately on your hourly chart, you are eyeing the next level up
…and this is what happens…
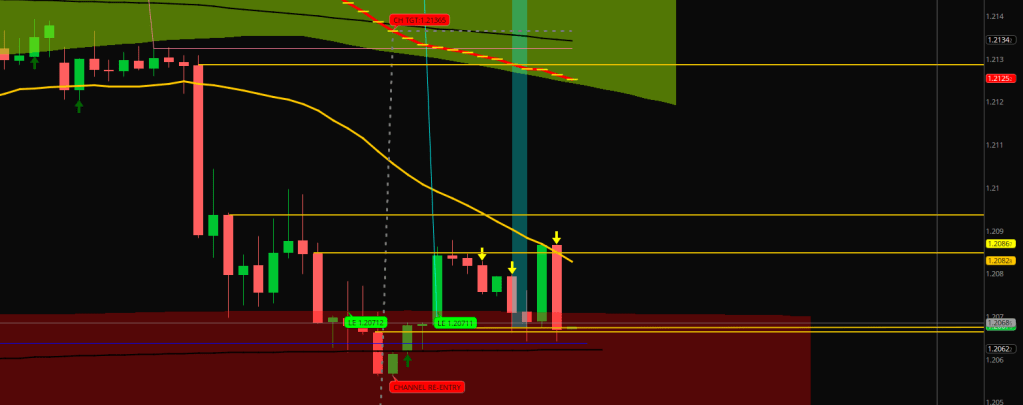
…baby bummer, for you knew all along about the channel target on the left (thanks to my free TOS present earlier), you are conscious of the wave structure and have not used outrageous size… you are in good shape… time to average down that bet!
Price is almost there & life is almost fair>
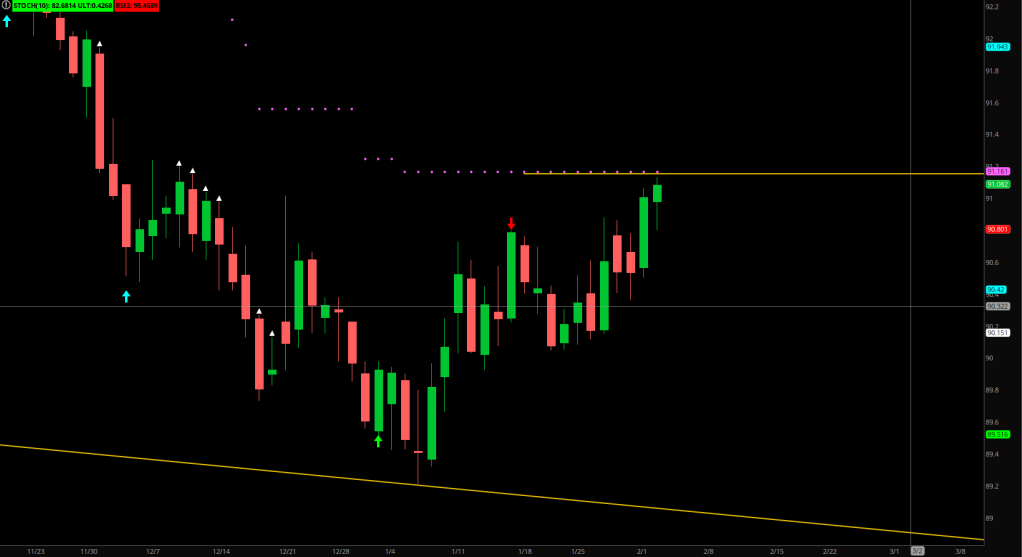
…the necessary correction to the RSI2 30M was made.
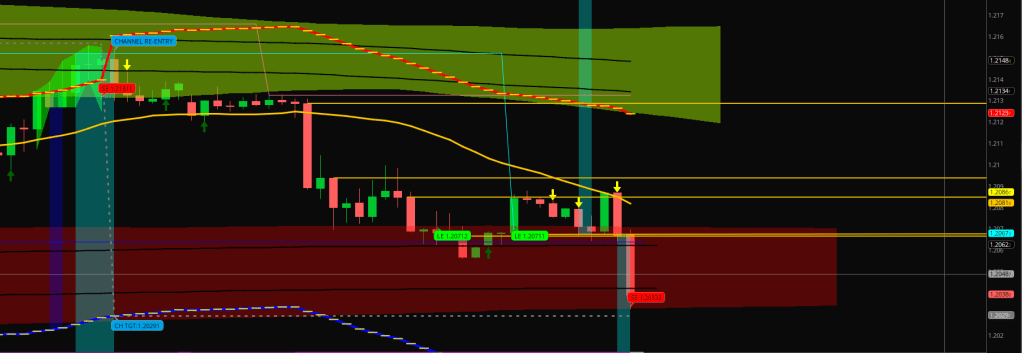
…
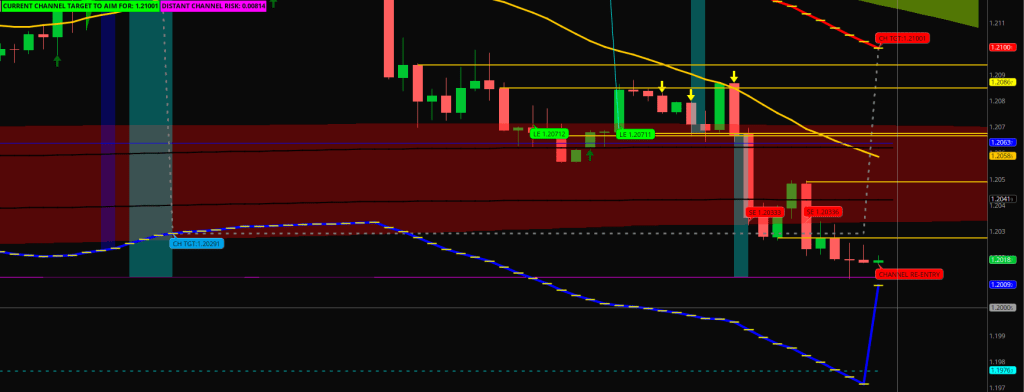
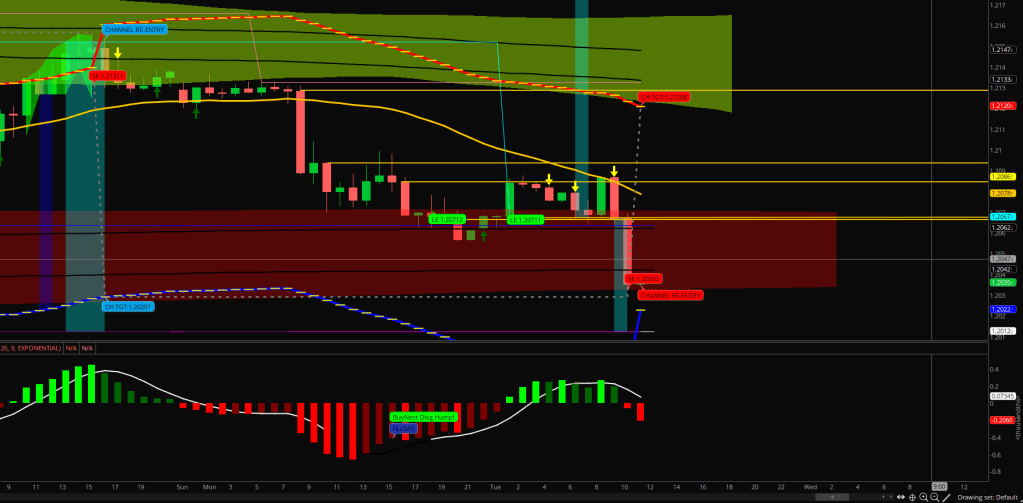
Channel Target on CloseLines 60-60
the difference comes from using an E-32 channel VS E-36 on TOS in part
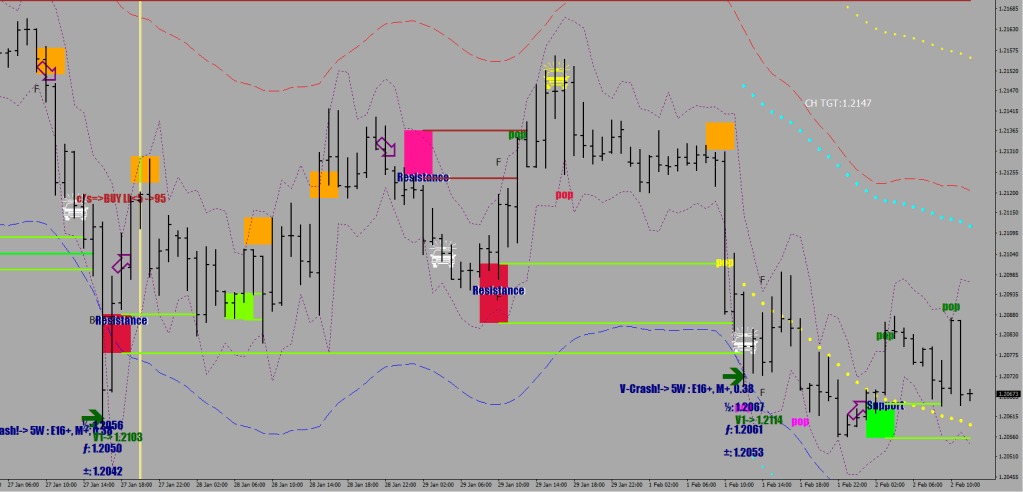
…potential mean reversion from here…