
I studied all of history. I liked none of it.
Channeling is what makes a sustained move possible for the market.
The market is in general is unable to sustain moves (from a consolidation mean) back to back that would exceed the previous 3 days average by more than 30 percent.
Channeling is a condition where different rules apply.
A start of a channeling move on a chart shows up as price separates from the E-16 HL2 hourly EMA and gets stopped and reversed on the next 2 attempts when it tries to return to it.
As for a screen plot / hedging level search I am looking for a 20-bar sequence where price is unable to randezvous with its suppressor other half. However, this does not immediately confirm the direction.
The first image below shows a separation that is 20 bars long.
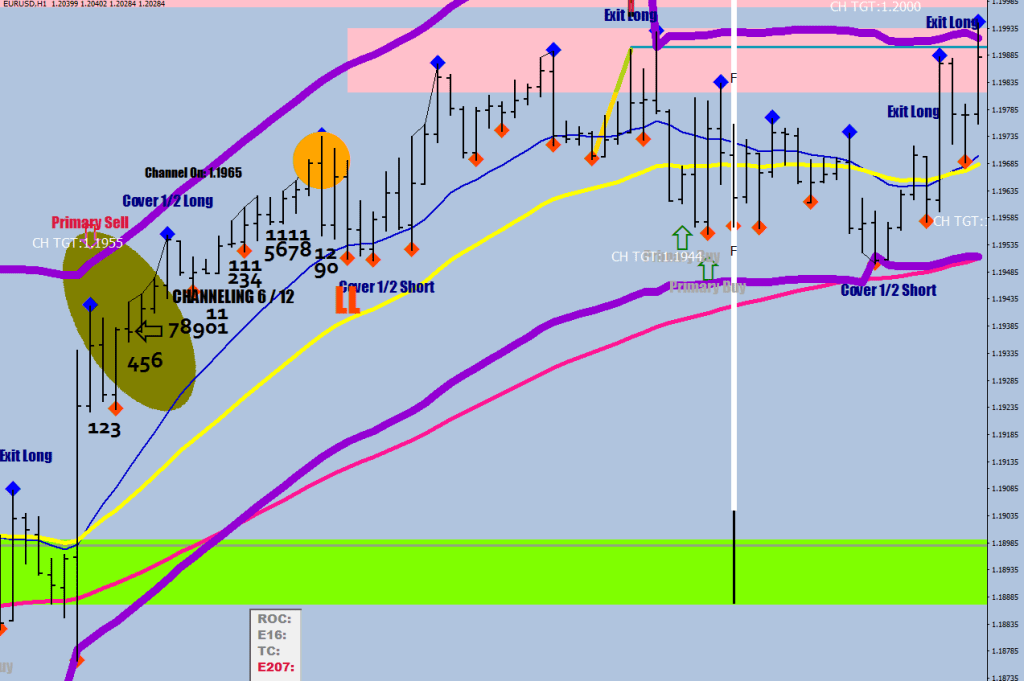
The other way to confirm the channeling move in the prompting direction is when after the 3rd dip price crosses back above E-89.

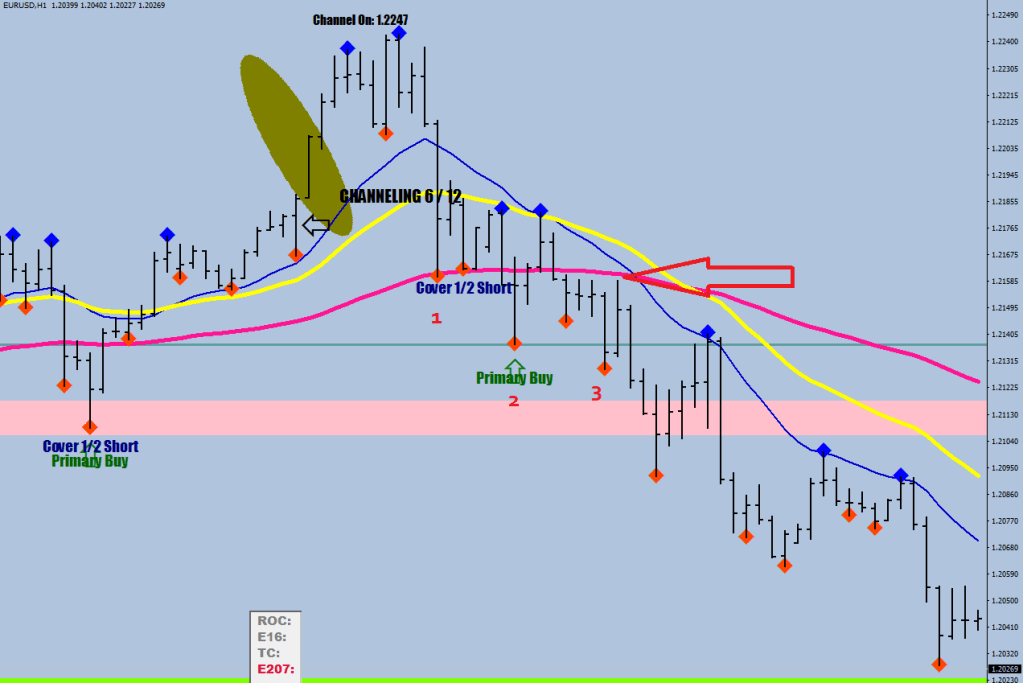
It is also possible that the channeling move gets confirmed in the opposite direction.
After the channeling is on, you need to start counting.
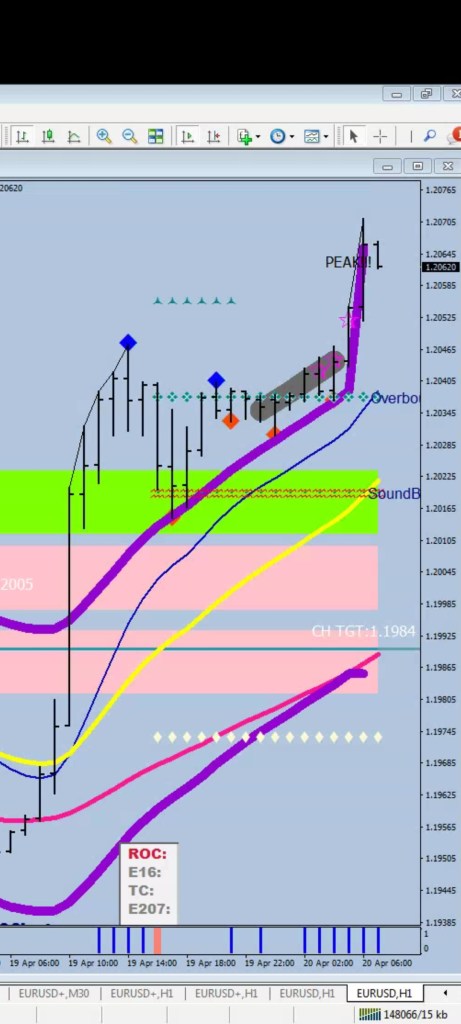
It is a good idea to plot E32 (yellow), E89 (deep pink), and perhaps E67 (maroon – I usually plot both the highs and the lows on this last one).
Notice on the image below that the first 3 entries were pushes above the E-16, the next 3 were pushes above the E-32.

The first 6 pushes are happening with counter volatility being on the mute. These legs if not always individually, but as a block for sure make the trend continuation possible (New Lower Lows).
Pushes from 8 to 9 are the tricky part, for they come with higher volatility.
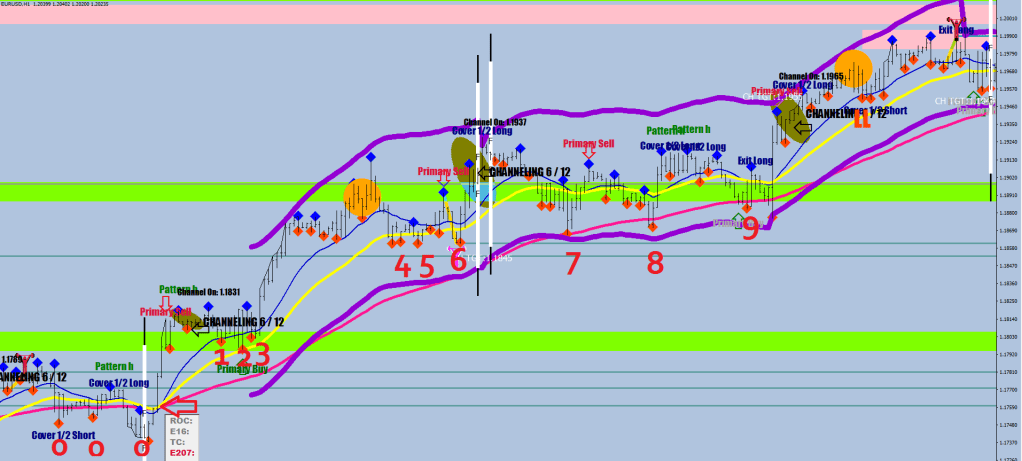
What comes after a 9 count? Decision time: can another channeling sequence be triggered? At times>

7 made a marginal higher high, and actually came from the E-67, it did not make it to the E-89. Number 8 put up some serious effort to halt and reverse a freight train coming with speed. Will this separation make it to 20 hours without touching the E-16 to trigger yet another sequence? I doubt it. This is why I said:

Take note of the beat made over the terminal end of the #7 leg: 1.1995. #8 made it to 1.2048. What does 53 pips remind you of? How about 45 pips fluctuation maximum plus 8 pips failed break out?
Hmm… A managed to make a whole article about channeling without mentioning anything about golden tails (tough cookie level high lights) and the shaded projection zones triggered by out of sequence LL / HH fractals. Ain’t I am good?
…
Wherever I lay my principles…
…
Falling knife moment on the upside
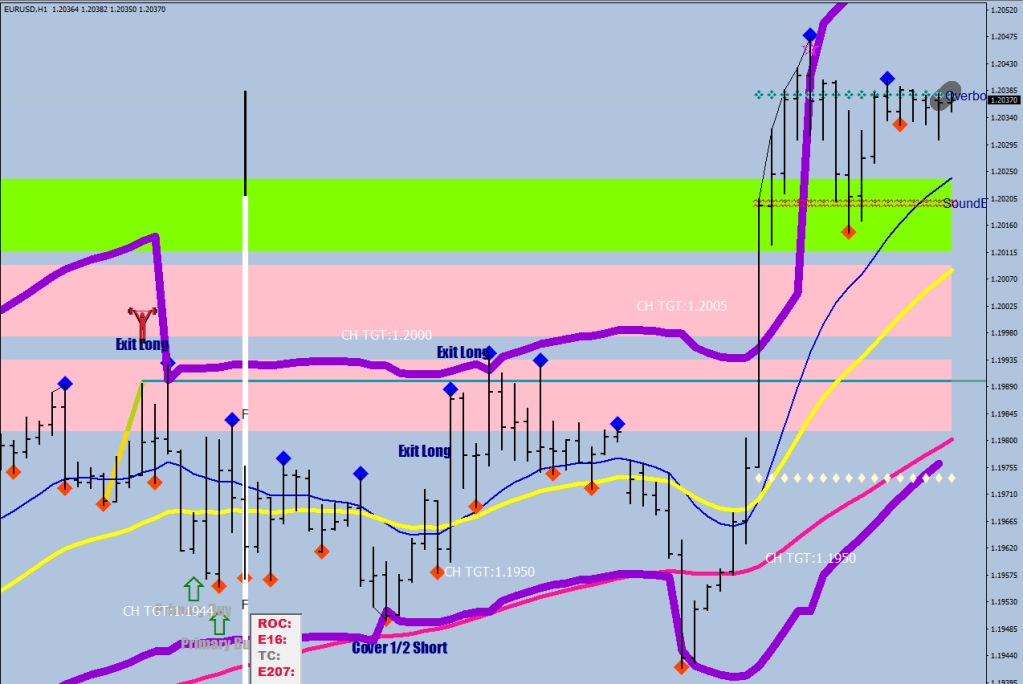
Alas the market managed to stay off the E-16 & printed the shape (terminal move.)

…more Sting, cheers!
