
Capitulation VS break-out
First thing to say is that capitulations don’t just come out of the blue. Your warning(s) are the previous days. Like we have already discussed here, the Cover lows/ highs are 4-sample daily highs / lows with 27+ retracement on the last candle. The Cover days come with a moratorium zone (white numbers) and moves up to these numbers are no break extensions. These displacements are also based on the fore-mentioned 27 pips. Give it another 6 pips tolerance to avoid some fake outs.
Based on this, the capitulation was narrowly avoided (prepped) by the previous day when the low that was set was at 1.12345, but when today the 1.1230 level was hit, the capitulation was on.

To compare this with the previous capitulation, you will find that that too had Cover lows setting up the stage & at 1.1216 (with the 6-pip add on) there was no question about what was happening. The cover low was first followed by a low, that did not retrace 27-pips on the daily candle. Dead giveaway.
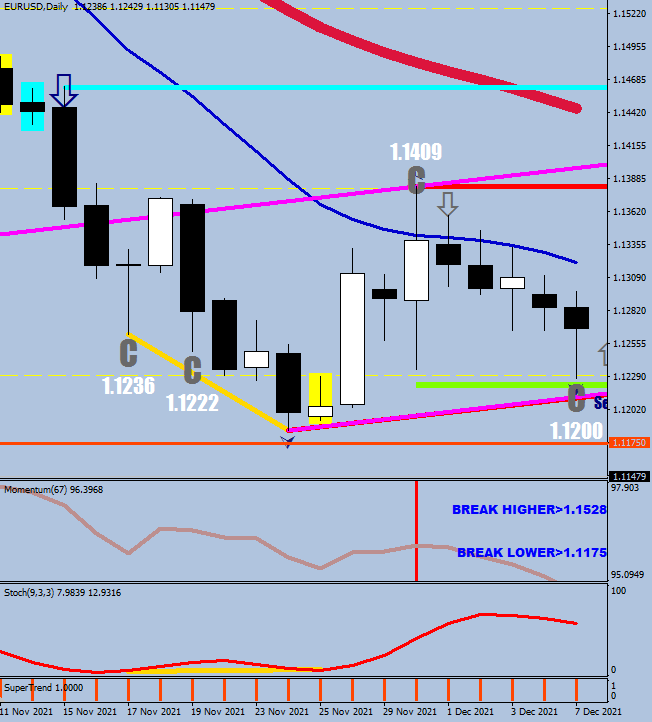
One interesting nuance is that if you measure the distance from the capitulation low to the previous large black candle’s closing level, on the second image you get 96 pips, whilst on the current example this is 111.
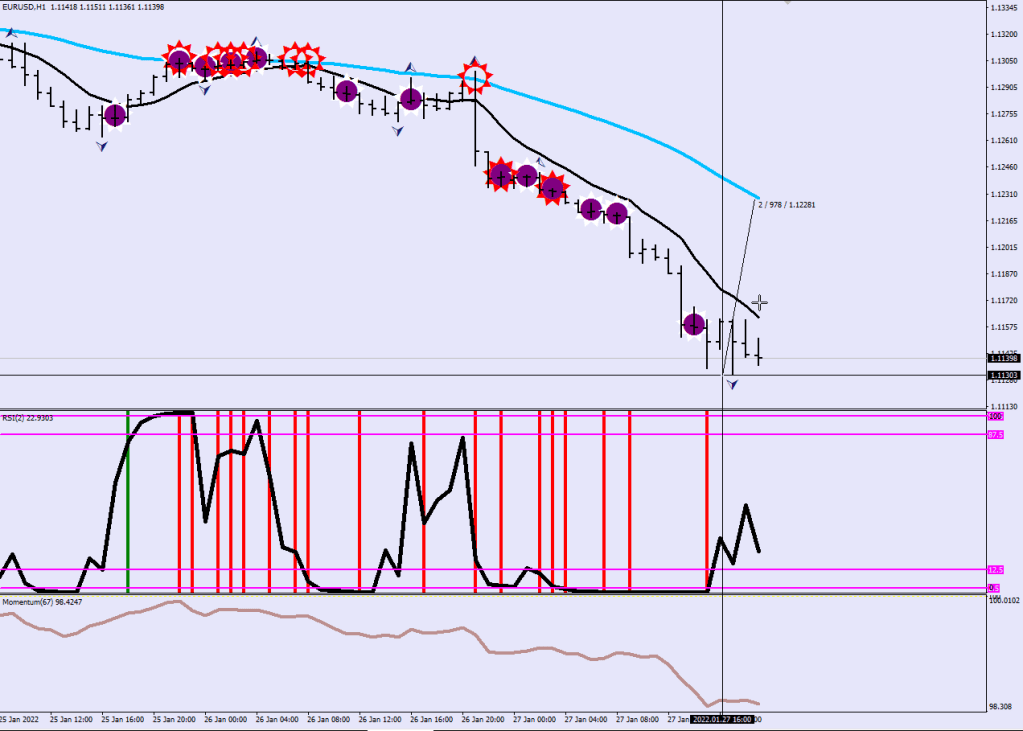
Another nuance to insert here is that I set up my 0-M hourly chart in a way that the first indicator row displays primary signals (vertical lines) and the second row has secondary signals. Obviously, secondary signals do not matter during a capitulation.

Now let’s talk about how important it is that the ink dries on the hourly fractal when looking for the low.

Now, let’s look at what happened with the previous capitulation. After the 67-sample momentum made a reversal divergence along with the RSI2, price went back to the E-44 within 24 hours.

Here is the latest example where the market made a major move that ended up being a sustained break-out for comparison.

So, I presented you all the evidence; from the current swing low, the E-44 is almost a 100 pips away, and they are certain to meet again, the question is: which route shall the price take from here?
…


The deep M at the end of the rising wedge was of course still a sell for a lower low.
