
The SuperTrend indicator is available as source / compiled thanks to the works of Osama Mladen.
Settings for the hourly – as proposed
extern int                period       = 10;
extern ENUM_APPLIED_PRICE appliedPrice = PRICE_MEDIAN;
extern double             multiplier   = 3.0;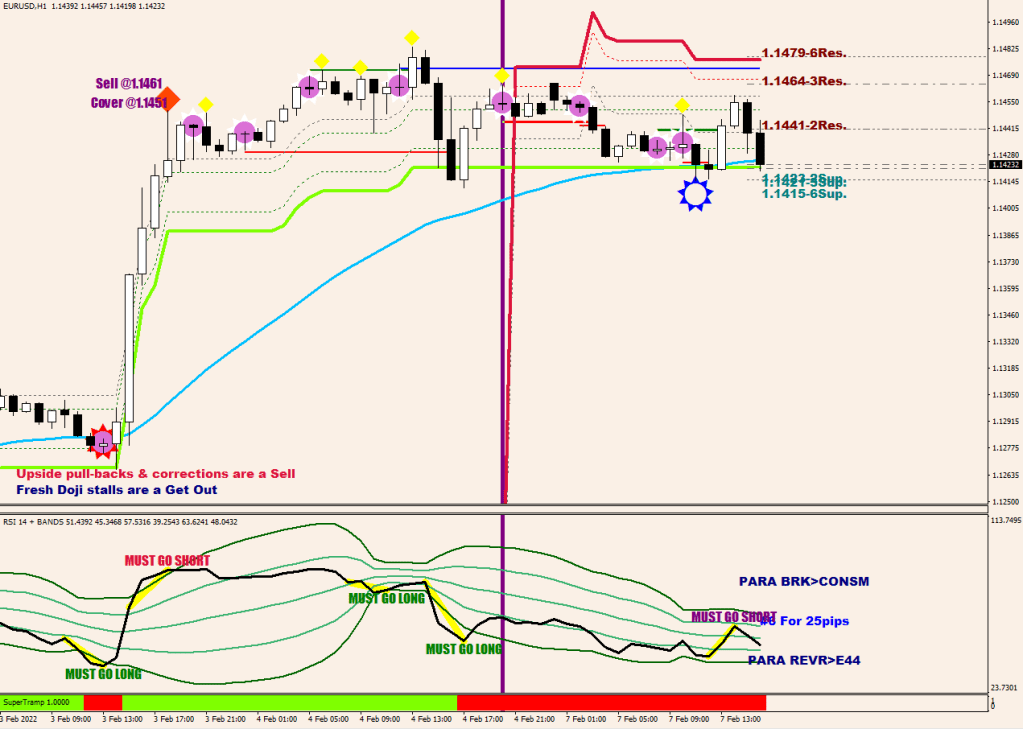
Now. Rules.
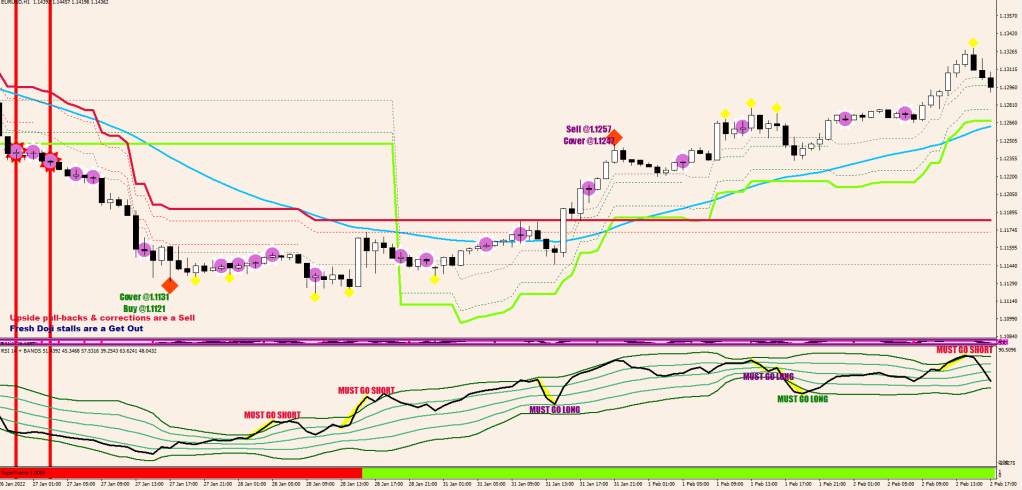
5 ticks is one color = flipping direction. From then on the direction of the trend was picked.
Less than 5 of the color: an episode called correction.
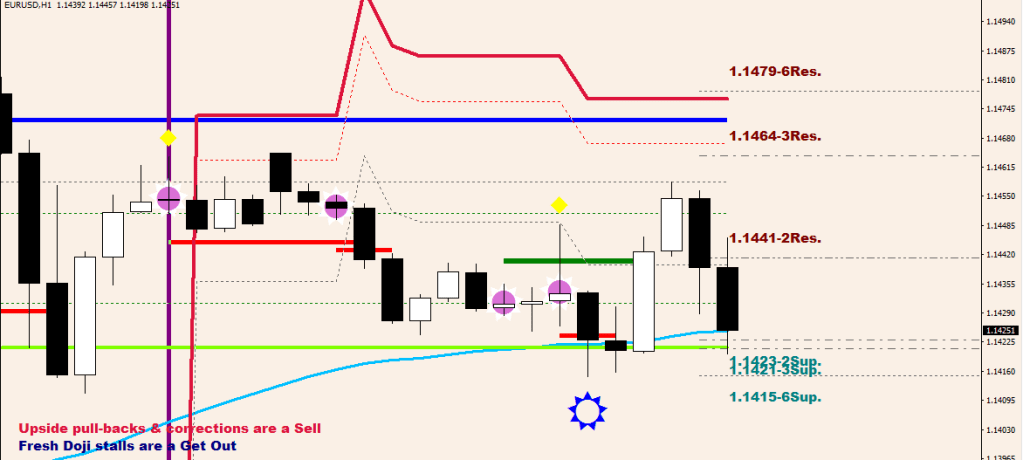
The 4+4 lines are displaced highs and lows by 25, 32, 55 and 62 pips.
Hitting the closer two lines are a pullback whilst the second two count as a correction.
Dojis. Shared the basic version on ForexFactory. The routine now plots the last 2, 3 and 6-doji ranges with increasing displacement as supports and resistances on the right margin with the numbers plotted. It also makes the thick blue, red and green lines depending on if the market has managed to close beyond that particular line for an idea of fake outs / current progression.
Plot E44 HL2 in Light Blue, because that’s always fun.
If price hits the middle of that blue halo, that’s an immediate short.
I was just curious about how far I could possibly push a SuperTramp indicator. Quite far. You cannot change the trending direction in less than 5 hours.


& I didn’t say Donald anywhere. It was quite classy of me.

