A lot of people declare themselves as momentum traders.
Since I am not everyone else, I can only give you my ideas on what Momentum Trading should mean.
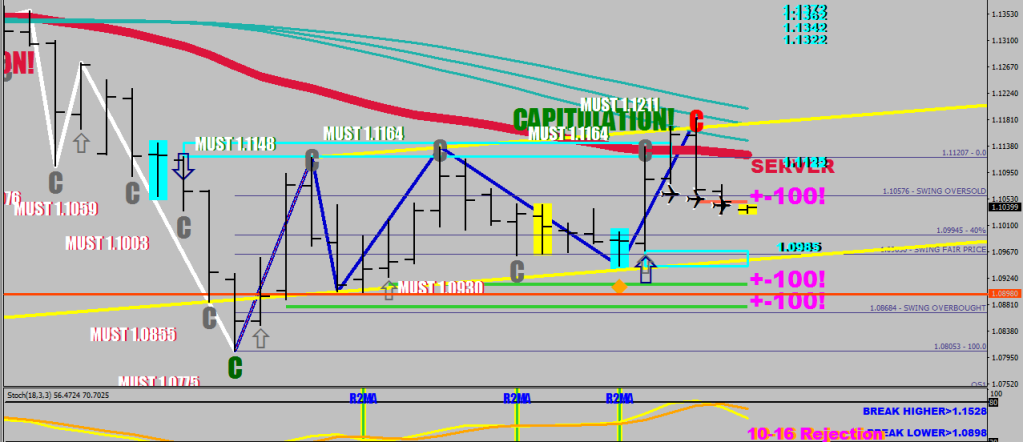
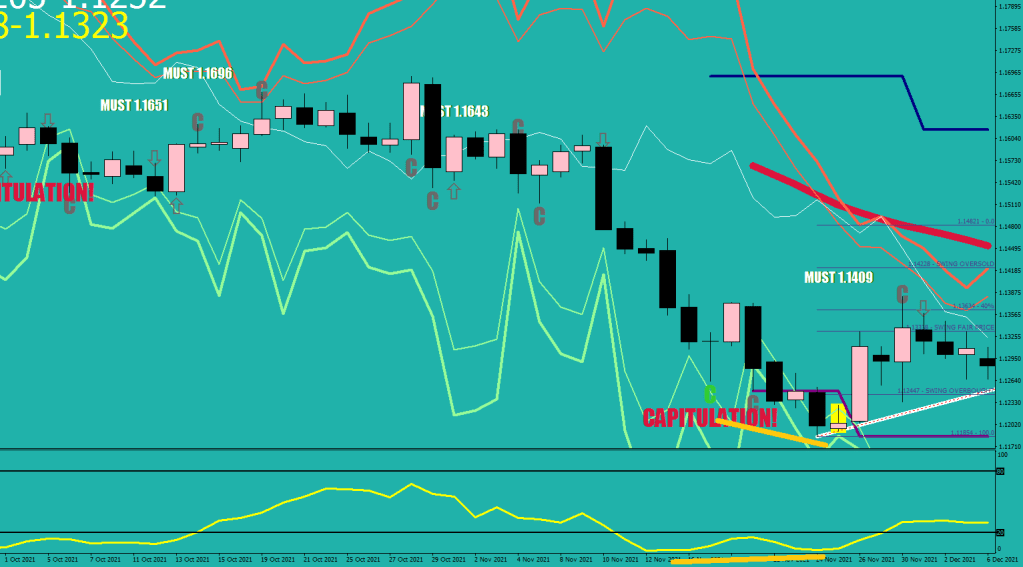
Yes, when the rate of price change (trajectory) of price changes declines, that shows tiredness and your odds improve for a mean reversion.
I want to go into the nitty gritty however.
How does price turn around at all?
Strength has to transpire. This is one of the 3 corner stones.
As a momentum trader your friends should be oscillators and moving averages. Divergences too with the caveat that they area a pressure relief called upon by excessive strength.
This is the first lesson here. You should not be looking at divergences as a reversal indicator. The most common waves are corrective and they end in optimal strength prompting no reversal divergences.


See, the reversal off a reversal divergence is a weak one. An encounter with the 1-standard deviation of the 20 SMA of the 44 daily EMA may re-instate the trend in a jiffy. Lesson number 2.


Your first piece of information derived from the daily chart therefore is that there was a red Cover high most recently meaning that the daily momentum is down.