
In the world of convenience, 11 comes after 7.
Over the rainbow, over the bought.
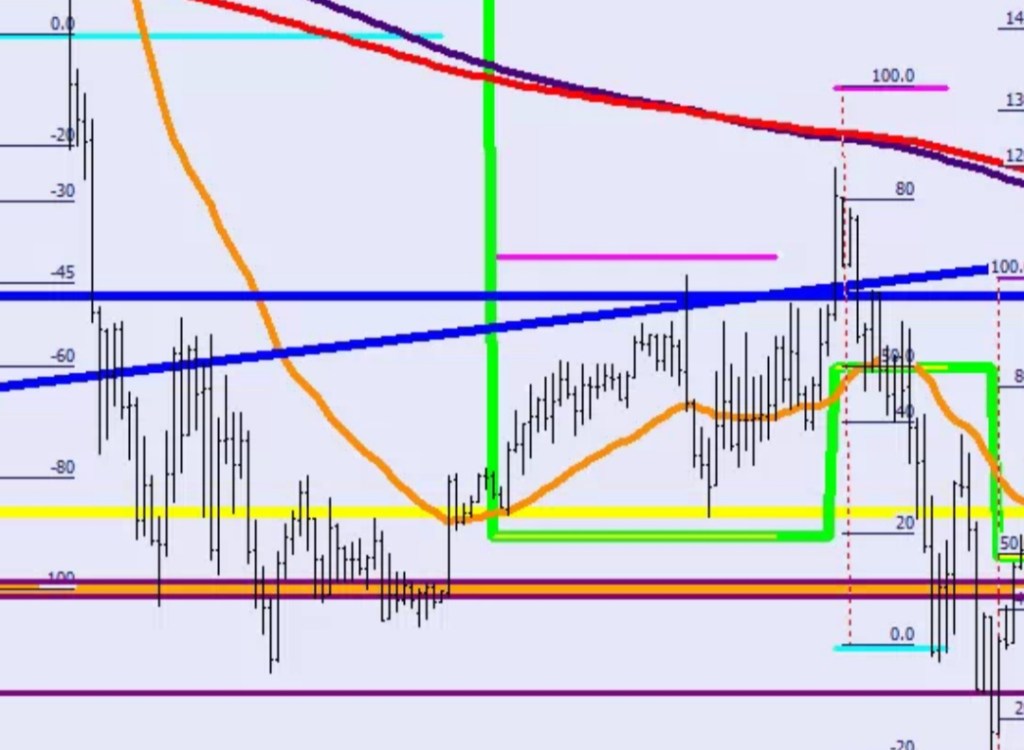
An example of a 100/200 failure above. 100 meaning an extra Range distance down, the 200s are automatically plotted 2x Range distances made by previous ranges (within the sample).
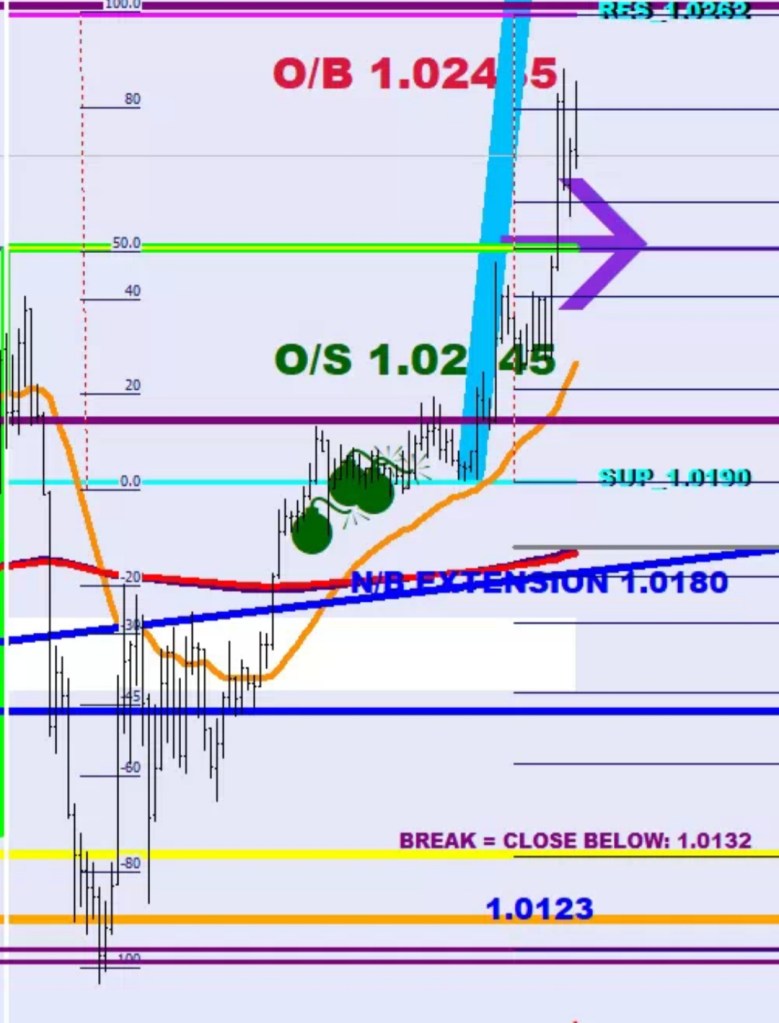
Price comes back to the Overbought level of the range that gets drawn in the future.
The fun part is that a failure does not change the market ditection, but bucks the trend as long as the lasso can reach.
Now, what about this Malcolm in the Middle?

On the chart you see a lower low being made, but relative to the Range, this second leg fell shy by 20%. An impulse bottom.
Where was a Left Shoulder/Butt Cheek at all? I could not see one.
If you want this to be a bottom and an IHS, that would come handy. You want bottoms to be spankable. You want the power of love to be overwhelming.
