
This one was full of riddles.
No volume, BB squeeze and new habits made it even more difficult to figure.
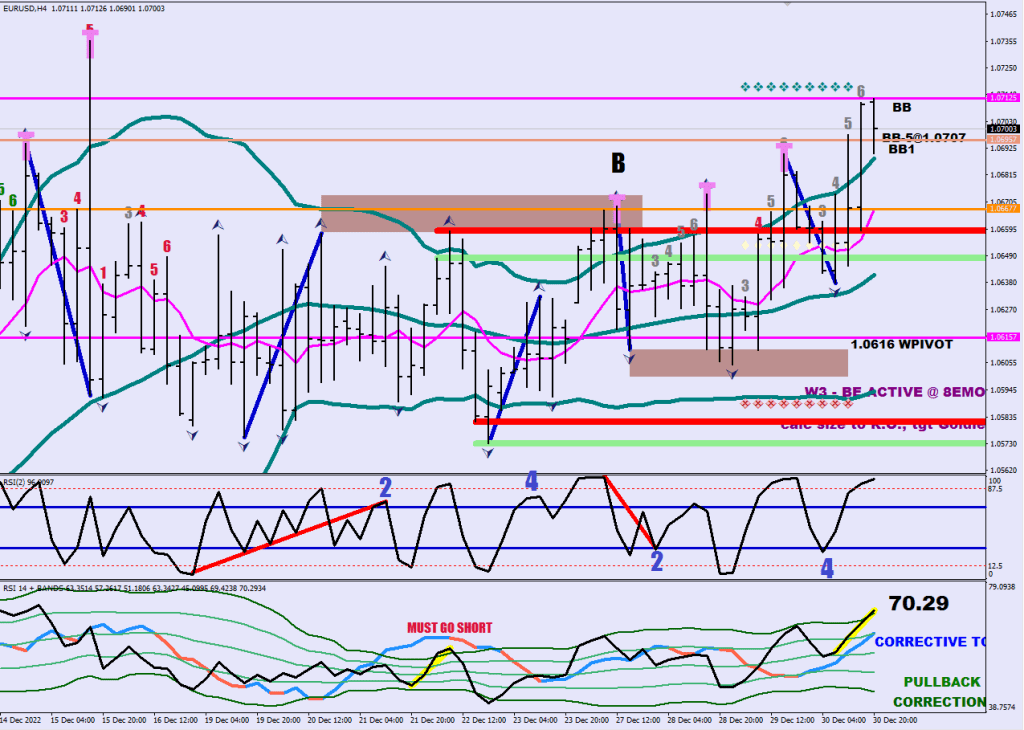
First, the BB was too wide, so the Wave 1’s ending point became debatable.
One guiding principle for the Wave 2 is that the RSI2 would connect the red with the blue.
Then the Wave 2’s ending had to be adjusted a number of times.The first red line represents an RSI2 peak that was exceeded by the end of Wave 4. That full lambda move in between was an anomaly. It went into the dirt box of the Wave 2 by 0.8 pips.
This has not been the market’s habit while there was volume. Only after a Wave 4 printed would it go back for this liquidity box for a run that would take price to an Utmost condition (i.e. RSI14>72, RSI14>2 std div).
This Wave 2 dirt box got raided early with the 5-wave structure to the upside as well.
Since Wave 4 has to make a higher high and a higher low or a lower high and a lower low and the RSI2 readings would have to come with a beat, the conclusion here is that both of these Wave 2s ended way off their high / low.
That liquidity-anomaly after the Wave 2 is a new feature.
The last Wave 5 down did not even reach the band, and then there was the innocent looking gap up that kicked off a new 5-wave count to the upside.
A small handicap that my Auto Thrust finder picks up that Anomaly peak as a B since it is outside the BB and and is within the sample size, but this is wrong, it was made by the down structure, so that first T was in fact a B, and now you have 3 Ts. The RSI would coast higher on the open too, 71.x is close enough to 72. I would not be looking for any upside here.

