First, how is the swing high doing?
If the market were to finish where it is now, you would have a swing high in place.
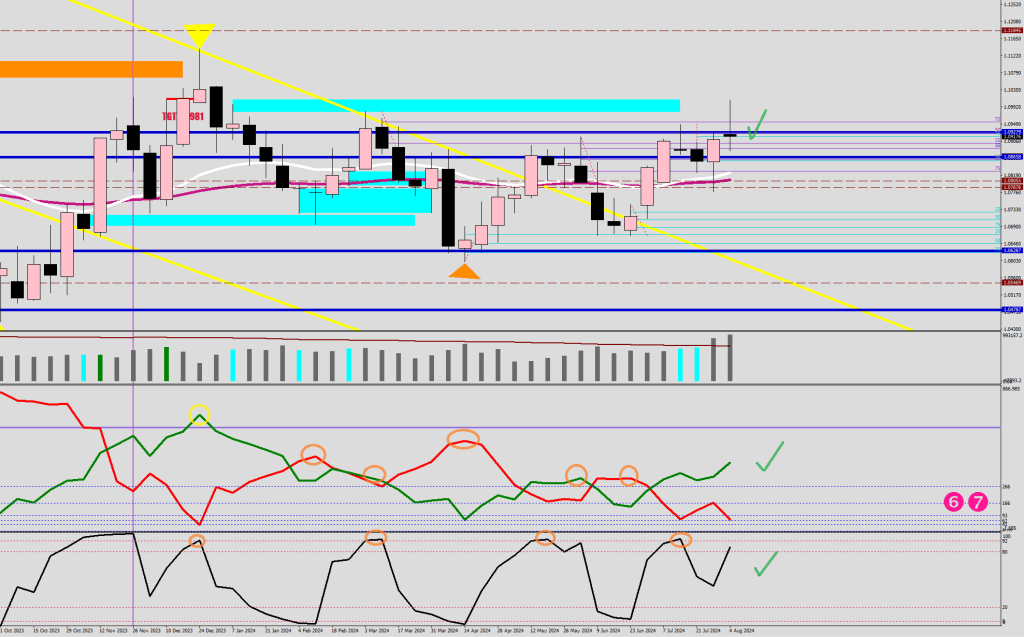
The checklist: pink and black sequence, RSI2 having reached 92+, 266 pips from the 18-sample low, 91+ pips close down from the high on the first black weekly candle.
However, I can’t shake the feeling that it is not going to play out like this.
Onto the daily.
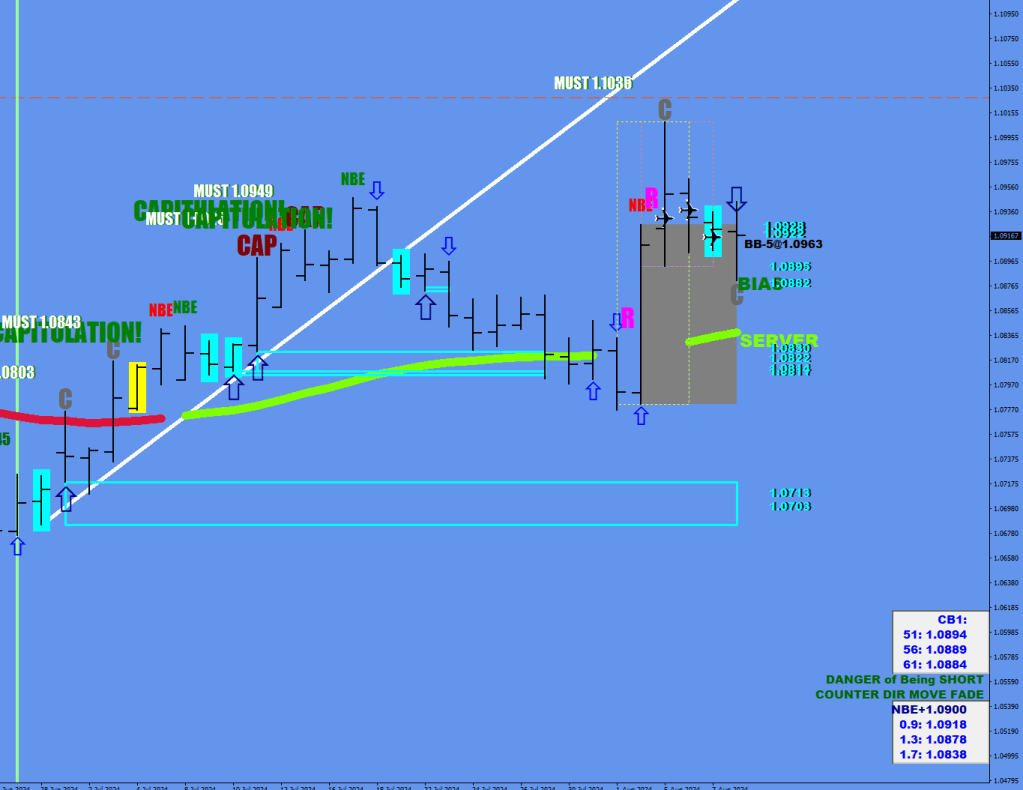
A bow back occurs when after a counter-directional move, the holdings start to re-establish their dominance.
The reason to pay attention to the most progression achieved by the bow’s 3rd day (and also the 6th) is that you would have a statistical edge by being able to plot a zone for an optimal exit.
These displacements come into play when the progression high gets tripped by say 5 pips to avoid a fake out, and this can happen on day 4 or 40 days down the road, the table/trap will remain set – come alone or come many.
In this image, you can see how methodically the previous high (1.1008) begets targeted intraday.
With the 5-pip tolerance deducted, you would arrive at a minimum 60-pip run to the closer end of the box, where you should be dumping all longs. If the move coasts on, scale into a short. Make the most of it.
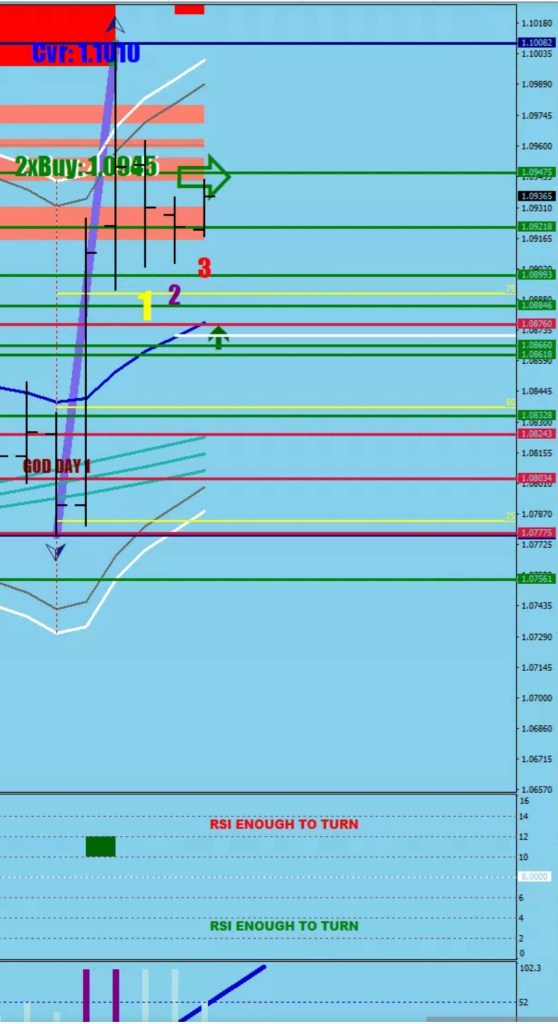
By the way, there was a 4-H money flow flip showing the 1.088x area with the inverted money flow print on the 4-H lower fractal real-time.
Also, it was like a ballet dance between the two volatility lines came together for a kiss.
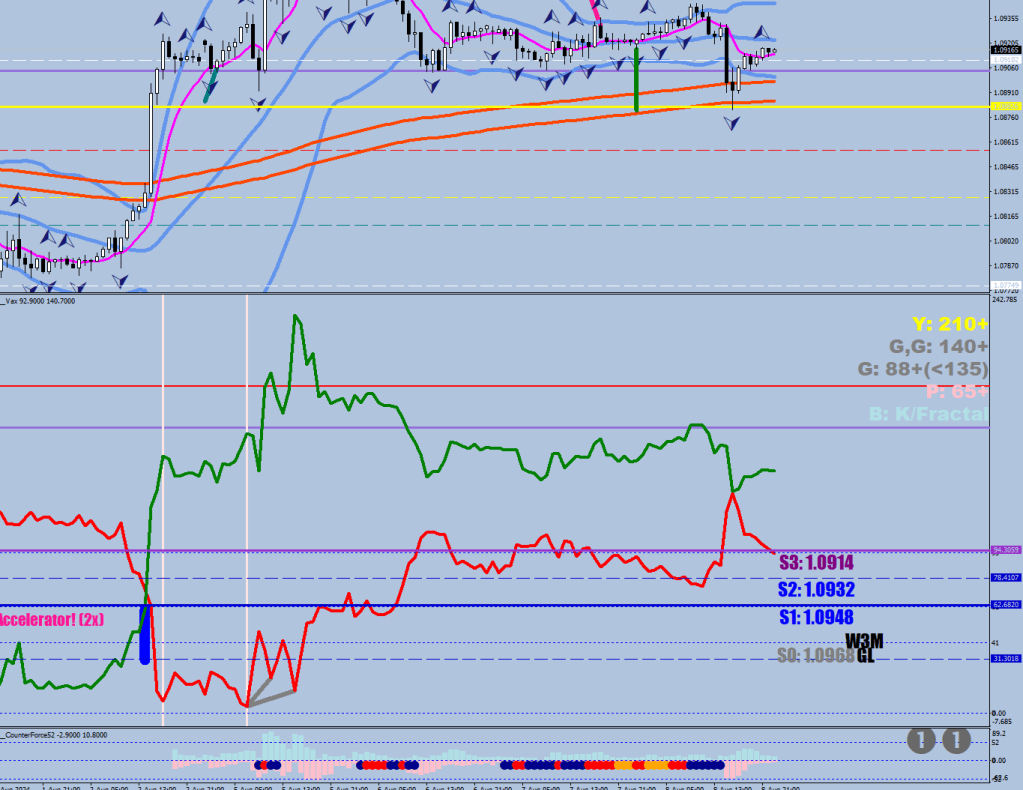
I’d say someone is still long here.