
The case for an intermediate swing high printing next.

The volume had increased beyond the 100-week average for the last 2 weeks, the volatility compression lows are into the thick, sub-93 zone (orange ovals).
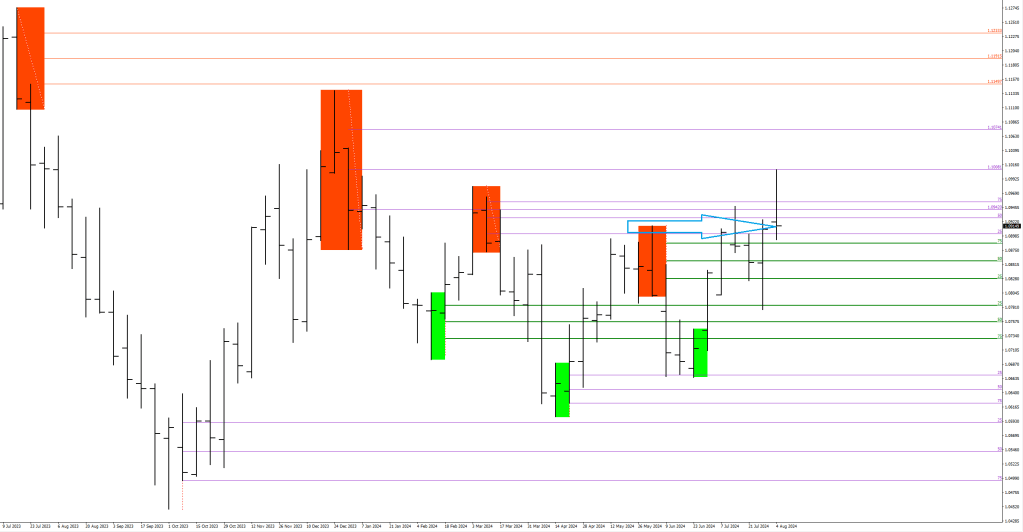
This would be associated with major swing under development, but I have a recent example of an intermediate swing (orange triangle). If I put another qualifying line at 457 pips (blue) the shortfall is only an extra 50+ pips, so an 1.1060-1.1090 high would be entirely in line. The last intermediate swing print came in at 516 (which would mean 110 pips beyond 1.1010 or 1.1120).
See there’s a problem with calling the current close down a finished swing high.
The close, albeit more than 91 pips, is sitting at the top of the prior swing high (at support) and there is no history of a weekly close down at a reversal closing up higher than the prior candle’s close.
You do not have a swing high.

…has not been closed below.
The gray, 3.8x fluctuation maximum line is currently around 1.1040. If the market was to gap up, or make a run for it, this could be the approximate location of the swing high.

Now, remember that the denominator is 9 days. 4 more days from now the sample’s lowest data point (daily median) would have moved to beyond 1.0915. The stretch line by then would be up to 70-pip higher (happens to be FOMC Thursday). 1.1110 again?
