
My latest indicator, which I named Market Type, is a Swiss Army Knife Tool.
It is based on a simple idea of plotting volatility in both directions on a closing basis with 6 samples on the 30 minutes.
The list of things that it can provide you with is truly astonishing.
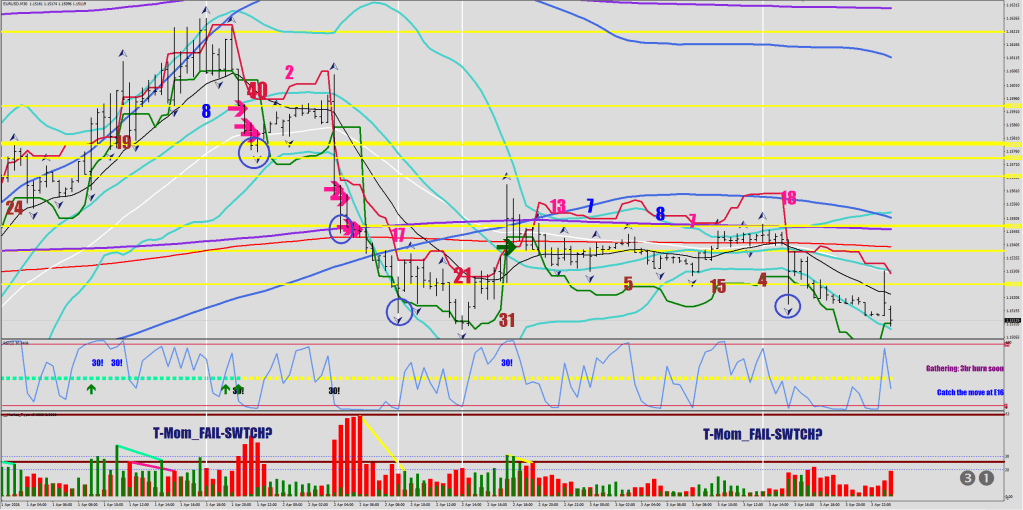
First, there is the pullback (yellow lines) that connects two humps with different colors.
In the following image, I circled the unexpected green continuation. This is the SOB, as you would normally expect a matching size bar next in the first, not the second color. Meaning, the next leg down would be the last. The brown horizontal lines are projection lines in search of the matching pair of the yellow divergence’s last volatility print.
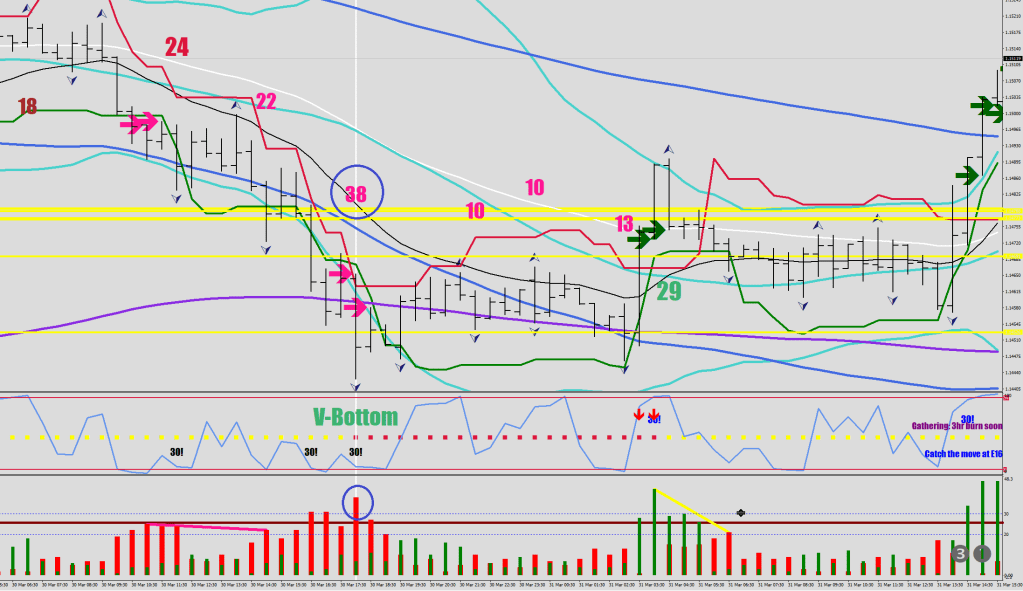
A taper (same color humps connected) is a volatility divergence or a taper. Often, a V-bottom or V-top is what you should be looking for next. These swing lows usually do not get violated at all, or by a couple of pips at most. You are looking for a larger than 35-pip print.
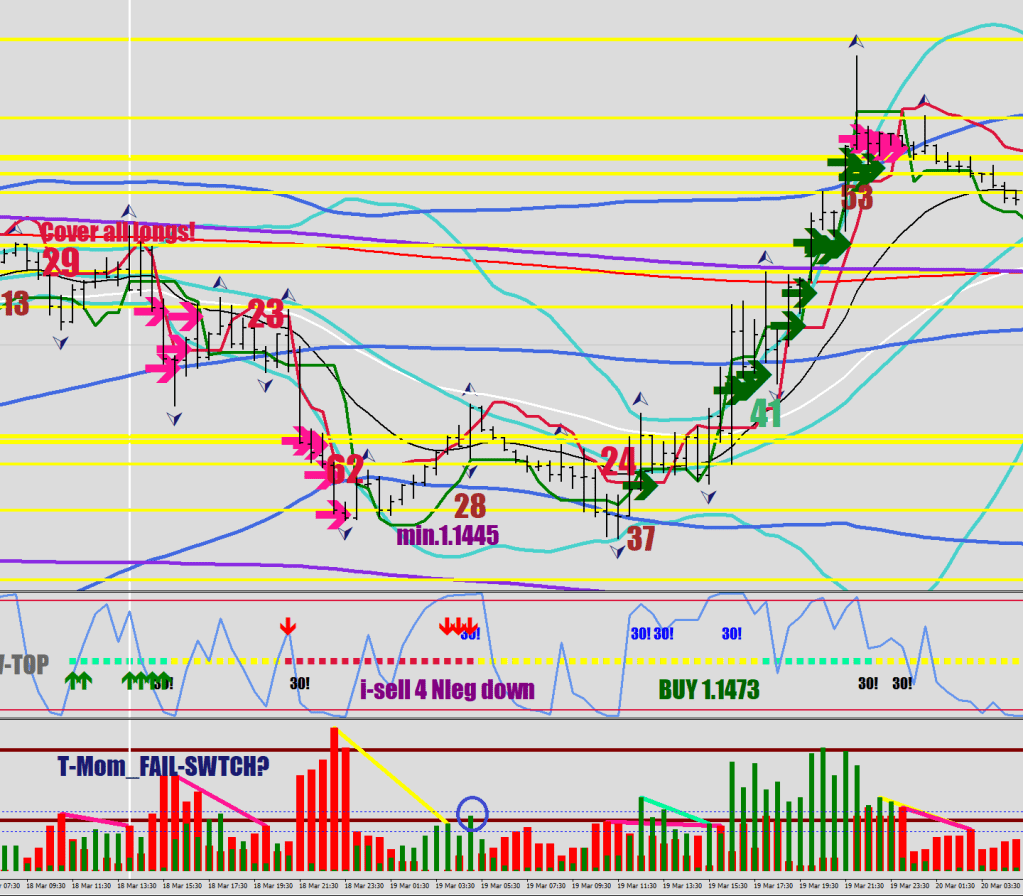
Now here comes the headline, the momentum failure.
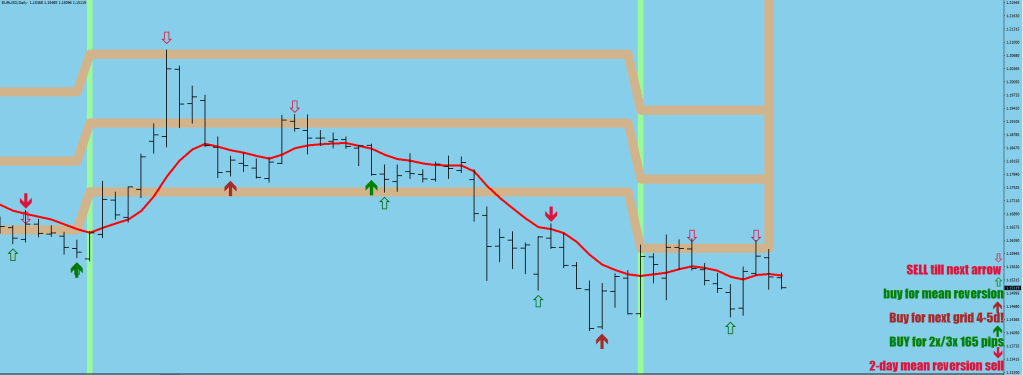
Mr. Reznicek says there’s no gravity on the charts. That may be true for Gold or stuff people HODL. Not for Forex. Gravity is present intermittently and is brought on by momentum failure. In fact, it tends to happen twice in a row. This is the very trade you want to be looking for if on the daily Grid is unable to get back above the first obstacle line, which is about 90% of the time.
Once the momentum fails (measured by 3-5 candles, from the current up fractal’s close to the bottom of the last fractal print), you are looking for 3 progression fractals down (on occasions 2, if the move gets stalled by the 120 BB). So in the above picture, two more progression fractals down are missing. The failure is a print below 10 pips with the high getting outside the 30 BB.
The blue color on the number is just extra confidence: not only terminal size, but also terminal duration to the swing (1.5-2.5 hours, aka an echo)/
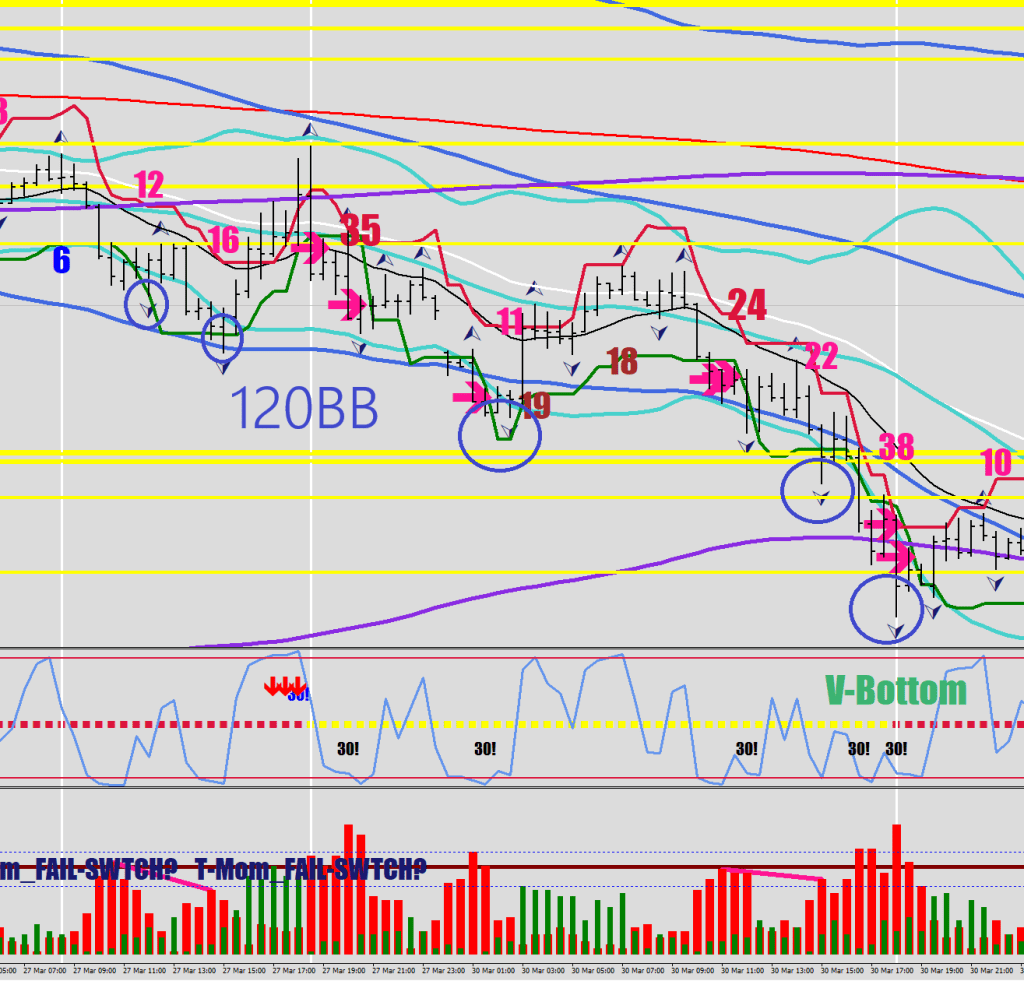
I left the RSI2 digital print in from a previous routine.
#property copyright "Copyright © 2026, Macdulio" #property link "https://forexfore.blog" #property description "V1.0"#property description "Market Type"#property strict//--- indicator settings#property indicator_separate_window#property indicator_buffers 3#property indicator_color1 clrRed#property indicator_color2 clrGreen#property indicator_level1 20#property indicator_level2 30#property indicator_levelcolor clrBlue#property indicator_levelstyle STYLE_DOTextern int lookback = 100;extern int indicator_window = 2;extern int sample = 200;extern double FSize=32;double upper[], middle[], lower[];double volup[], voldn[];double avg;double FMax = FSize*6/5;double iHi4[];double iLo4[]; int mes[]; string symbol = Symbol(); double ExtATRBuffer[],ExtATRBuffer2[],ExtATRBuffer3[],ExtATRBuffer4[],ExtATRBuffer5[],stoch60[];double corr[],corr2[], RSI2[], squeeze[];int init(){ SetIndexBuffer(0,voldn); SetIndexStyle(0,DRAW_HISTOGRAM,STYLE_SOLID,6,indicator_color1); SetIndexBuffer(1,volup); SetIndexStyle(1,DRAW_HISTOGRAM,STYLE_SOLID,4,indicator_color2); return(0);}//+------------------------------------------------------------------+//| Average True Range |//+------------------------------------------------------------------+int start(){ ArrayResize(ExtATRBuffer, Bars); ArrayInitialize(ExtATRBuffer, EMPTY_VALUE); ArrayResize(ExtATRBuffer2, Bars); ArrayInitialize(ExtATRBuffer2, EMPTY_VALUE); ArrayResize(ExtATRBuffer3, Bars); ArrayInitialize(ExtATRBuffer3, EMPTY_VALUE); ArrayResize(ExtATRBuffer4, Bars); ArrayInitialize(ExtATRBuffer4, EMPTY_VALUE); ArrayResize(ExtATRBuffer5, Bars); ArrayInitialize(ExtATRBuffer5, EMPTY_VALUE); ArrayResize(iHi4, Bars); ArrayInitialize(iHi4, EMPTY_VALUE); ArrayResize(iLo4, Bars); ArrayInitialize(iLo4, EMPTY_VALUE); ArrayResize(stoch60, Bars); ArrayInitialize(stoch60, EMPTY_VALUE); ArrayResize(RSI2, Bars); ArrayInitialize(RSI2, EMPTY_VALUE); ArrayResize(corr, Bars); ArrayInitialize(corr, EMPTY_VALUE); ArrayResize(corr2, Bars); ArrayInitialize(corr2, EMPTY_VALUE); ArrayResize(middle, Bars); ArrayInitialize(middle, EMPTY_VALUE); ArrayResize(mes, Bars); ArrayInitialize(mes, 0); ArrayResize(squeeze, Bars); ArrayInitialize(squeeze, 0); ArrayResize(upper, Bars); ArrayInitialize(upper, EMPTY_VALUE); ArrayResize(lower, Bars); ArrayInitialize(lower, EMPTY_VALUE); ArrayResize(volup, Bars); ArrayInitialize(volup, EMPTY_VALUE); ArrayResize(voldn, Bars); ArrayInitialize(voldn, EMPTY_VALUE); int i,j,k; for(i=lookback; i>=0; i--){ stoch60[i]=iStochastic(symbol,60,60,3,3,MODE_SMA,0,MODE_SIGNAL,i); RSI2[i]=iRSI(symbol,0,2,PRICE_MEDIAN,i); volup[i]=NormalizeDouble(MathAbs((Close[i]-iLow(symbol,0,iLowest(symbol,0,MODE_LOW,5,i)))*10000),0); voldn[i]=NormalizeDouble(MathAbs((iHigh(symbol,0,iHighest(symbol,0,MODE_HIGH,5,i))-Close[i])*10000),0);}deletetxt1("AverD");int twodigits = NormalizeDouble(RSI2[0],0);//if (MathAbs(ExtATRBuffer[0])>ExtATRBuffer2[0]) twodigits = NormalizeDouble(MathAbs(ExtATRBuffer[0]),0);//string tds = IntegerToString(twodigits);int tens = round(twodigits/10);int ones = twodigits-tens*10; string stens, sones;//Print("tens=",tens);//Print("ones=",ones);switch(tens){case 1: stens=CharToStr(140); break;case 2: stens=CharToStr(141); break;case 3: stens=CharToStr(142); break; case 4: stens=CharToStr(143); break;case 5: stens=CharToStr(144); break;case 6: stens=CharToStr(145); break; case 7: stens=CharToStr(146); break; case 8: stens=CharToStr(147); break; case 9: stens=CharToStr(148); break; default: stens=CharToStr(139); break; } //deletetxt1("AverD");switch(ones){case 1: sones=CharToStr(140); break;case 2: sones=CharToStr(141); break;case 3: sones=CharToStr(142); break; case 4: sones=CharToStr(143); break;case 5: sones=CharToStr(144); break;case 6: sones=CharToStr(145); break; case 7: sones=CharToStr(146); break; case 8: sones=CharToStr(147); break; case 9: sones=CharToStr(148); break; default: sones=CharToStr(139); break; } string jointstring=stens+sones;ObjectCreate("AverD",OBJ_LABEL,indicator_window, 0,0);ObjectSet("AverD",OBJPROP_CORNER,3); ObjectSet("AverD",OBJPROP_XDISTANCE,20); ObjectSet("AverD",OBJPROP_YDISTANCE,27); ObjectSetText("AverD",jointstring,40,"Wingdings",DimGray);if (twodigits>85 || twodigits<15) ObjectSetText("AverD",jointstring,40,"Wingdings",Yellow); if (twodigits>94 || twodigits<6) ObjectSetText("AverD",jointstring,40,"Wingdings",DeepPink); return(0);}//+------------------------------------------------------------------+ void deletetxt1(string text){ for(int iObj=ObjectsTotal()-1; iObj >= 0; iObj--){ string on = ObjectName(iObj); if(StringFind(on, text) == 0) ObjectDelete(on);} } double findAvg(int period, int shift) { double sum=0; for (int x=shift;x<(shift+period);x++) { sum += High[x]-Low[x]; } sum = sum/period; return (sum); }
The interaction switch is on the 1H chart. The usual blue circles.
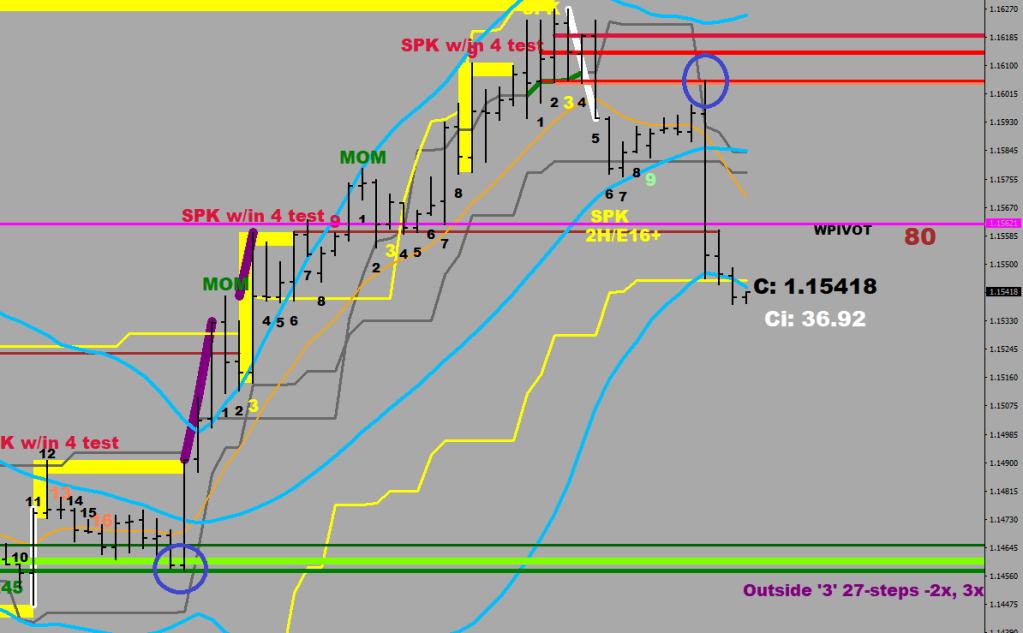
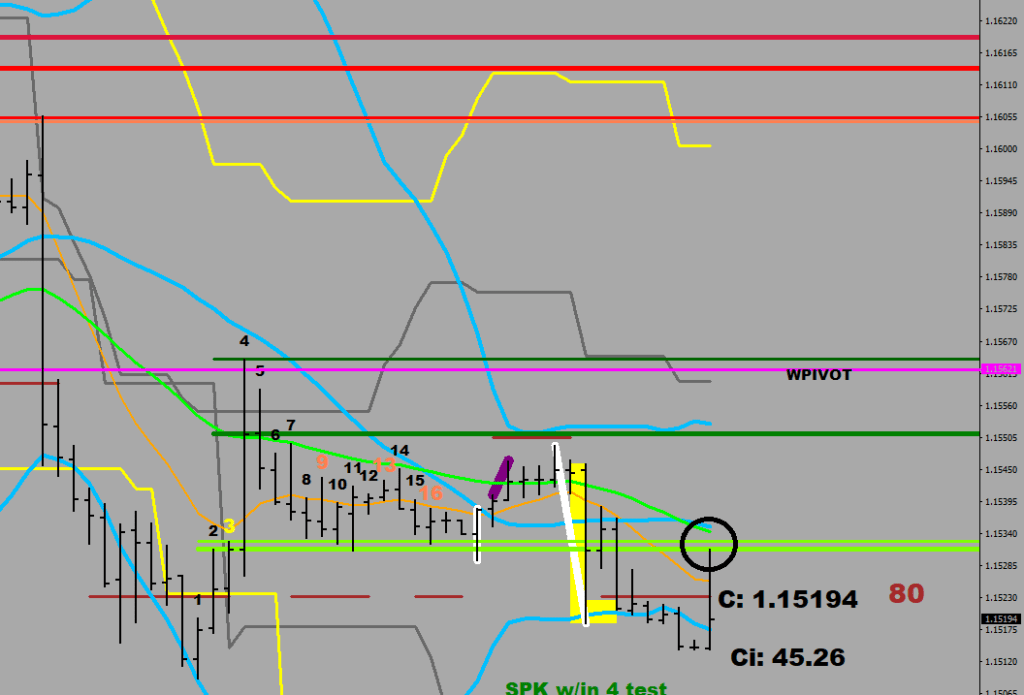
The 3rd or 4th hour’s close.
    if (counter==4){
                                    ObjectDelete("GRACHT4");
                                    ObjectCreate(0,"GRACHT4",OBJ_TREND,0,Time[i+2],Low[i],Time[i],Low[i]);
                                    ObjectSetInteger(0,"GRACHT4",OBJPROP_RAY_RIGHT,True);
                                    ObjectSet("GRACHT4",OBJPROP_COLOR,Coral);
                                    ObjectSet("GRACHT4",OBJPROP_WIDTH, 3);
                                    ObjectDelete("GRACHT5");
                                    ObjectCreate(0,"GRACHT5",OBJ_TREND,0,Time[i+2],Close[i],Time[i],Close[i]);
                                    ObjectSetInteger(0,"GRACHT5",OBJPROP_RAY_RIGHT,True);
                                    ObjectSet("GRACHT5",OBJPROP_COLOR,Crimson);
                                    ObjectSet("GRACHT5",OBJPROP_WIDTH, 5);

                  }


           if (counterd==3) {ObjectSetText("Countess"+i, IntegerToString(counterd,1,0), 15, "Arial Black", clrYellow);
                                    ObjectDelete("DRACHT3");
                                    ObjectCreate(0,"DRACHT3",OBJ_TREND,0,Time[i+2],Close[i],Time[i],Close[i]);
                                    ObjectSetInteger(0,"DRACHT3",OBJPROP_RAY_RIGHT,True);
                                    ObjectSet("DRACHT3",OBJPROP_COLOR,Chartreuse);
                                    ObjectSet("DRACHT3",OBJPROP_WIDTH, 5);
                                          ObjectDelete("DRACHT2");
                                    ObjectCreate(0,"DRACHT2",OBJ_TREND,0,Time[i+2],High[i],Time[i],High[i]);
                                    ObjectSetInteger(0,"DRACHT2",OBJPROP_RAY_RIGHT,True);
                                    ObjectSet("DRACHT2",OBJPROP_COLOR,Chartreuse);
                                    ObjectSet("DRACHT2",OBJPROP_WIDTH, 3);

                  }
14-hour high/low with a 13-pip increment between the previous 2 hours, followed by a choke (moderated gain) on the current candle gives you count 1
upsidei>0 && High[i]==iHigh(symbol,i>0 && High[i]==iHigh(symbol,0,iHighest(symbol,0,MODE_HIGH,14,i)) && High[i+1]>High[i+2]+130*Point && High[i]<High[i+1]+130*Point && High[i]>High[i+1] && Low[i+1]>iMA(symbol,0,8,0,MODE_EMA,PRICE_OPEN,i+1) i>0 && Low[i]==iLow(symbol,0,iLowest(symbol,0,MODE_LOW,14,i)) && Low[i+1]<Low[i+2]-80*Point && Low[i]>Low[i+1]-80*Point && Low[i]<Low[i+1]-10*Point && High[i+1]<iMA(symbol,0,16,0,MODE_EMA,PRICE_OPEN,i+1)
