
Yes, we saw the features of a Max Planck exit. To decide immediately which ones are the significant ones is a bit of arrogance.
Filtering is a kin of curve fitting. You often end up thinking that you were wrong about some expression and remove it at the worst possible time. I wanted to scrap the claw exception, and it was stupid. I removed the comment lines in front of the ObjectDelete.
 if (i>0 && Low[i-1]<Low[i+1]){
           ObjectCreate("SOGZi"+IntegerToString(i),OBJ_TEXT, 1, Time[i+1],35);
            ObjectSetText("SOGZi"+IntegerToString(i),"Claw! ", 36, "Impact", clrMaroon);
             ObjectDelete("PitusZ"+IntegerToString(i));
         }
Now, with having two examples, I can have a better idea of the exit condition.
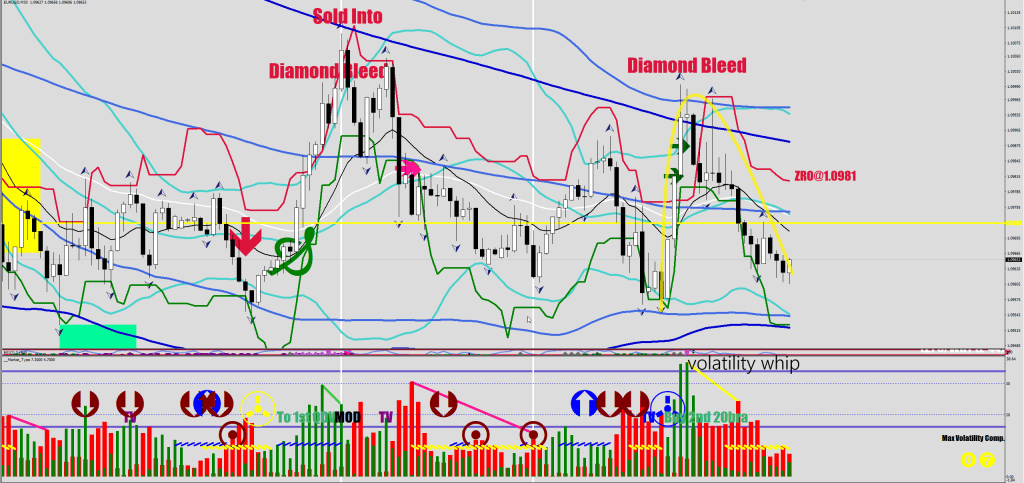
Two qualified volatility divergences + a beat 23-27 pips out (yellow moratorium box).
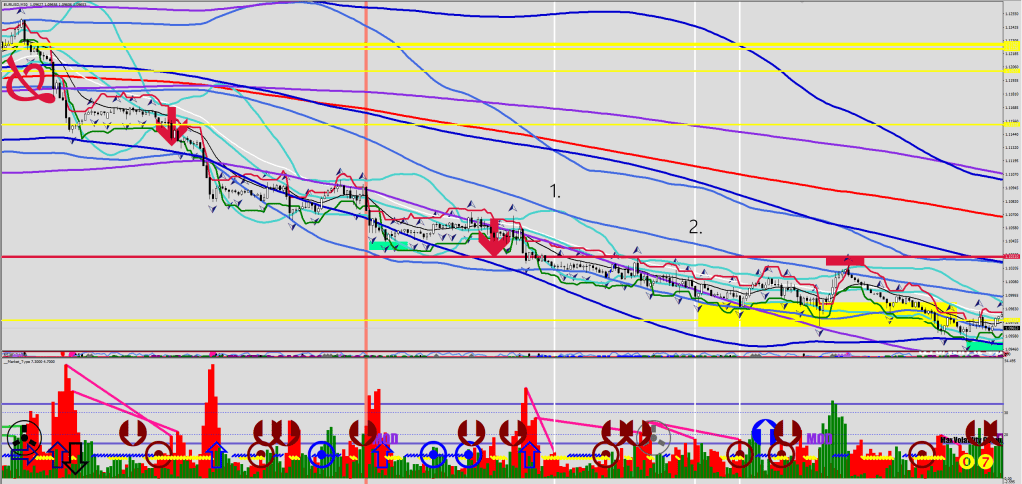
As a side note, we can now add not be surprised to see a 300-pip move with corrections capping out from 25 to 36 pips.
Overall, we had to afford some new information for a bit of equity about mechanical parts of the market.
Now let’s gather all the evidence we can find about what has happened to have some idea about the next steps.
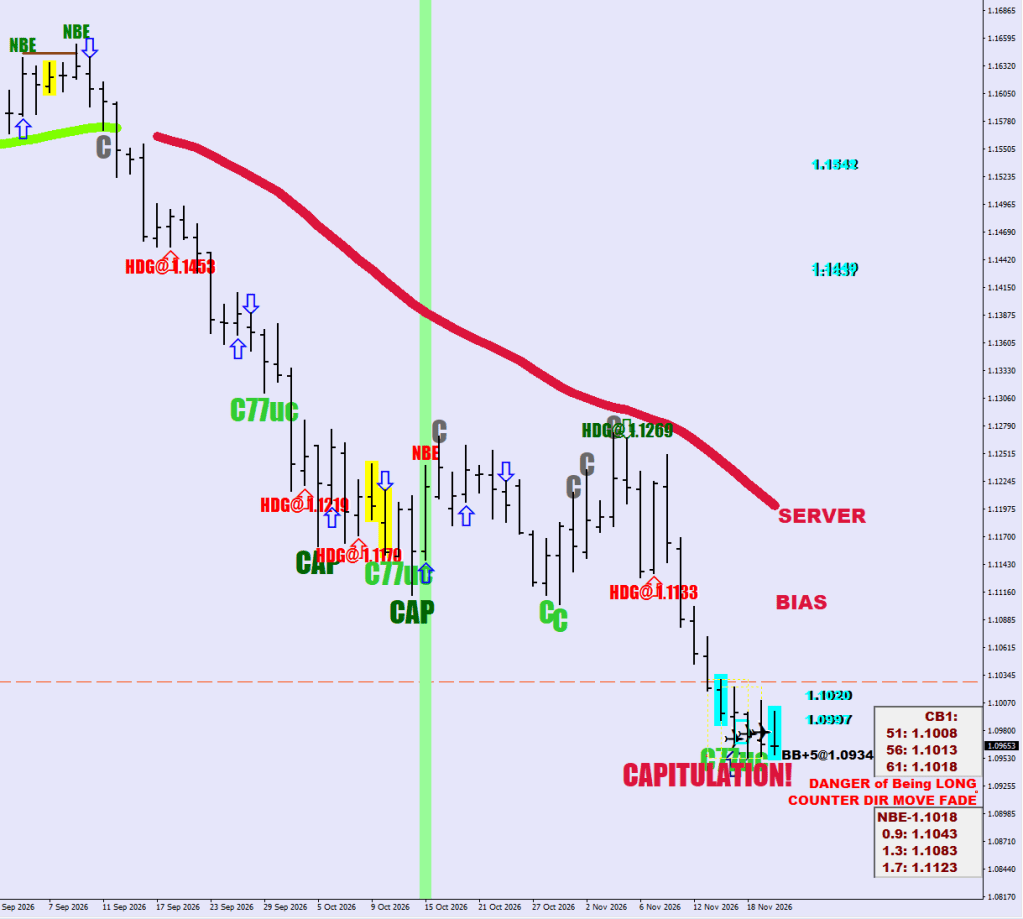
We have seen a 5-wave structure down, with wave 4 of Wave 3 printing a SOB (shot over bow) @ 54 pips from the 200-hour low, followed by a Wave 4 printing another SOB at a similar distance. I mark up the SOB at 47 pips, but what is important is that the move would get outside the fluctuation maximum – 45 pips. Wave 5 did not make a lower low.
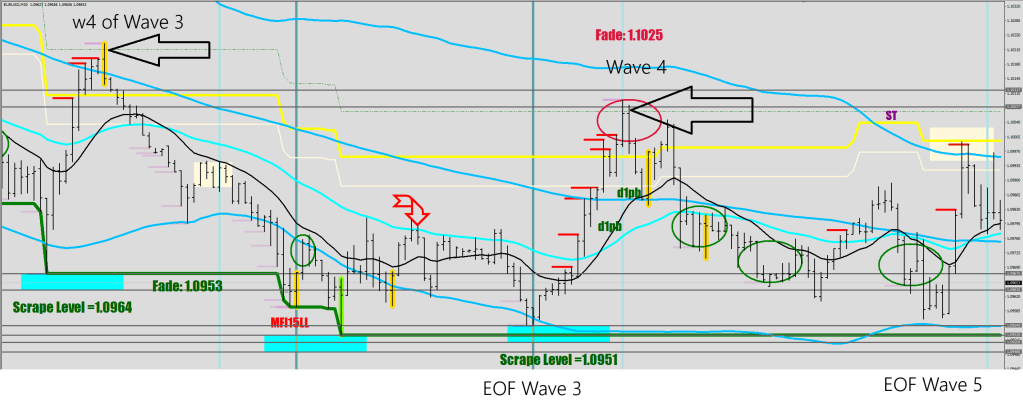
Therefore, we should see a correction back up; a mean reversion would mean 1.1040-1.1-1070 and hitting the 712 SMA (30 min) would mean 1.11.
If we look at the 120-sample stochastic, this may be the first buyable pullback in 2 weeks, easing back below 50.
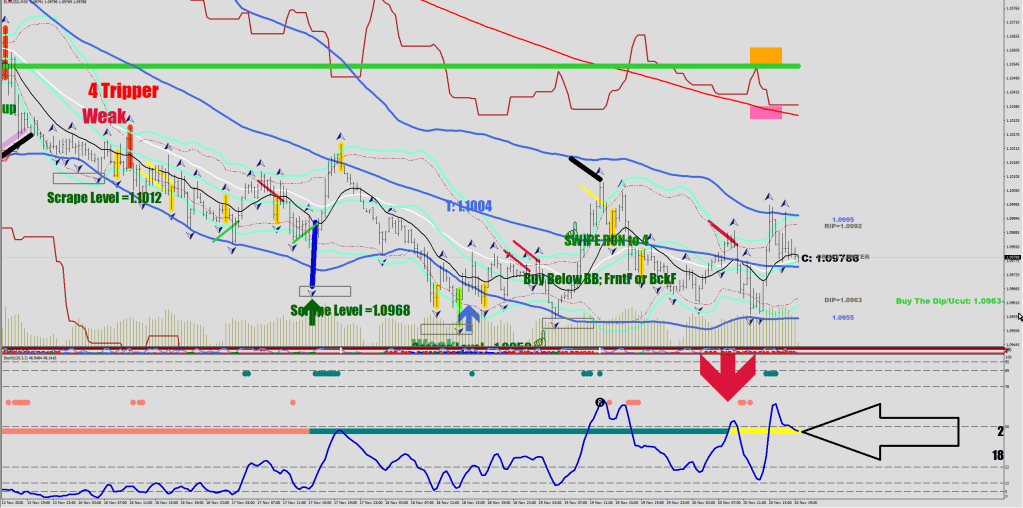
I personally would not be surprised to see a gap up. Sure, I am biased, holding 14.5 lots.
The weekly speaks of an enormous volume coming in; the predicted volatility convergence has played out, and this overshoot could correct back up for another kiss.
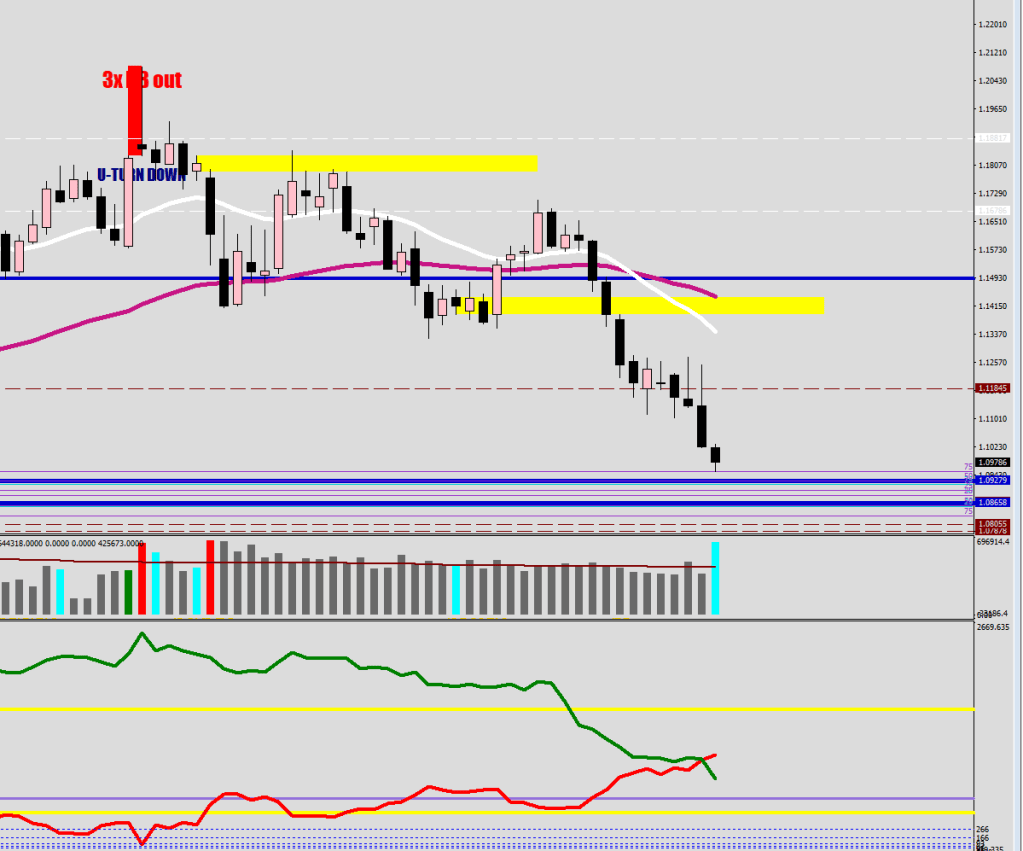
1.1184 is as important as ever. My base case for the upside move is two qualified volatility divergences and a beat.
If you want a wild upside projection, I could give you 1.1413.
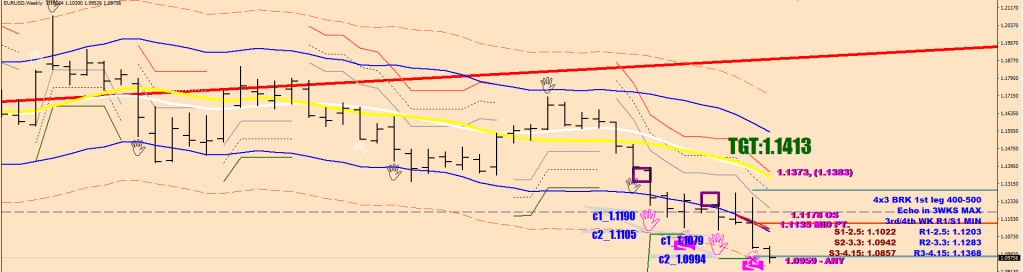
The last projection was 1.1448 on the downside, and it was missed by only 20 pips. It took 7 weeks to play out.
Look at the two cyan candles (pro daily volume). Two of those in the last 5 days. Do you think they are selling now, when everyone is already short?
What happened at the end of Friday was a volatility whip. Wave 1 up should start from right around here.
I think a bounce back to the green trendline isn’t too much to ask.
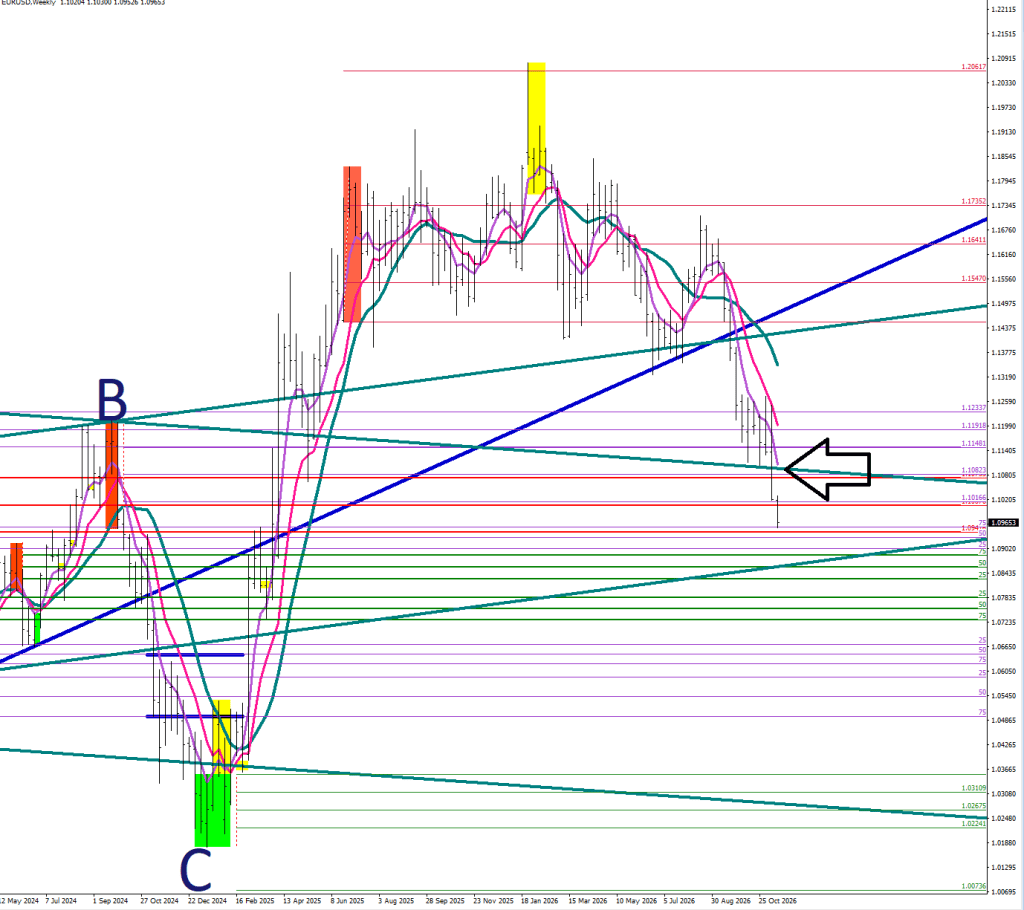
Collected likes for these:

