I’m not sure what you are going to be doing with all of this, but I decided to share; this is what I am currently preoccupied with.
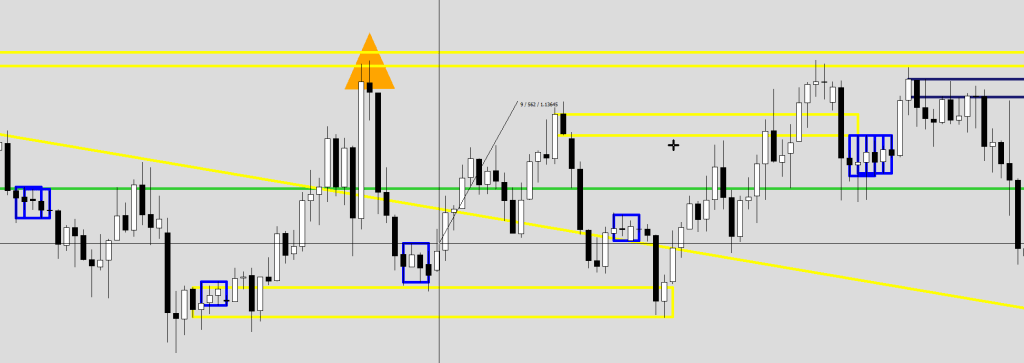
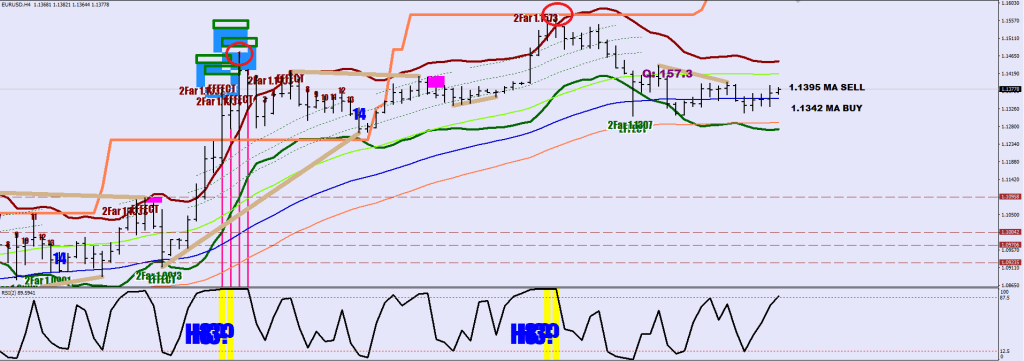
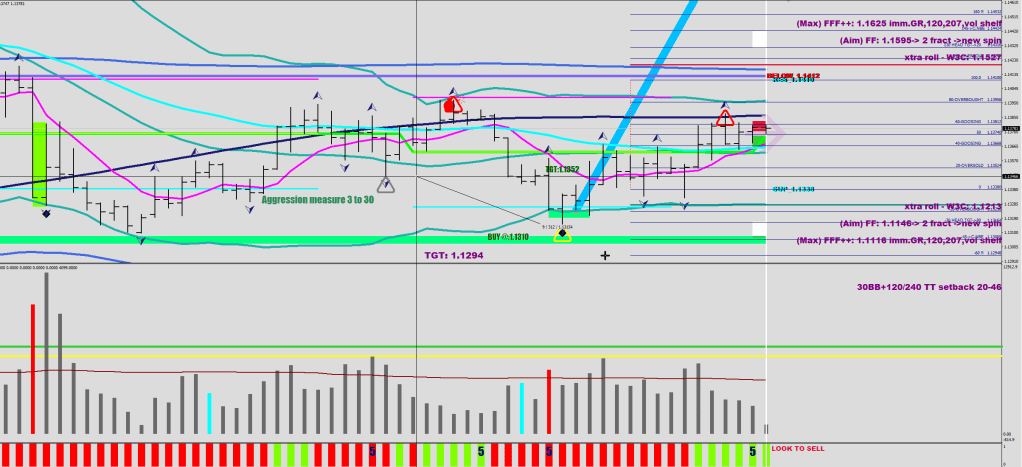
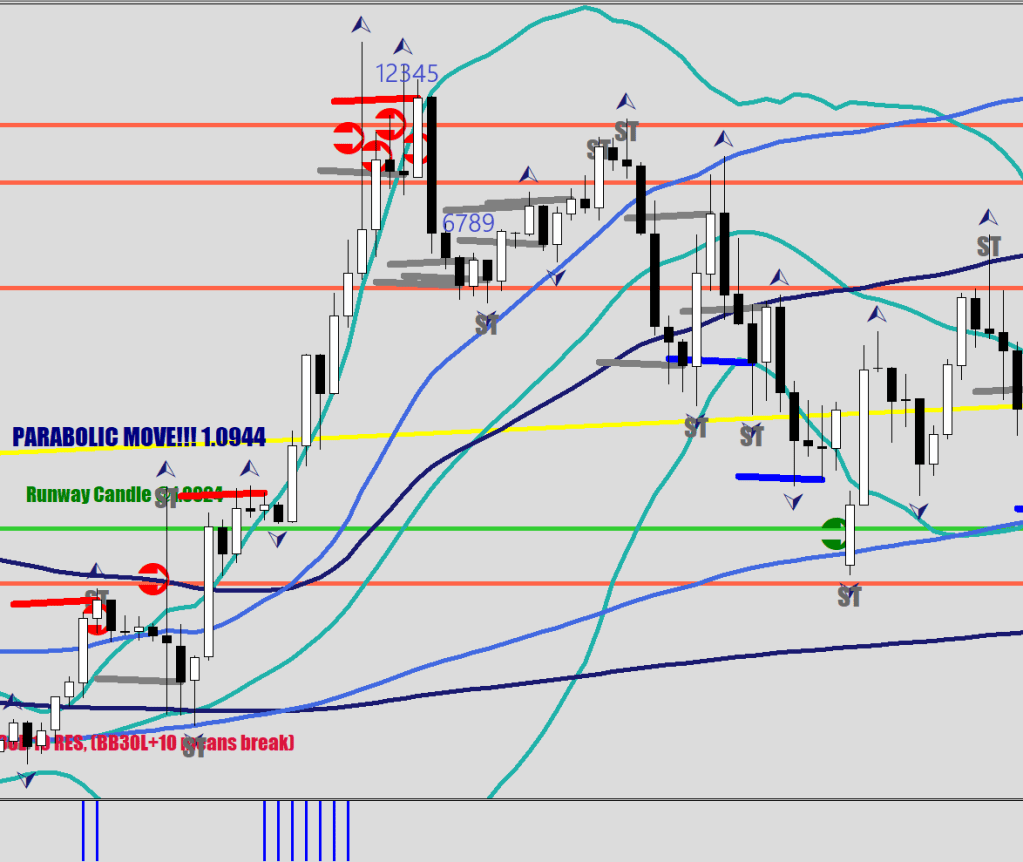
Those orange triangles mark up stair-stepping breakout failures.
If I were screening for an apprentice, I would ask, What is 17 pips for the Euro?
The answer, of course, is that it is the size of one step. If someone said it meant about one-half of the Euro’s fluctuation size, I would probably pass them still.
When the RSI2 hits in the last 2%, you get the following values: 17 pips out is the next step. 22 pips out, strong fade, 27 pips out, a stair-step breakout is occurring. In the next 4 hours an adjustment can be made to the calculation’s base value, and there are MFI(7) filters applied.
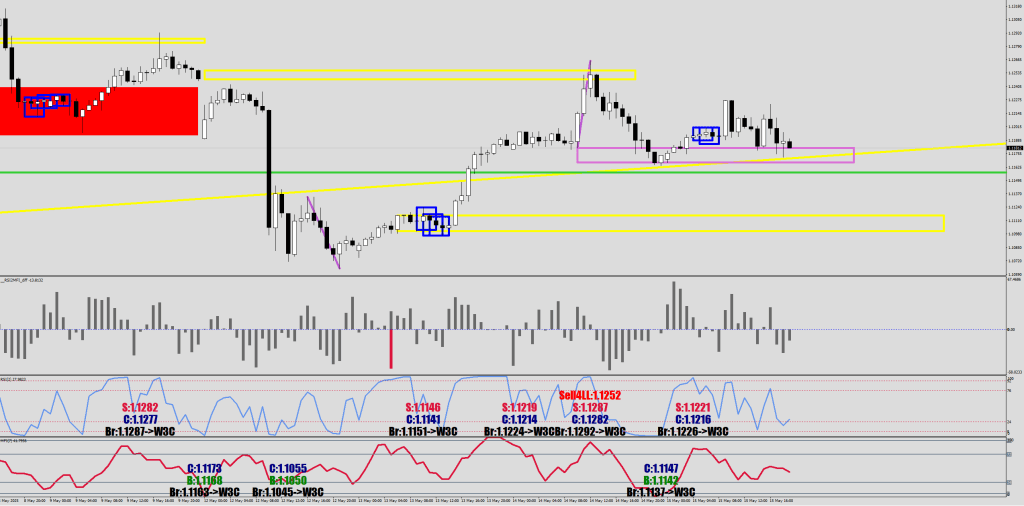
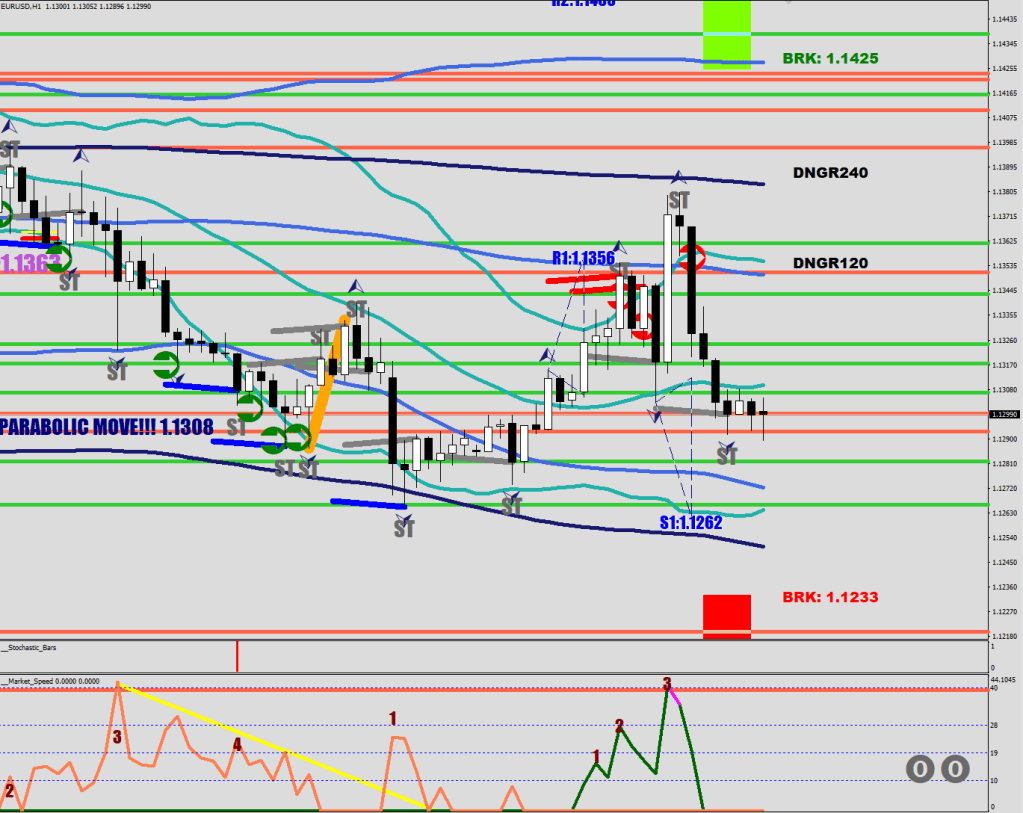
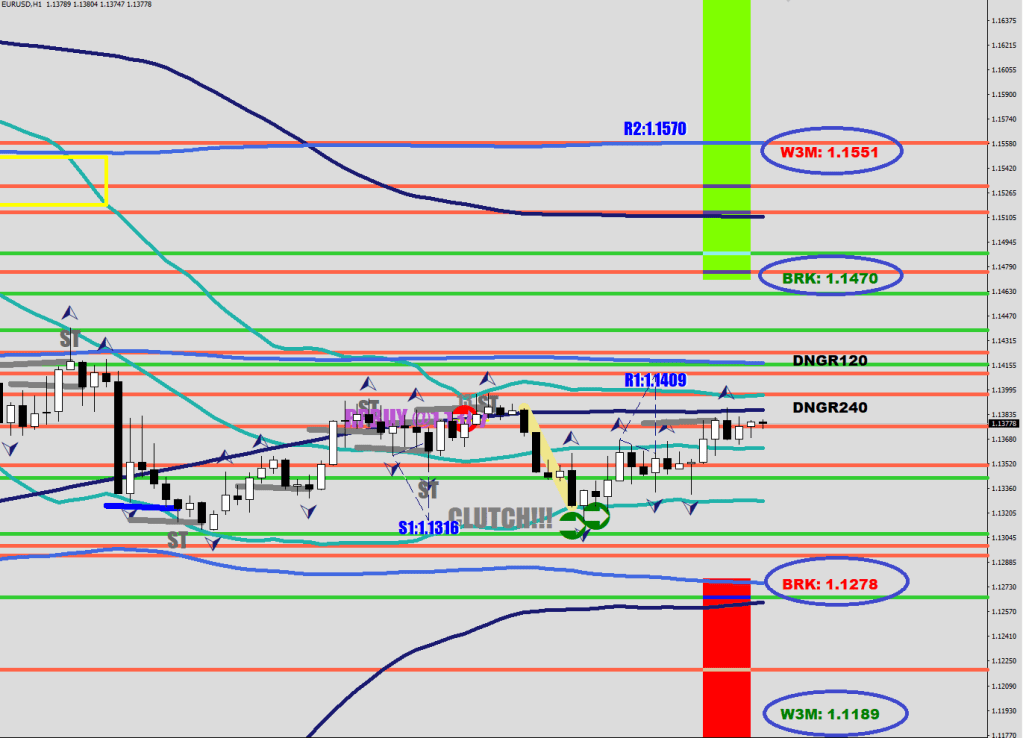
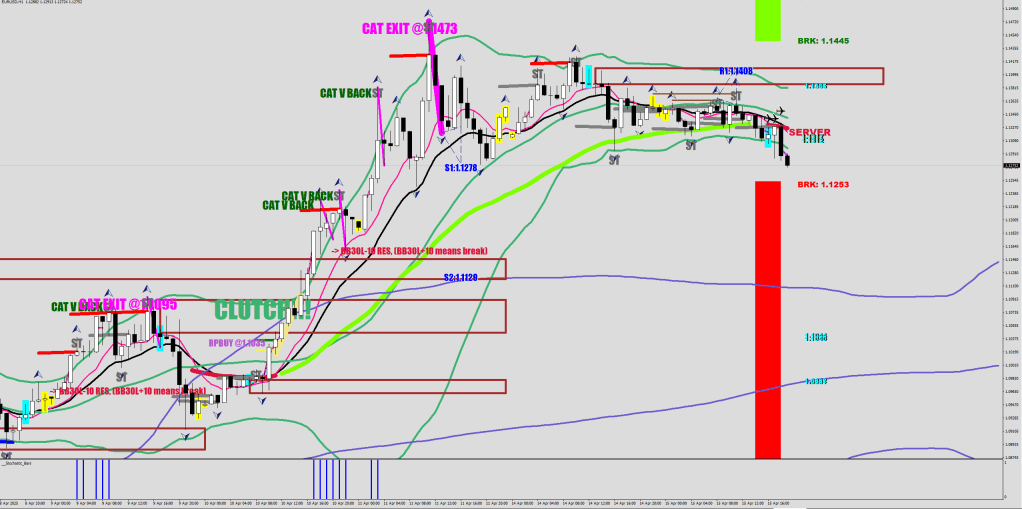
The professional volume prints (cyan) are all on the upside.
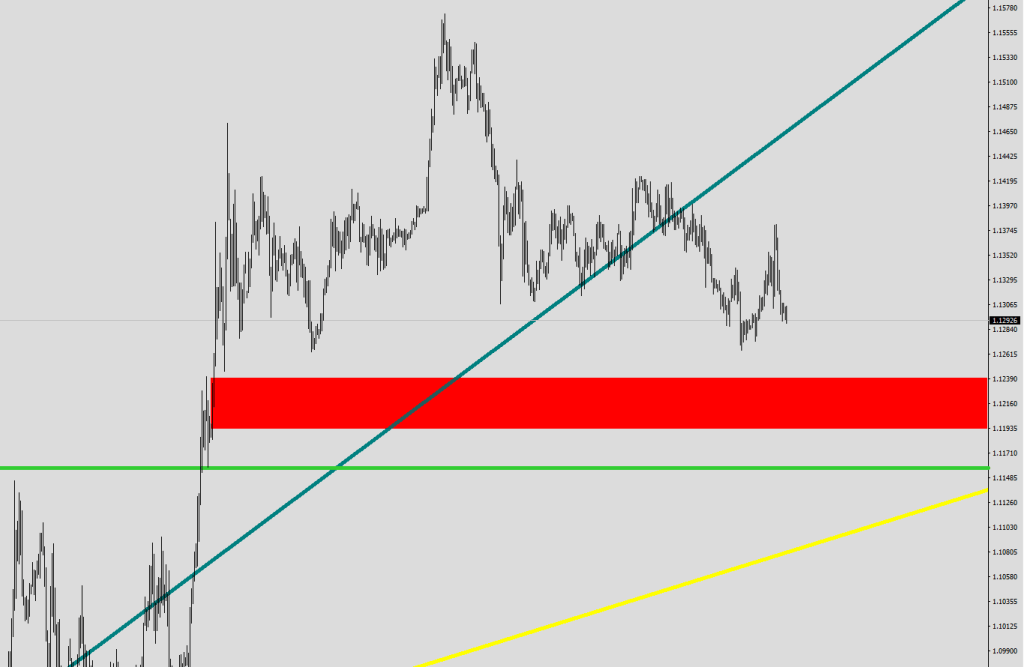
The upper trendline is about to be cracked. The next two weekly levels are 1.1234 and 1.1192.
Hmm… 1.1233 again – as for a volatility breakout potential. Of course, the market cannot consolidate if they want to keep that in place. W3M is at 1.1211 – a testament to the 3-day volatility collapse.
It is a wave 5 down in my opinion. The how low starts below 1.1262. The strong move down is looking like a money flow acceleration, meaning that you should see a lower low first (13 pips on average) followed by a thrust to the downside.
I have given this lesson many times, the bumper line is a 100-pip displacement with a 20x 4H delay
 if (High[i+20]>iHigh(symbol,0,iHighest(symbol,0,MODE_HIGH,200,i+21))) upperbumper[i]=High[i+20]+1000*Point;
    if (Low[i+20]<iLow(symbol,0,iLowest(symbol,0,MODE_LOW,200,i+21))) lowerbumper[i]=Low[i+20]-1000*Point;
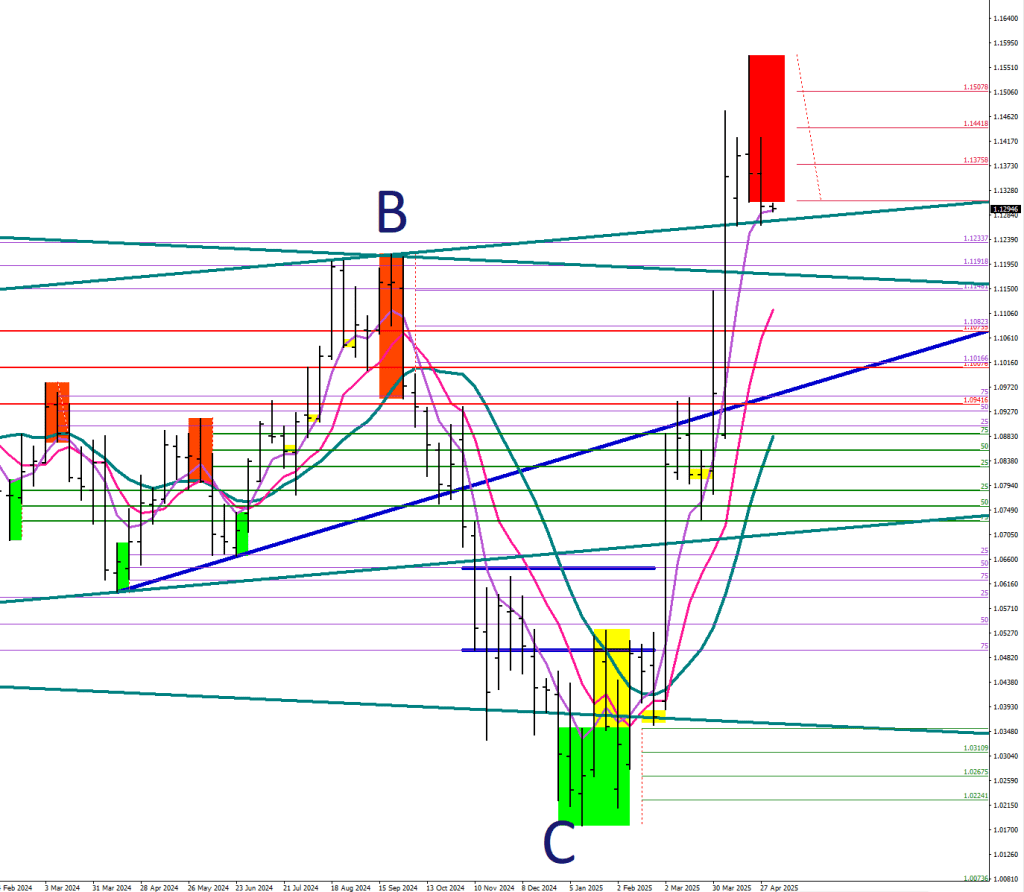
The head and the right shoulder tend to have this relationship on EUR/USD. I cannot say anything similar about any other instrument.
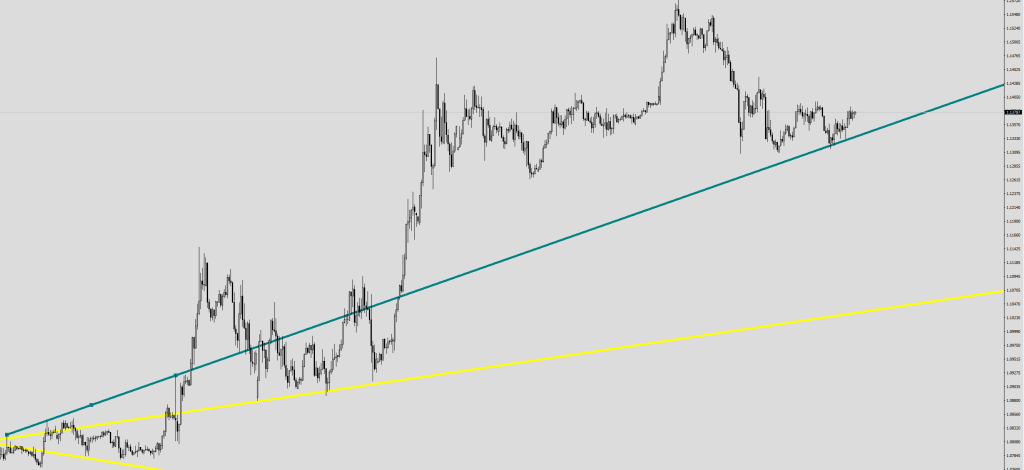
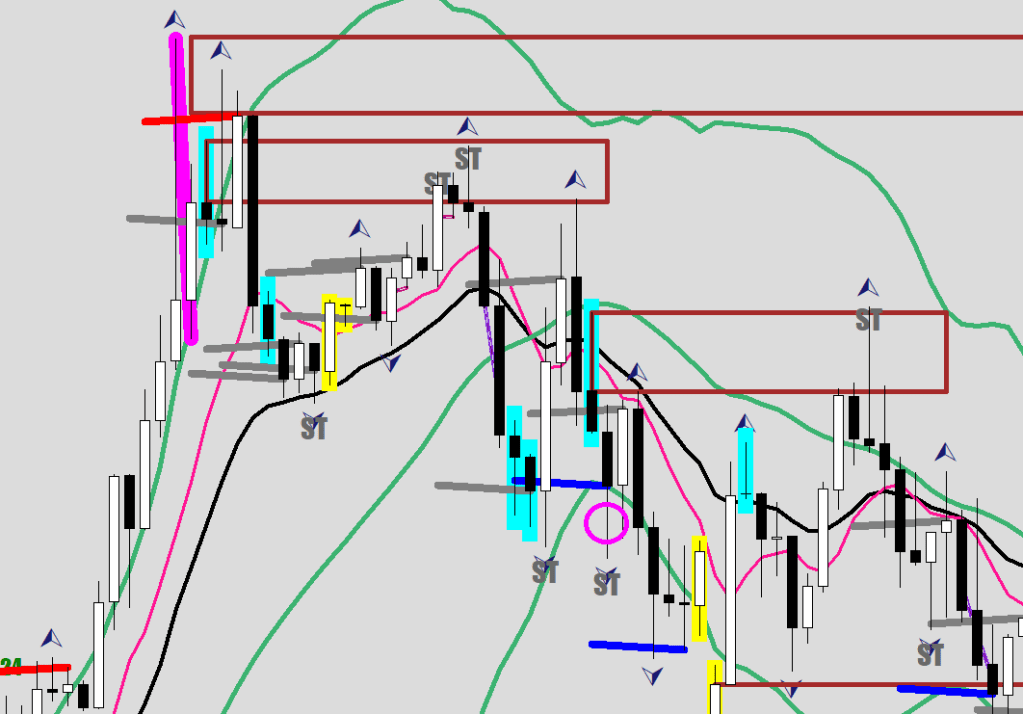
Now take a look at where we are, that teal trendline is the very defining low of this current uptrend, I left the connection points lit, so you can see where it started.
Pay attention to how meager the bounce has been.
What are they selling and what are they buying.
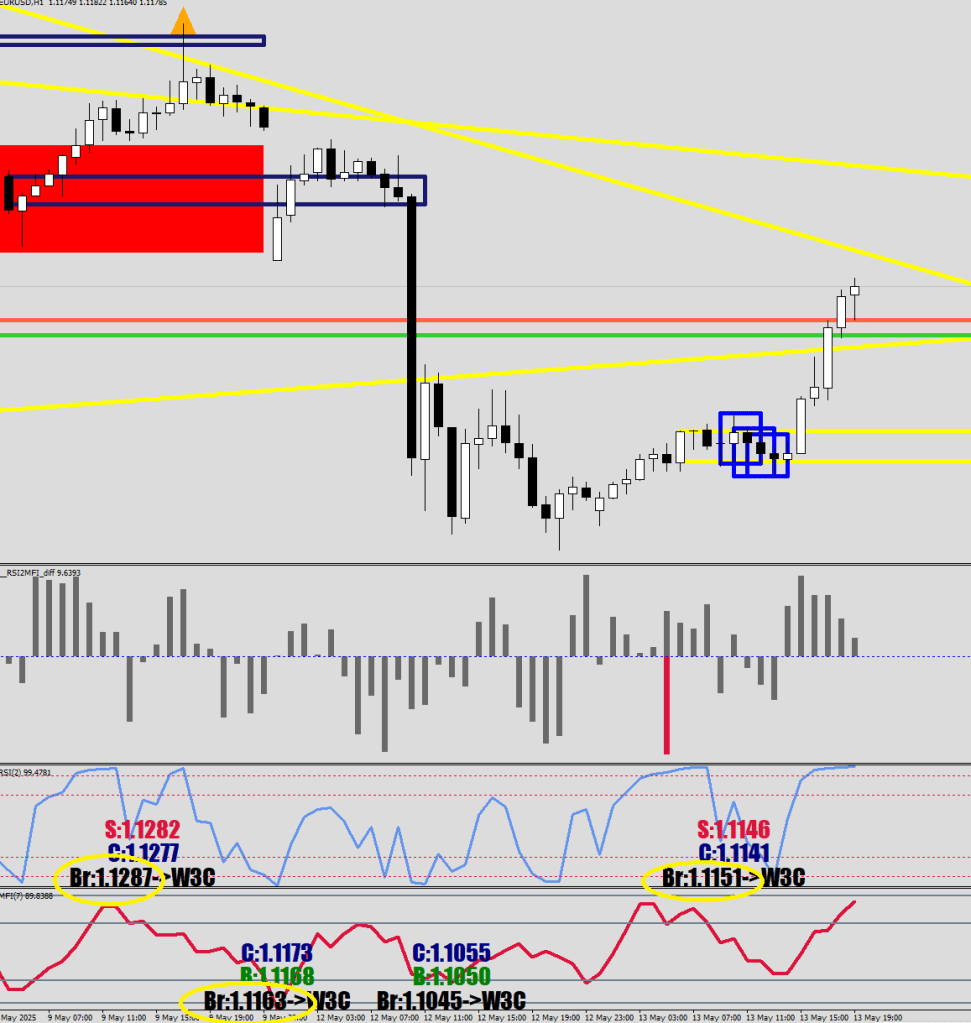
I would say that in the last 72 hours, they typically sold after the 3rd hourly close above the E-44 and bought after a red volume print, mostly the undercut.
Now, triangular bells / fractal evaluation.
A gray triangle warns that bull aggression should be measured next. The undercut would likely be 3-30 pips lower. If they bought 3 pips out, they are very aggressive; if they bought 30 pips lower, they are pretty relaxed.
The current squeeze would most likely result in a volatility breakout. The rectangular strips show the numbers where the break could occur, depending on the manner of the approach (outside an expanding BB30 will do), and then you should be targeting the W3M numbers.
These numbers get adjusted when the consolidation mean gets re-adjusted. Do you have any clue about the breakout numbers for any other instrument? I don’t. It took me 12 years to figure these out.
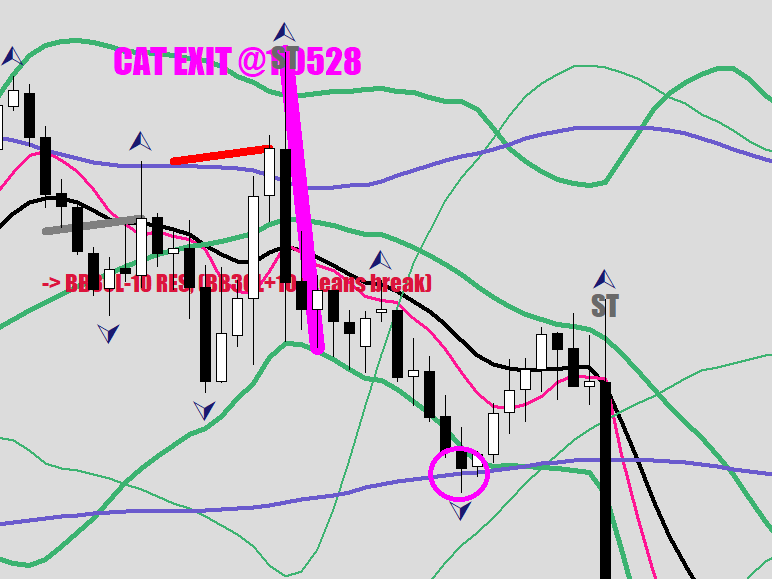
The one example that I had until today for a peak/low coinciding with a stochastic bar print (momentum present) was this:
Note that the market speed print (distance achieved outside the 30 BB) did not coincide with the actual low print. The thin magenta line was the 3-hour span that made a support box for the price in the future, insisting on going lower.
This raises the possibility of a legitimate high made today.
The momentum high and the separation high here are also separated, and there is still momentum showing at the peak, yet it is a tired move for an extra 6 pips thanks to inertia.
I believe that the new magenta box is a sell and may be a sell more than once.
What is important in terms of a swing high getting confirmed in is that the price would close 91+ pips below the 1.1572 high for the week.
Divergent in terms of the distance achieved beyond the upper 30BB. Since we are talking 20 pips or so (the scale is set back by 20 pips inside the BB) it would have to be multiple pushes up or a motion that starts the expansion gradually first.
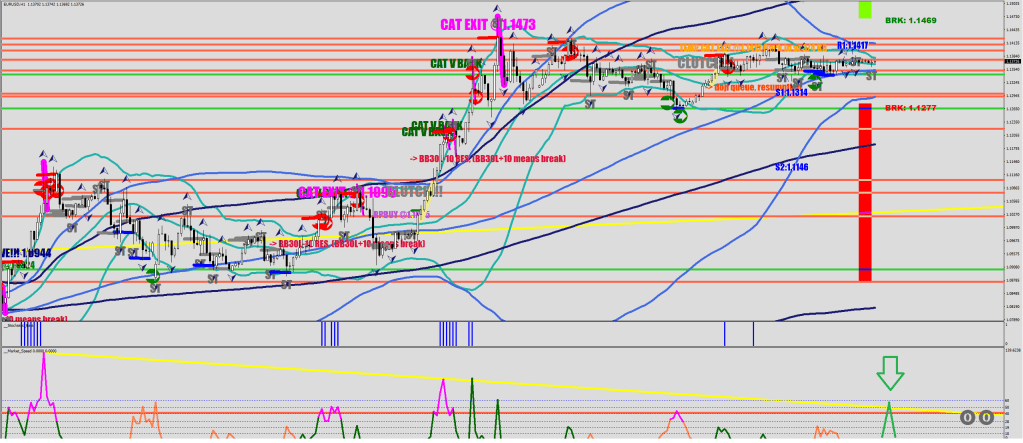
Although after 120 hours of rest, the 1.1473 is no longer safe, I do not think this would get there. The game would start at 1.1429 and could get within 10 pips of the break level, so 1.1457. Can’t narrow it further. That high should be the rest before returning below the daily E-9.
The scissor between the 30-min E-414L and the S-712 is currently 91 pips. I have not seen a larger number. It would be merely impossible to cross. A major consolidation would be necessary below the E-9 before being able to cross that.
I am on the side of Brent Johnson, thinking that the Dollar would make a new higher high next. I think the 1.30-1.40 Euro calls are utter rubbish.
If we get a move back up, I think it will be thrown into the brown box (the wick of the professional volume candle). Otherwise, the red strip is the main obstacle, but a fresh consolidation move it about.
When you get a momentum loss (CAT EXIT) combined with a counter-directional move of strength (thick magenta diagonal), the next call point is the 30-sample BB plus 5 pips.
From there, there are different paths to take. My guess is a back test of the 1.1150-1.1130 zone. This would also coincide with the 120 BB (blue line) top. A leg up is a good likelihood.
///45+pips rejection
  if (i>1 && iFractals(symbol,0,MODE_UPPER,i) && High[i]==iHigh(symbol,0,iHighest(symbol,0,MODE_HIGH,200,i))
  && High[i]>iBands(symbol,0,30,2,0,PRICE_MEDIAN,MODE_UPPER,i)
  ){
  if (High[i]-Low[i-1]>450*Point){
      ObjectCreate("Pinner"+IntegerToString(i),OBJ_TREND,0, Time[i], High[i], Time[i-1], Low[i-1]);
      ObjectSet("Pinner"+IntegerToString(i),OBJPROP_COLOR,Magenta);
      ObjectSet("Pinner"+IntegerToString(i),OBJPROP_WIDTH,5);
      ObjectSet("Pinner"+IntegerToString(i),OBJPROP_RAY_RIGHT,false);}
  if (Low[i-2]<Low[i-1] && High[i]-Low[i-2]>450*Point){
      ObjectDelete("Pinner"+IntegerToString(i));
      ObjectCreate("Pinner"+IntegerToString(i),OBJ_TREND,0, Time[i], High[i], Time[i-2], Low[i-2]);
      ObjectSet("Pinner"+IntegerToString(i),OBJPROP_COLOR,Magenta);
      ObjectSet("Pinner"+IntegerToString(i),OBJPROP_WIDTH,5);
      ObjectSet("Pinner"+IntegerToString(i),OBJPROP_RAY_RIGHT,false);}
      if (ExtMapBuffer3[i]==EMPTY_VALUE) ObjectSet("Pinner"+IntegerToString(i),OBJPROP_WIDTH,15);
  }

   if (i>2 && iFractals(symbol,0,MODE_LOWER,i) && Low[i]==iLow(symbol,0,iLowest(symbol,0,MODE_LOW,200,i))
   && Low[i]<iBands(symbol,0,30,2,0,PRICE_MEDIAN,MODE_LOWER,i)
   ){
  if (High[i-1]-Low[i]>450*Point){
      ObjectCreate("Pinner"+IntegerToString(i),OBJ_TREND,0, Time[i], Low[i], Time[i-1], High[i-1]);
      ObjectSet("Pinner"+IntegerToString(i),OBJPROP_COLOR,Magenta);
      ObjectSet("Pinner"+IntegerToString(i),OBJPROP_WIDTH,5);
      ObjectSet("Pinner"+IntegerToString(i),OBJPROP_RAY_RIGHT,false);}
  if (High[i-2]>High[i-1] && High[i-2]-Low[i]>450*Point){
      ObjectDelete("Pinner"+IntegerToString(i));
      ObjectCreate("Pinner"+IntegerToString(i),OBJ_TREND,0, Time[i], Low[i], Time[i-2], High[i-2]);
      ObjectSet("Pinner"+IntegerToString(i),OBJPROP_COLOR,Magenta);
      ObjectSet("Pinner"+IntegerToString(i),OBJPROP_WIDTH,5);
      ObjectSet("Pinner"+IntegerToString(i),OBJPROP_RAY_RIGHT,false);}
  if (High[i-3]>High[i-1] && High[i-3]-Low[i]>310*Point){
      ObjectDelete("Pinner"+IntegerToString(i));
      ObjectCreate("Pinner"+IntegerToString(i),OBJ_TREND,0, Time[i], Low[i], Time[i-3], High[i-3]);
      ObjectSet("Pinner"+IntegerToString(i),OBJPROP_COLOR,Magenta);
      ObjectSet("Pinner"+IntegerToString(i),OBJPROP_WIDTH,5);
      ObjectSet("Pinner"+IntegerToString(i),OBJPROP_RAY_RIGHT,false);}
      if (ExtMapBuffer2[i]==EMPTY_VALUE) ObjectSet("Pinner"+IntegerToString(i),OBJPROP_WIDTH,15);
  }
}
Usually, a disco track / EDM becomes popular. This time, they started listening to an Oasis parody.
The exit needs to meet 2 criteria: the move has to end in a capitulation that bounces back 100+ pips within 2 hours, and the momentum has to be gone = absence of a stochastic bar.
A couple of things I did not know the right answer to until today:
The flick flack around the BB is not a prerequisite; a rat poison sequence followed by a clutch is enough. However, I think you want to see the clutch pressed far enough from the consolidation weight i.e., past the “180 break” line. This means 96 pips.
As long as there is momentum still, further capituation moves can & will follow.
Now, let’s talk about the other catastrophic feature, the CAT HOT V. This is a fractal that is preceded by stochastic bar prints.
The take back of the high/low is a continuation entry, although when things aren’t hopping, price may need to return twice before the ball gets rolling again.
The V works wonders during a thrust/capitulation move.
 ///hot fractal on top (must overhedge for the break)
     if (iFractals(symbol,0,MODE_UPPER,i) && ExtMapBuffer3[i]!=EMPTY_VALUE  && ExtMapBuffer3[i+1]!=EMPTY_VALUE
     //&& ExtMapBuffer3[i+2]!=EMPTY_VALUE
     && (Close[i]>iBands(symbol,0,30,2,0,PRICE_MEDIAN,MODE_UPPER,i) || Close[i+1]>iBands(symbol,0,30,2,0,PRICE_MEDIAN,MODE_UPPER,i+1))

     )   {
        ObjectCreate("Daltoni"+DoubleToStr(i), OBJ_TEXT, 0, Time[i+5], High[i]+20*Point);
        ObjectSetText("Daltoni"+DoubleToStr(i), "CAT V BACK", 22, "Impact", DarkGreen);
 }
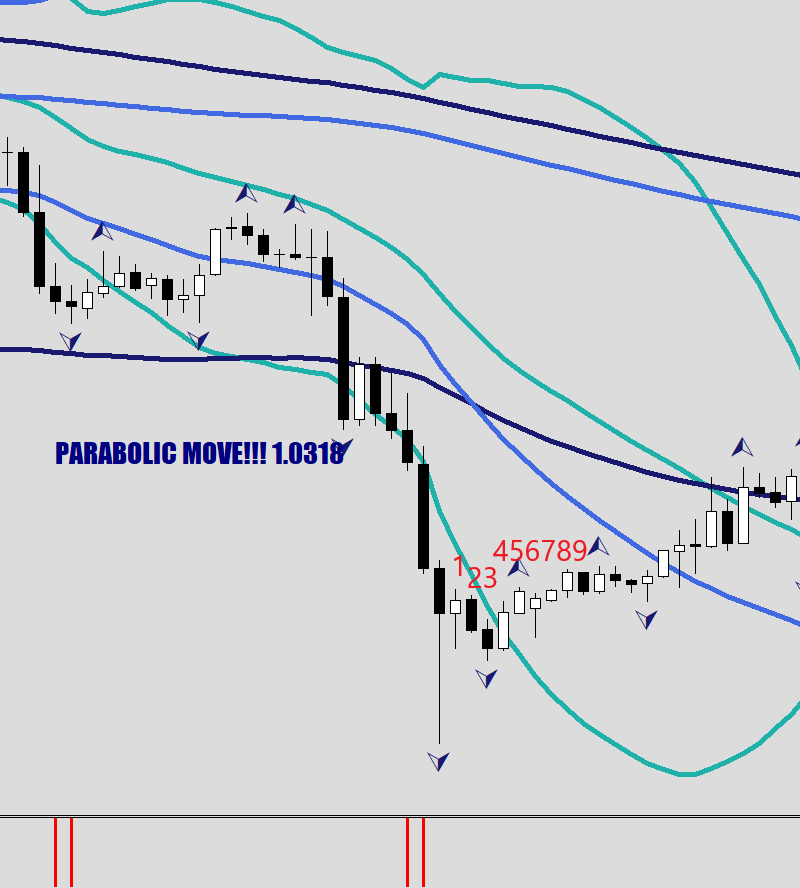
Now, check out what happens when a capitulation is qualified & sticks.
Within 9 hours, a consolidation takes place, and the E-16 gets touched. Since during the parabolic move, full consolidation does not
There may or may not be an echo move triggered here. Obviously, the capitulation / catastrophic terminal isn’t gonna be reached, but the price could come within 10 pips of it.
After the E-16 affair and/or the lastful reach, I would say the next call point would exceed the 30BB on the opposite end by 10 pips.
I liked today’s price action as well as the new lessons I was taught.