Check how cleanly that hourly support low was made (dark blue) and was back tested along with pro volume coming in. Interestingly enough they may have already gone back in short.
Things could accelerate once the daily pro volume candle gets exceeded to the downside by 15 pips.
There is a long way down for the daily stochastic.
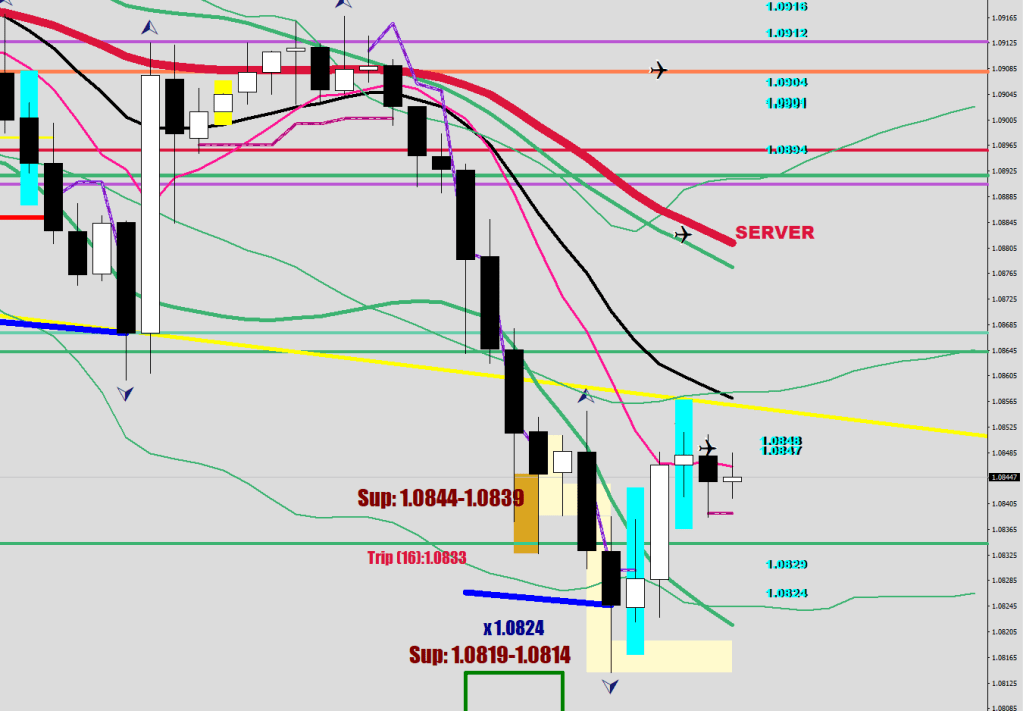
After a GLD print, a HEAD print would be logical, but I don’t know exactly until the market consolidates overnight taking the weight lower. Should that be here, you are looking at 1.0788-1.0770
There should be a catastrophic cover at the end of this decline, and the stochastic bars have not even started printing yet, let alone started diverging.
For now, the continuation entry should be a failure at the E-16: count 8 more candles after the down fractal, if no closes / not sustaining above the EMA, you should go in for the next leg.
The Market has three speeds: ebb and flow, Parabolic, and Catastrophic. All three speeds have different exits and somewhat different entries.
The catastrophic market kicks in with V outside the 8 EMO. It ends in a cluster of profit taking (multiple hourly prints back to back). You must go with the direction after every second counter fractal and with a print of a new V during a wave 3 of Wave 3. A catastrophic market can get outside the pendulum without consolidation by 30 pips.
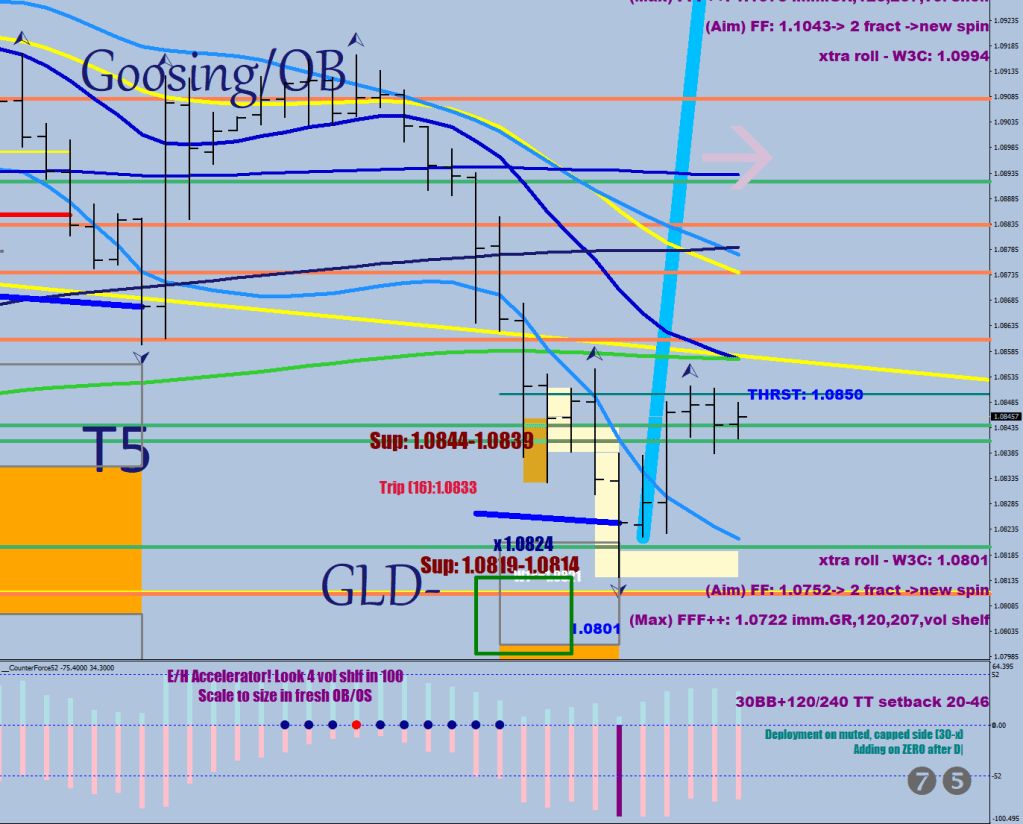
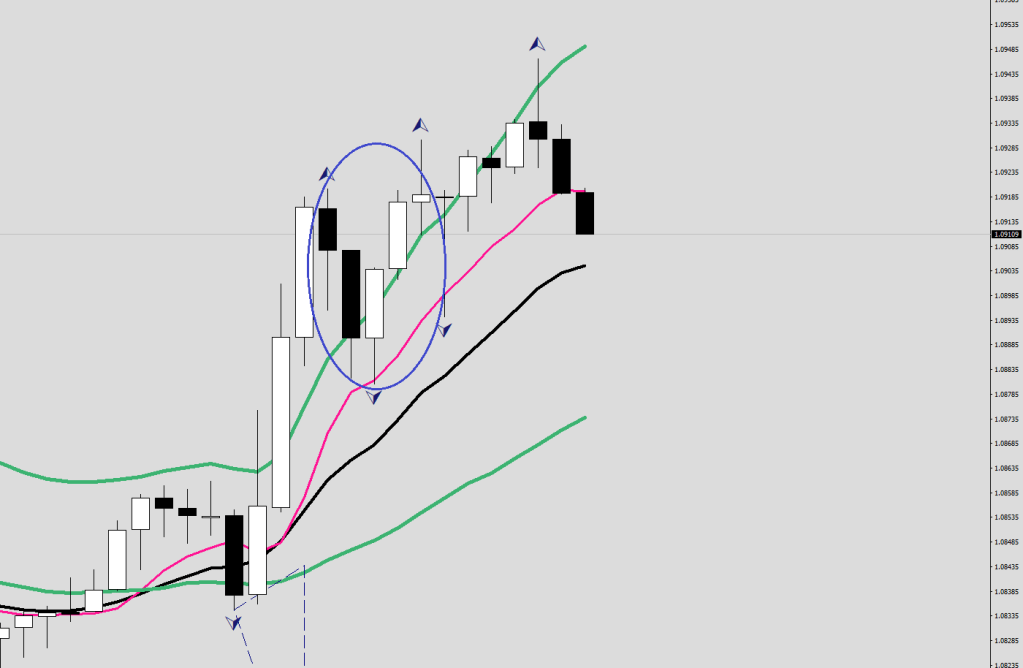
The next image shows the shift up from 2 to 3.
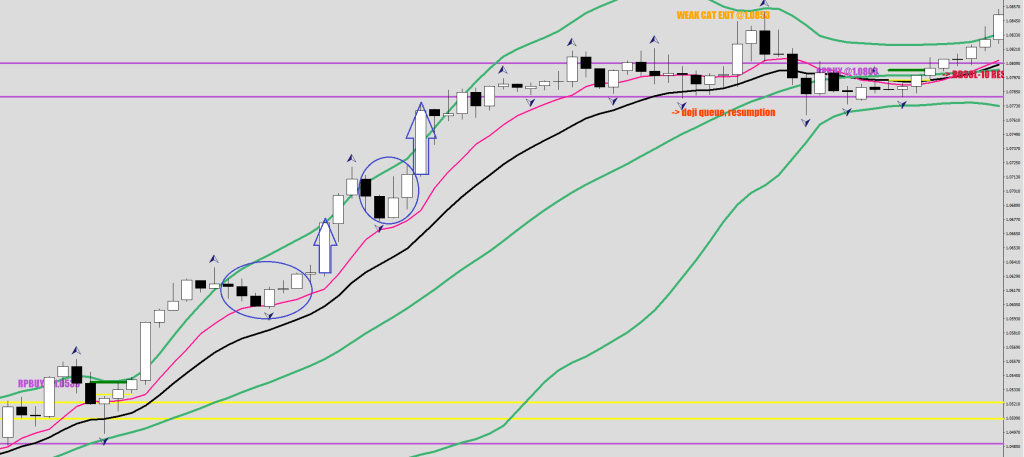
The image below shows the exit for the catastrophic market: the cluster of hourly professional block-size prints where they offloaded their longs.
This is Wave 4 that should make it to the E-9 daily and the lower Guard Rail (extra 50-60 pips from the E-9 band) before resuming with a Wave 5.
(voice of Jon Anderson)
Lyrics
Never going to get supplied The supply chain has gone offline Never going to get the price For sale does not mean You’d get a deal It is not the inflation that’s gone down It is the rate of change With certainty there are only two things You can say: Life & buying power are going away [Chorus] Shorting bread Hoarding fat By the time I start losing weight You would already be dead Quoted what Matthew Broderick Of wall street had said Certainly, you can hope for a better pay Wishing upon a pie If only roast pigeons could fly A lumberjack starts pulling on a thread All out of OJ, in need of Cofee & Beans For the Lean Hog Gotta beef up the production of Soy Beans That’s his crude idea for a portfolio of Comodities It is not the inflation that’s gone down It is the rate of change
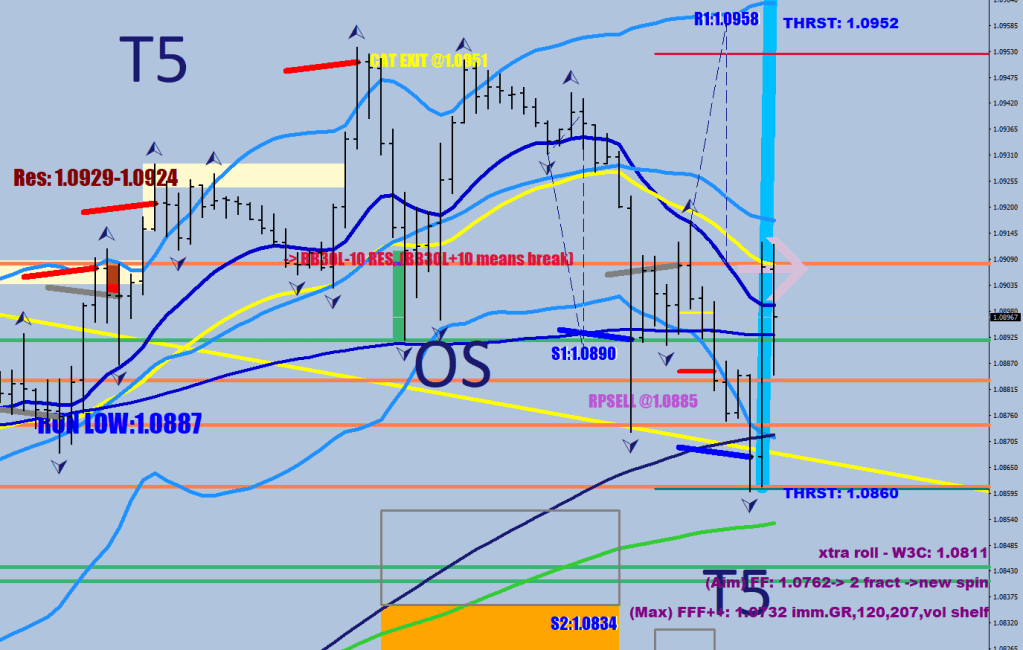
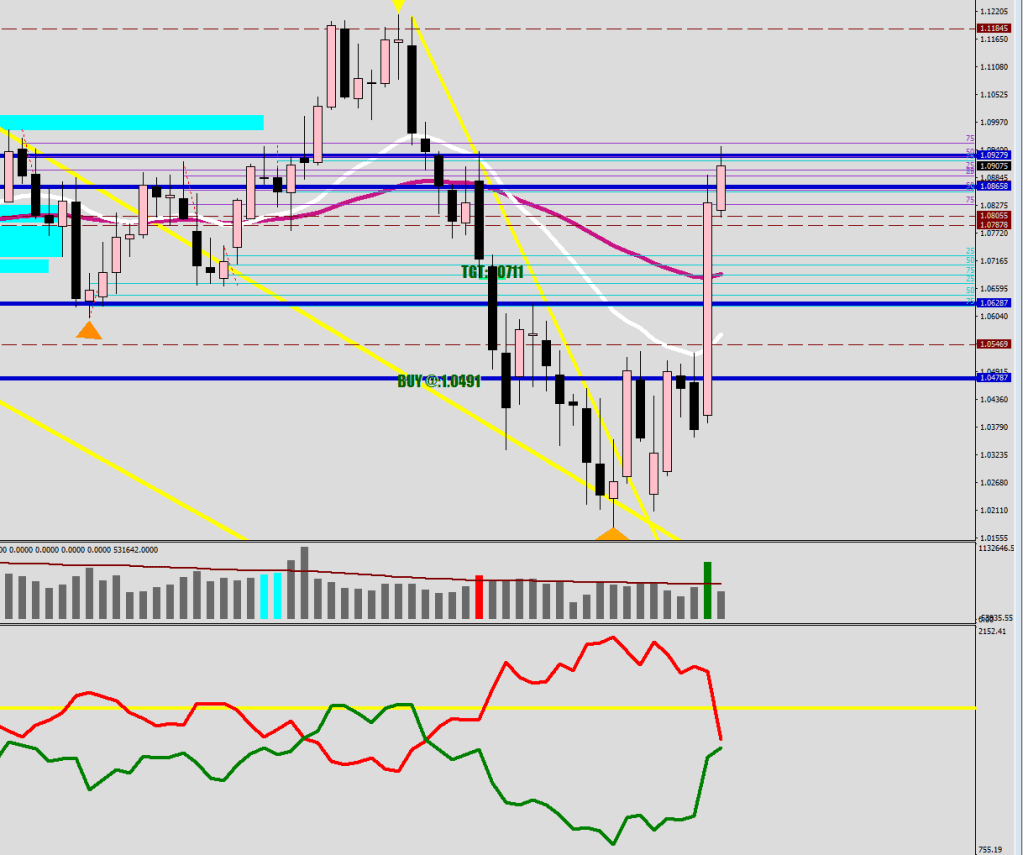
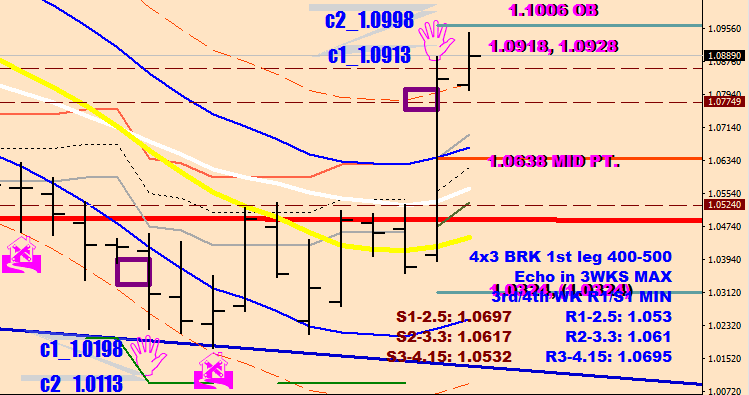
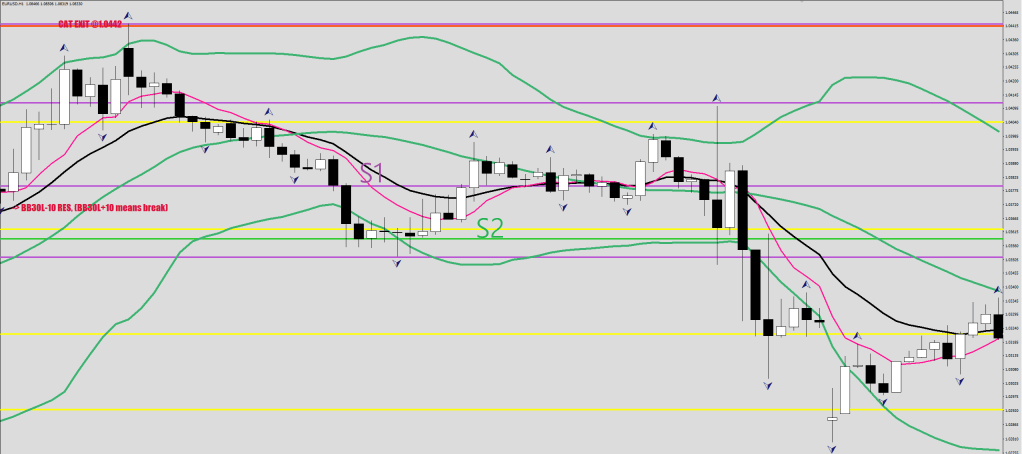
The first red line/resistance level was hit (swing high’s 25%) at 1.0941.
My main problem is that the high does not seem to be finished.
On the bottom, you had a Gray divergence.
Now, you have a fan, but the last one is Yellow, and I find a problem. You must go long when a yellow divergence like this gets taken out.
My most interesting picture is coming up next.
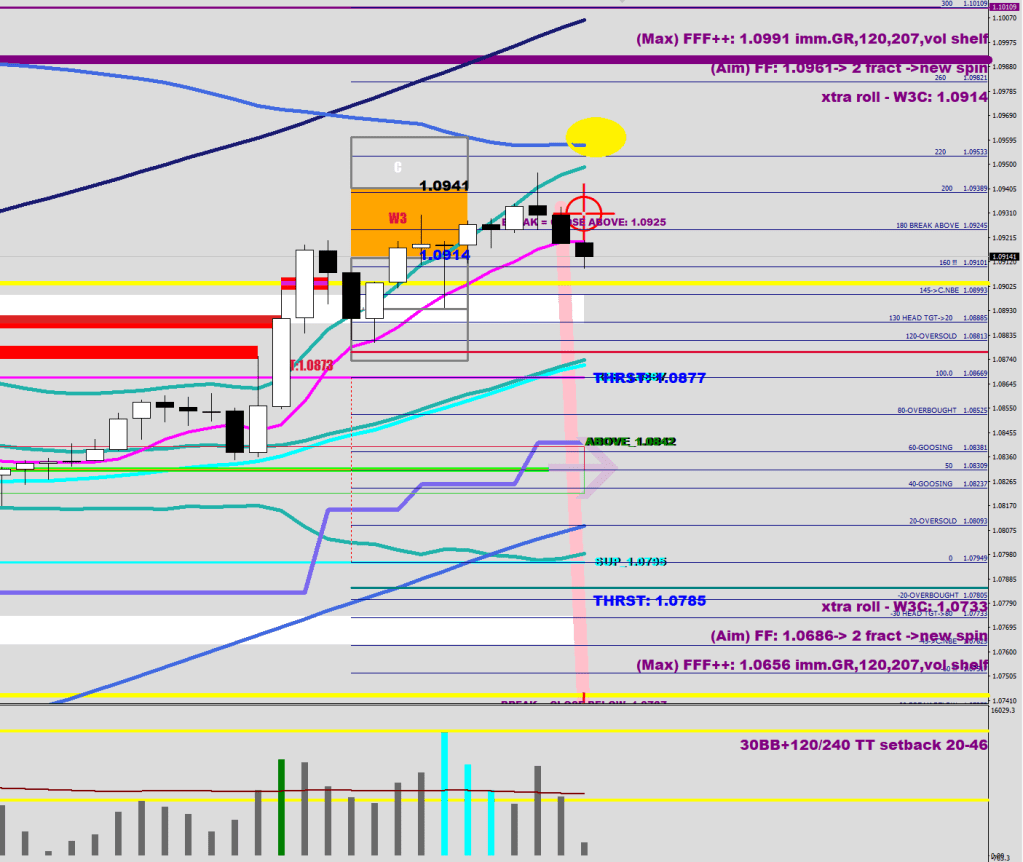
The 200-sample weekly volatility.
Can you see how the high voltage wires have almost touched? By the way, the last time they kissed was that black doji we had just pierced into the body of.
The V bottom made a support level (bottom of the yellow V), which was pushed lower by today’s turn around low, and then re-approached, but the damage is questionable. We have not been able to get inside that major long cover wick circled, despite of going outside the BB and thus making an S2.
A pro volume daily candle, but the Money flow becomes too oversold on a short term basis.
We are in the echo move, but it does not have to finish this week, and could certainly get closer to 1.10.
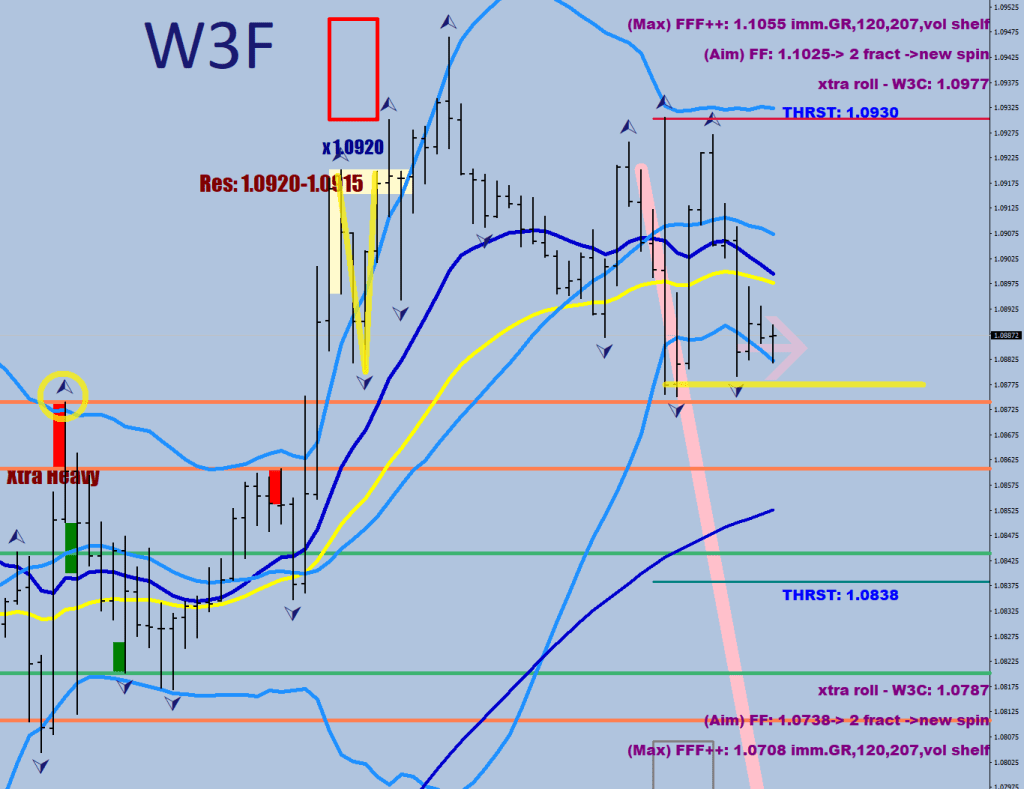
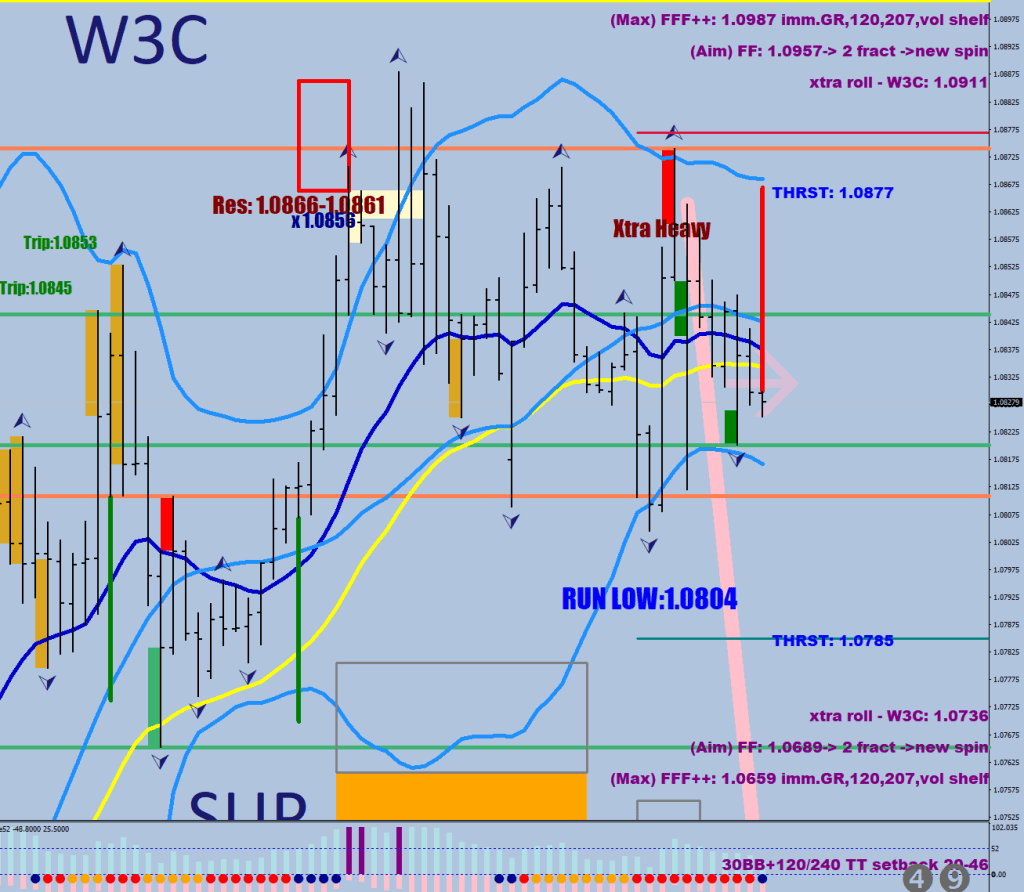
There are V bottoms printing at or before the 8 EMO. In the two ovals, the down leg (3 or 2 black candles) gets exceeded on a closing basis by the up leg (3 or 2 white candles) preceding an explosive move up. This kind of a burst talks about a Wave 3.
A Wave 5 can muster the V bottom as well, but the follow up would not be quite as enthusiastic.
With that said, I am looking for a 3rd and final pullback to the end of trend, a catastrophic exit with no stochastic bar associated. That eggyolk.
So, as projected, a new S1 was made by the lower BB, but no close below since.
The arrow shows where they broke the Rat Poison pattern back up.
The big question is what are the pros doing currently. I do not think that they are selling.
Based on squaring wicks, the market maker first covered their longs, then their shorts twice. They must be neutral to net long.
There are those two red volume blocks above that were left at the end of abruptly terminated high volume churns (green volume bars) to the upside (more orders to be had).
All in all, it looks to be a distribution, but since they don’t seem to care for making an S2, I would think that they want to lift price out of this range on the upside first.
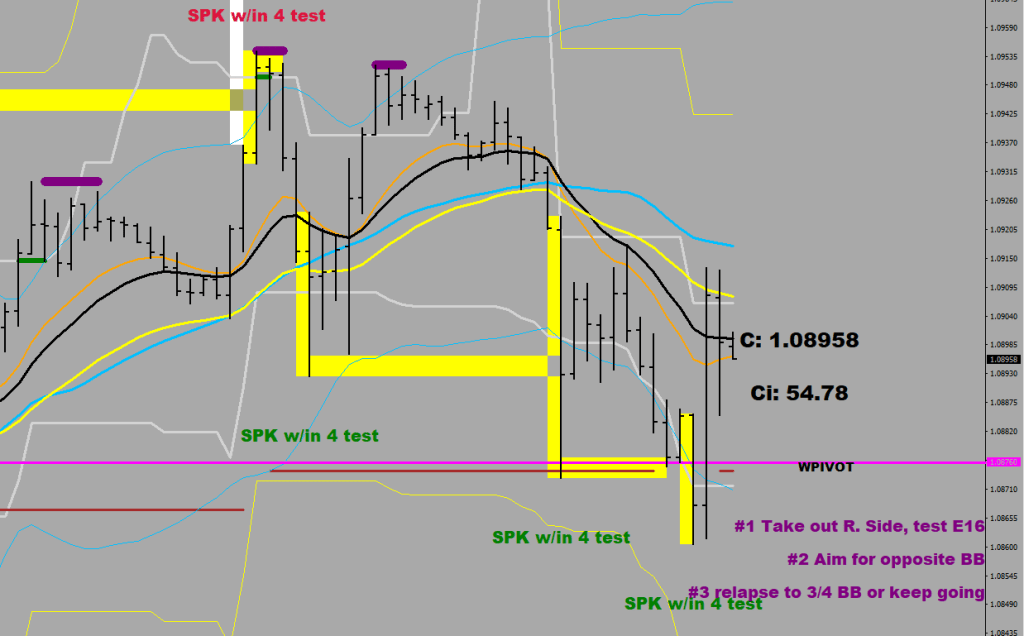
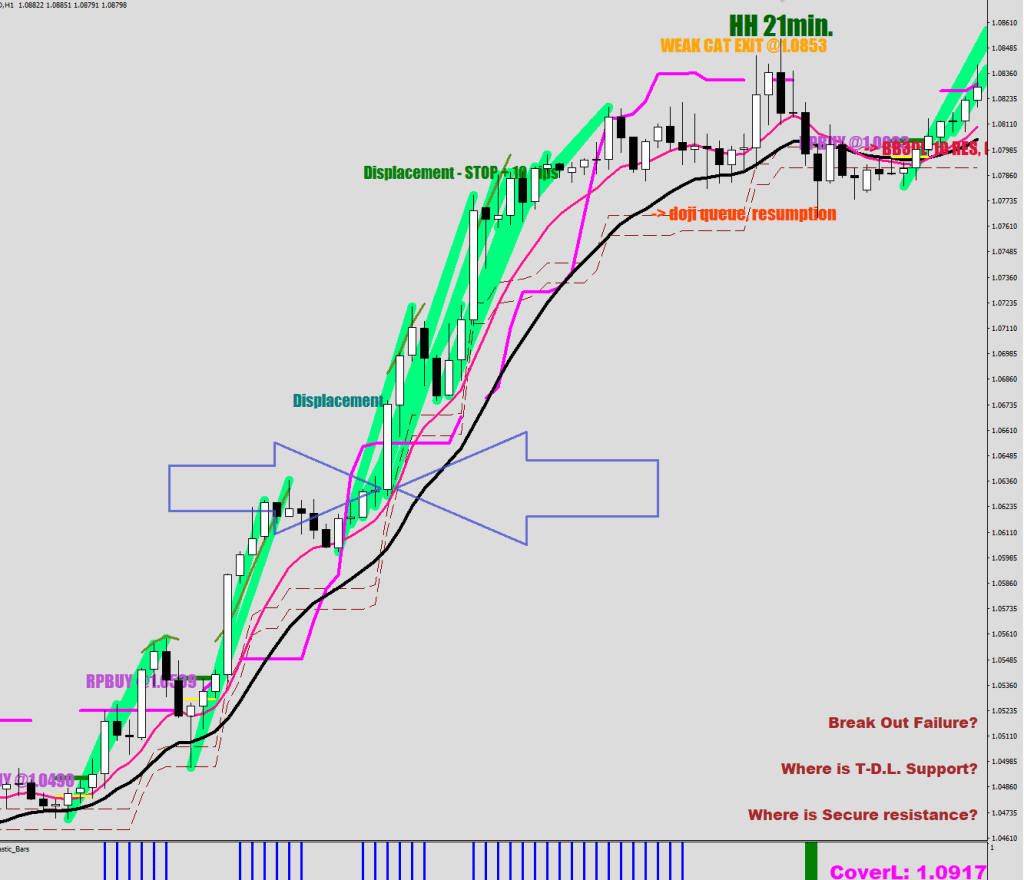
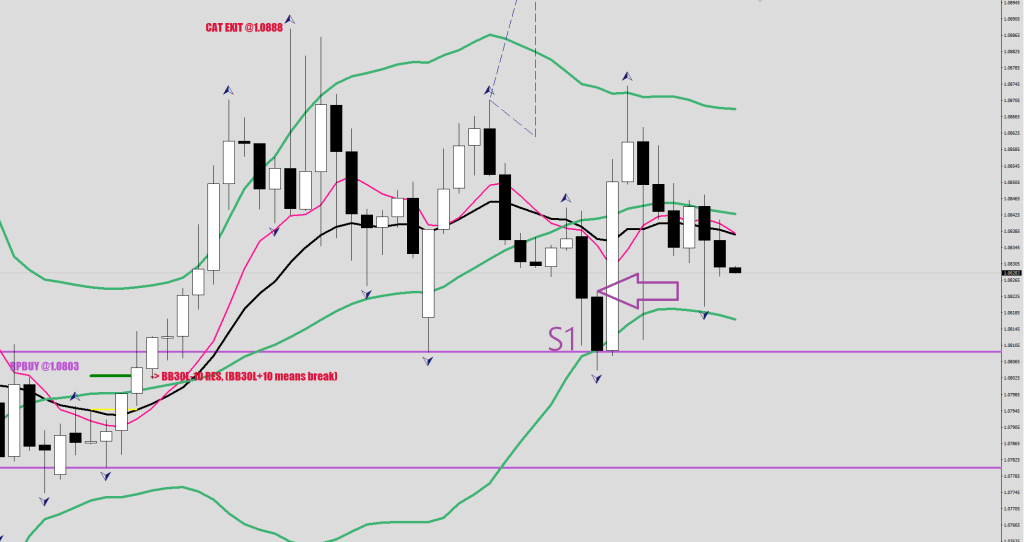
Having printed a catastrophic exit, the market is currently on the quest for making a new S1 level.
You would end up with another purple line, somewhere nearby the 30 sample BB, still on the inside, but within 10 pips of it.
The purple line normally would be placed on the body of the candle, the above picture got adjusted because of the Weak Cat Exit (did not poke above the BB on the first divergence), the body of that white is a bit bogus because of the credit spread expansion, so I went with a line that connects all 3 fractal prints.
What happens after the new S1 prints? If the price manages to close beyond the body, the pullback into the range would be a recoil for a future shot fired.
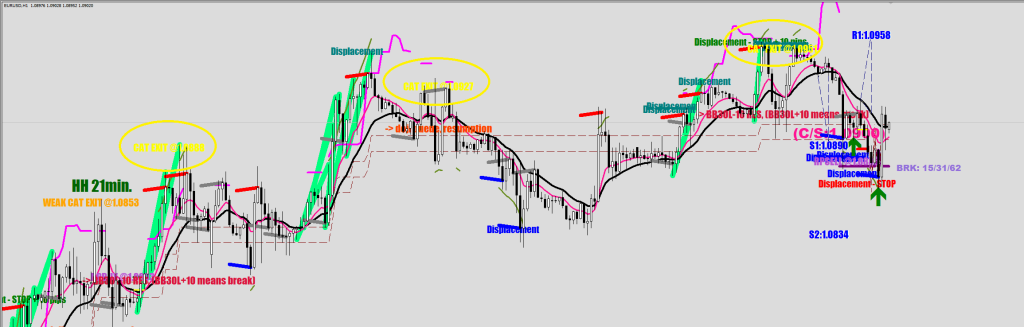
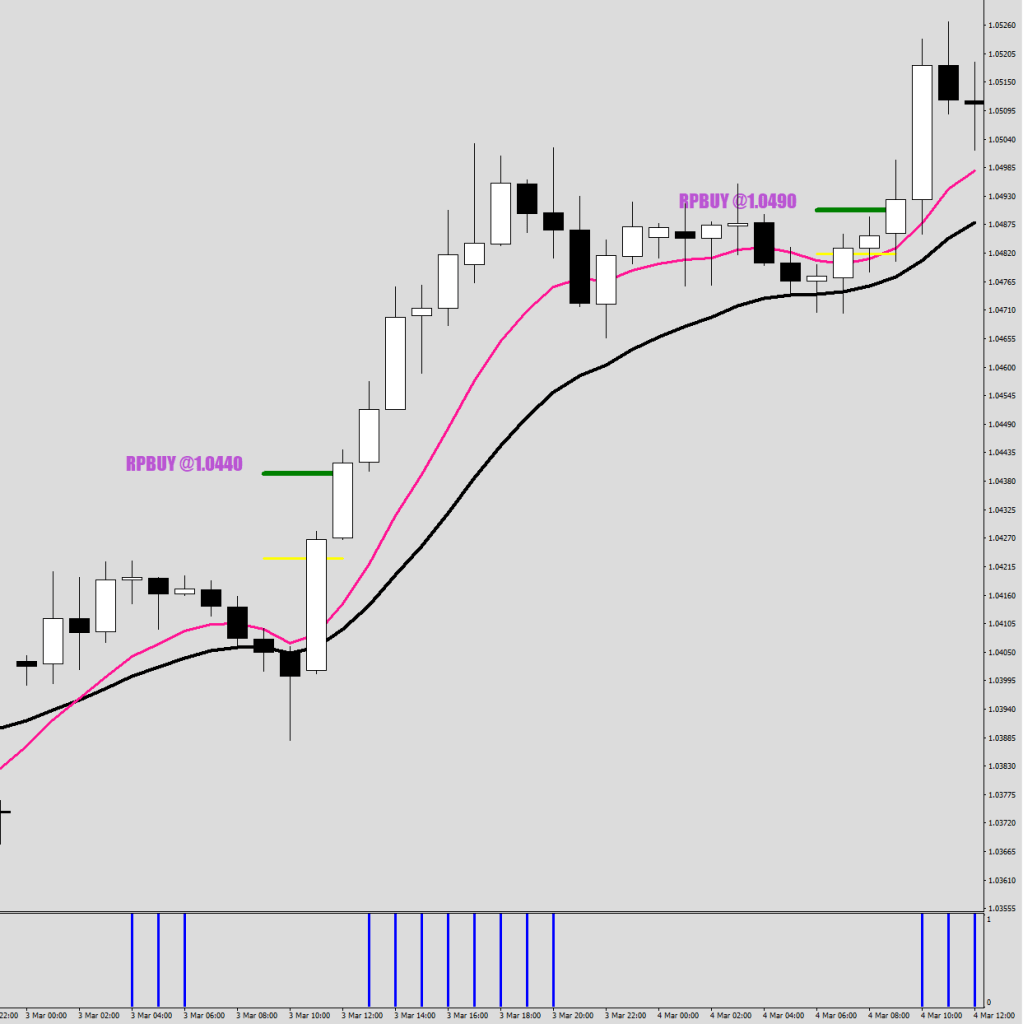
On the image above you can see that the R1 gets closed above, and then there is a pullback before the bigger run. As soon as R1 gets exceeded again, you see an acceleration to the other BB.
An R2 in red color gets printed with a candle achieving 10 pips+ outside the BB. In this case it pretty much coincided with an earlier R1 print. The rat poison was taken, and all resistances got dealt with for good.
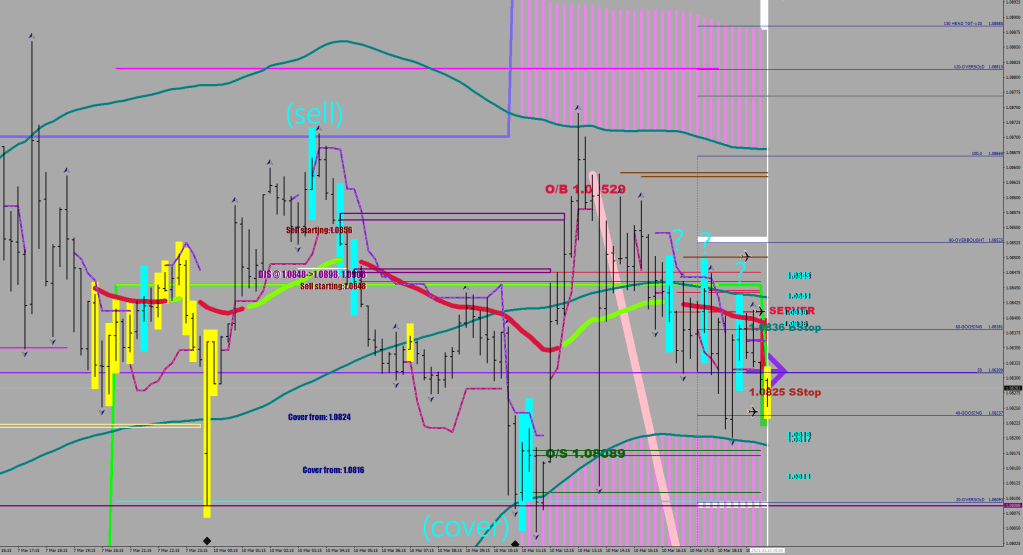
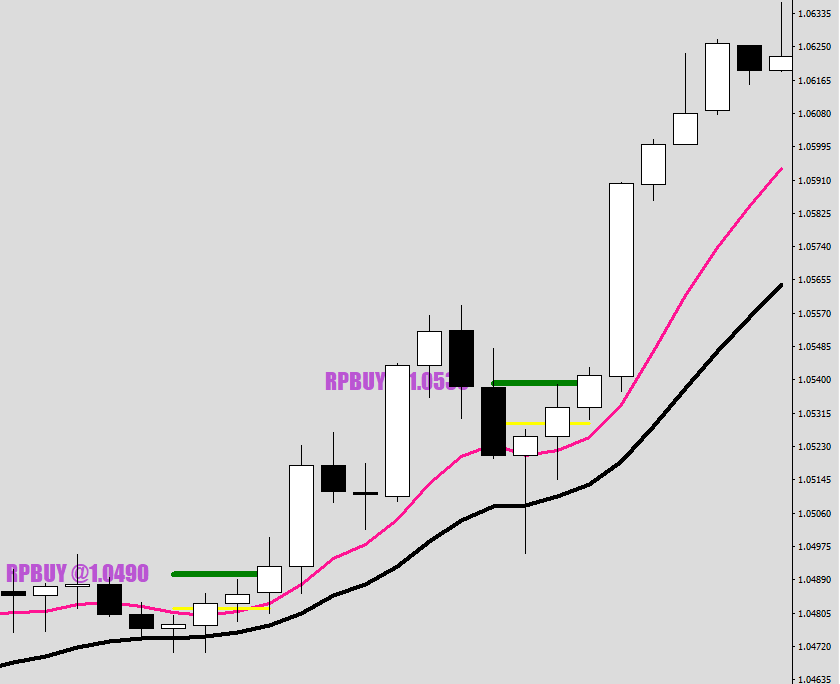
Now let’s see an example of coming back down. This failure on the upside was about a 3x test of a level at 1.0522, and so the price is going back into a prior range.
The price made an S1 in the second hour, it broke it, it never made a new S2 (did not pull away from the BB by 10 pips), made two backtests of the S1 and then broke back inside the prior range targeting the other end of it (cat exit).
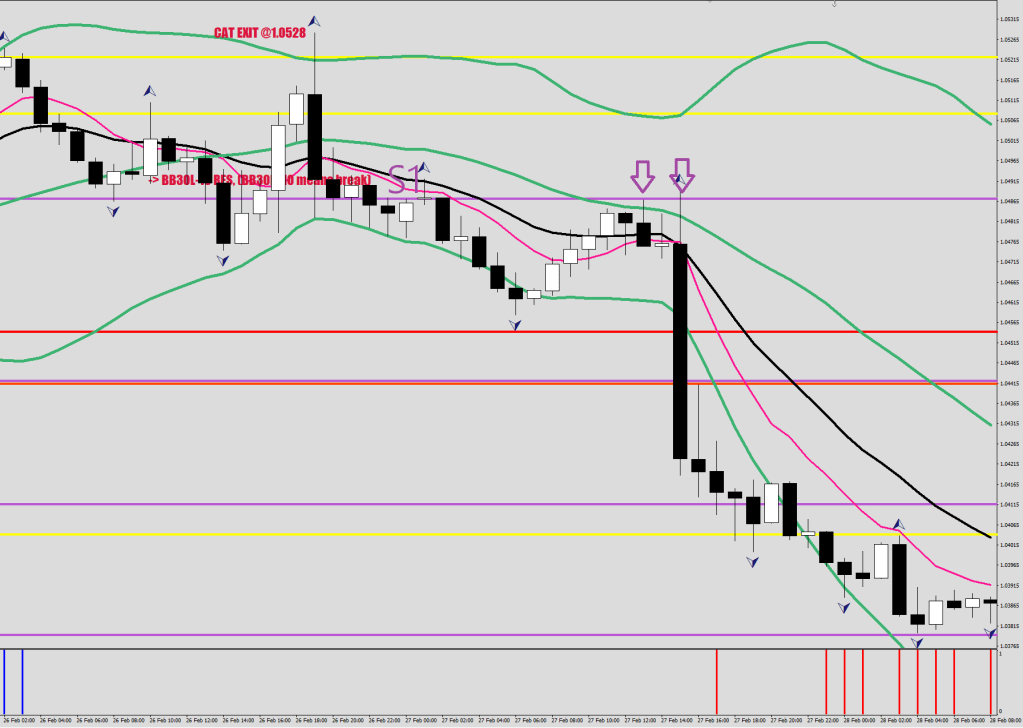
Now, let’s look at another one that may be closer to what is about to happen here.
A print & break of S1 followed by an S2 stall out. A reach back for liquidity: can you spot it just above the first fractal up on the way down?
Also, after the 3rd hourly fractal print on the downside you had to go long.
You see, these 3 moving averages are more of question marks.
A sustainable new directional move is decided in the thick of things. If they don’t get approval up front, the loose move will reverse itself from the neighborhood of the 30BB.
A move never starts away from the E-16. A stochastic bar miss is a neutralizer, a call for repeating question 1.
I must say it was very beneficial having to think about the filters.
With the Catastrophic Exits (stochastic bars) I had to allow for an extra bar displacement from the fractal.
if (High[i]>=iHigh(symbol,0,iHighest(symbol,0,MODE_HIGH,20,i)) &&
 i>0 && iFractals(symbol,0,MODE_UPPER,i) && ExtMapBuffer3[i]==EMPTY_VALUE && ExtMapBuffer3[i-1]==EMPTY_VALUE){
    j=i+2;
    while (j<i+30){
      if (iFractals(symbol,0,MODE_UPPER,j) && (ExtMapBuffer3[j]!=EMPTY_VALUE || ExtMapBuffer3[j-1]!=EMPTY_VALUE)) break;
      j++;
    }
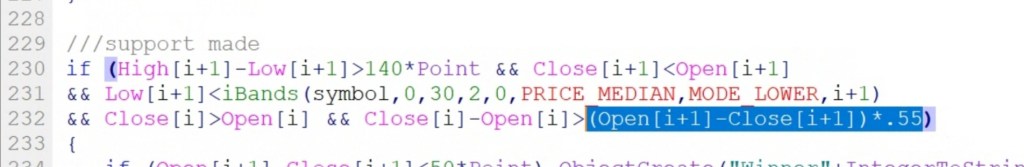
With the Rat Poison buys, I had to become conscious about the Tres Insoldati Spaciren pattern, the need for the low to be sticking out, the higher lows et cetera.
This is no longer a subjective feel. I had to weed out sudden range expansions and have a minimum size set for the starting lower wick.
If you can tell me why was the last hourly candle was a sell signal, we could start a conversation about a joint signal providing service as long as you are Ok with Macdulio’s Rat Poison Trading for a company name. What just happened here?
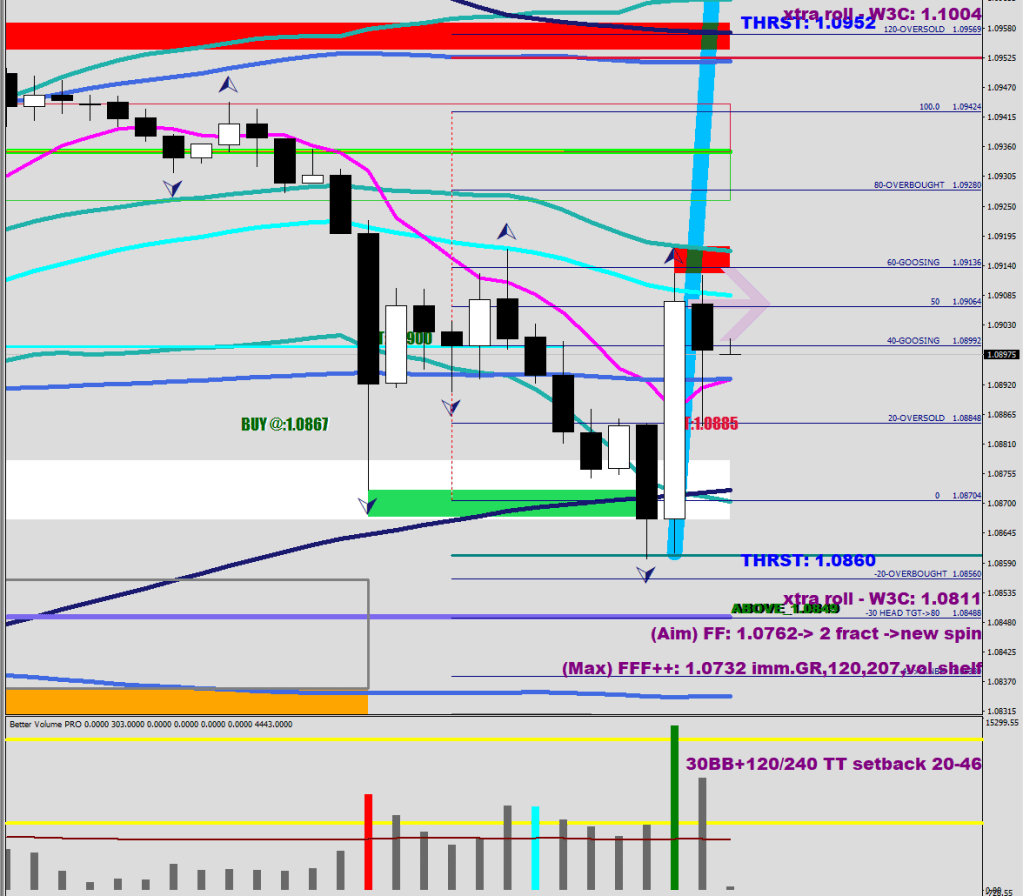
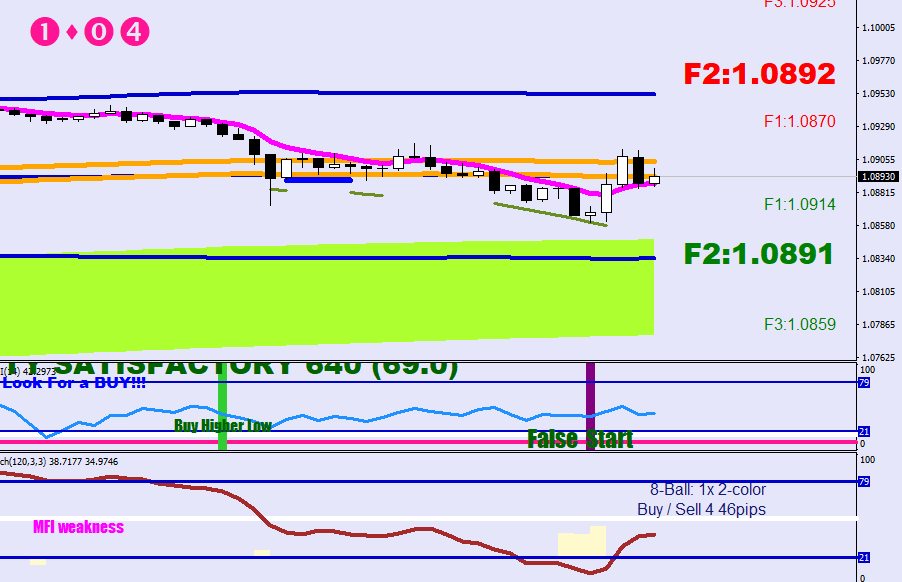
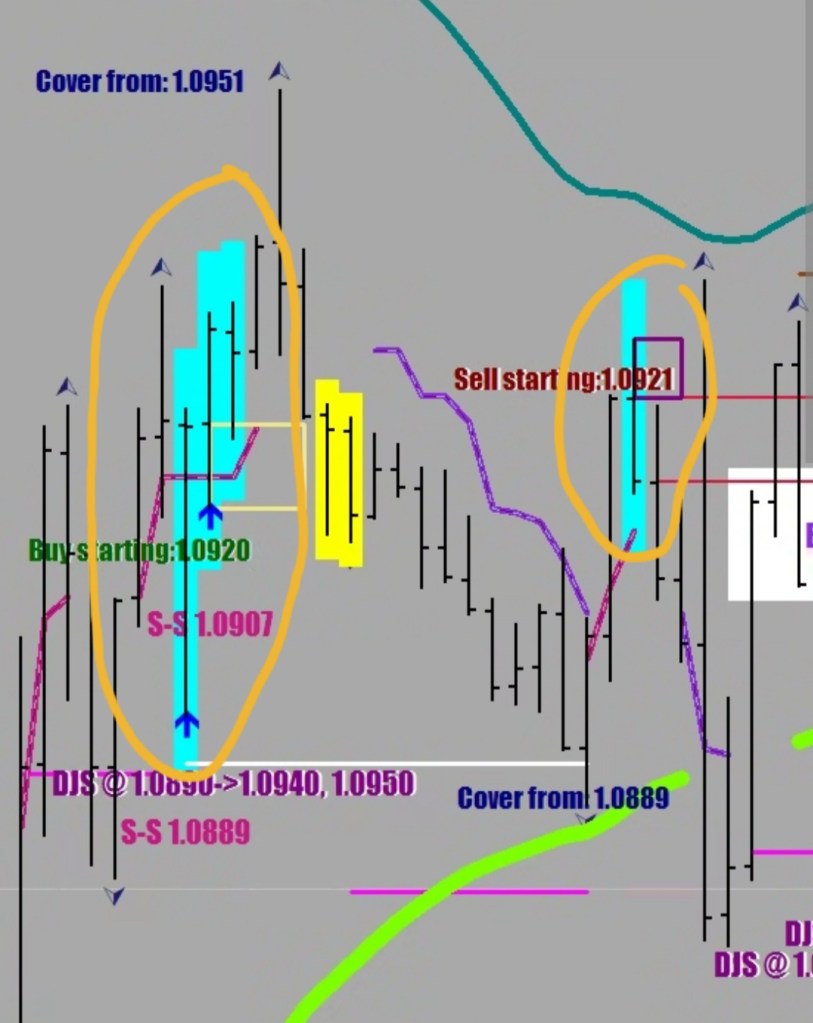
Cyans are professional volume. Yellows are amateurs.
The BB is in a squeeze. You may be looking at the short leg up.
The Cyan in the dense yellow block was probably a close of shorts.
The amateurs were going short right above support – wrong footed.
The next cyan was clearly a buy, as price has been rallying since.
The last cyan I would think was a long cover. As you could see on the downside, this may not be the mark of the high, the amateurs can push this higher until they run out of money.
There is such thing as aiding the break out, but this is not that close to thr high and it was a single print.
credits to Barry Taylor for the Better Volume indicator.