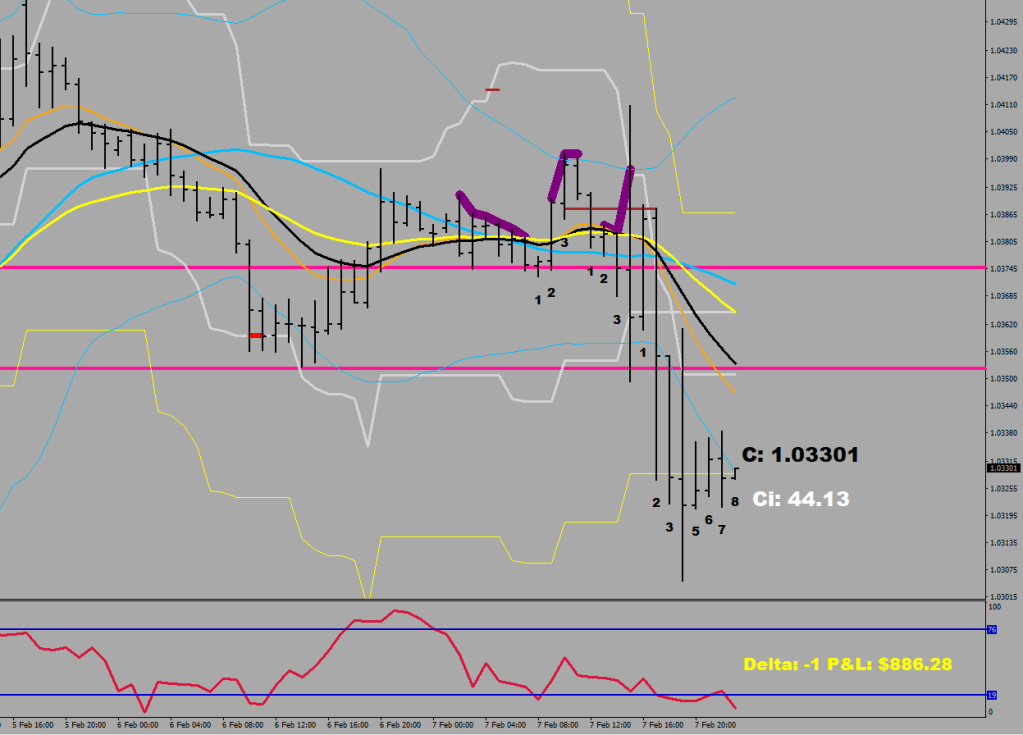
Imagine the following:
if there is a 10+ pip increment hour on the hour and the next candle makes additional gain beyond, we take it as proof for existing momentum, if it falls short we dub it a spike.

if (i>0 && High[i]==iHigh(symbol,0,iHighest(symbol,0,MODE_HIGH,14,i)) &&
      High[i+1]>High[i+2]+130*Point && High[i]<High[i+1]+130*Point && High[i]>High[i+1] && Low[i+1]>iMA(symbol,0,8,0,MODE_EMA,PRICE_OPEN,i+1)
      ) {counter=1;
        ObjectCreate("Countessz"+i,OBJ_TEXT, 0, Time[i], High[i]+70*Point);
             ObjectSetText("Countessz"+i, "MOM", 15, "Arial Black", clrGreen); }


      if (
      i>0 && High[i+1]==iHigh(symbol,0,iHighest(symbol,0,MODE_HIGH,14,i)) &&
      High[i+1]>High[i+2]+130*Point && High[i]<High[i+1]+10*Point && High[i]<High[i+1] && Low[i+1]>iMA(symbol,0,8,0,MODE_EMA,PRICE_OPEN,i+1)
      ) {
        ObjectCreate("Countessz"+i,OBJ_TEXT, 0, Time[i+1], High[i+1]+90*Point);
             ObjectSetText("Countessz"+i, "SPK", 15, "Arial Black", clrCrimson);
             if (Open[i]<Close[i]) ObjectSetText("Countessz"+i, "SPK", 15, "Arial Black", clrYellow);

              }


        if (counter>0 && counter<10){
               ObjectCreate("Countess"+i,OBJ_TEXT, 0, Time[i], Low[i]-30*Point);
               if (counter==9) {ObjectSetText("Countess"+i, IntegerToString(counter,1,0), 15, "Arial Black", clrGreen);
                  if (Low[i]>iLow(symbol,0,iLowest(symbol,0,MODE_LOW,9,i))) ObjectSetText("Countess"+i, IntegerToString(counter,1,0), 15, "Arial Black", clrPaleGreen);}

                  else ObjectSetText("Countess"+i, IntegerToString(counter,1,0), 11, "Arial Black", clrBlack);
               if (counter==9 && (Low[i]<ExtLowerBuffer[i] || Low[i+3]<ExtLowerBuffer[i+3]) && (Low[i]<iBands(symbol,0,30,2,0,PRICE_MEDIAN,MODE_LOWER,i+3) || Low[i]<iBands(symbol,0,30,2,0,PRICE_MEDIAN,MODE_LOWER,i+3))) ObjectSetText("Countess"+i, IntegerToString(counter,1,0), 15, "Arial Black", clrRed);

              if (counter==9 && Close[i]>High[i+9]) {ObjectDelete("Countess"+i);  ObjectCreate("Countess"+i,OBJ_TEXT, 0, Time[i], High[i]+70*Point); ObjectSetText("Countess"+i, IntegerToString(counter,1,0), 15, "Arial Black", clrCrimson);    }
               }

      if (counter>0) counter++;
Album #54, various parodies
“President Evil”
The story of the swamp
With the white house
And the orange-color ogre-hombre
Who drained the house, not the swamp
Ran the University of Bottom Deals
For Bottom Feeders
Any low life could qualify
With a long enough tongue
Rated: perpetraded
And all excuses receive a pardon
Fire-exit smiles for miles
While the frost lady frost bites
President evil,
Snap some necks
Tear out some hearts
Everything is going to hell
In a handbasket
Snap some necks (tear out some hearts)
Immunity against sanity (hand basket)
All going to hell
Lip stick (on the pig) take a ride (on the wild side)
Show bizarre, Cirque du Hooligan
Insecure orders, major disorder

Steal a family crest
Take a ride with Space Force 1
Next up
Tariffs & guitar riffs
Die without shoes
You have always sucked in socks
Don't worry, just be a grateful dead
The pearly white hate
Wide-awaits
Your first cry was a
Bing-bing-bing jackpot sound
The last sound you would hear
Is going to be made by a total wipe-out
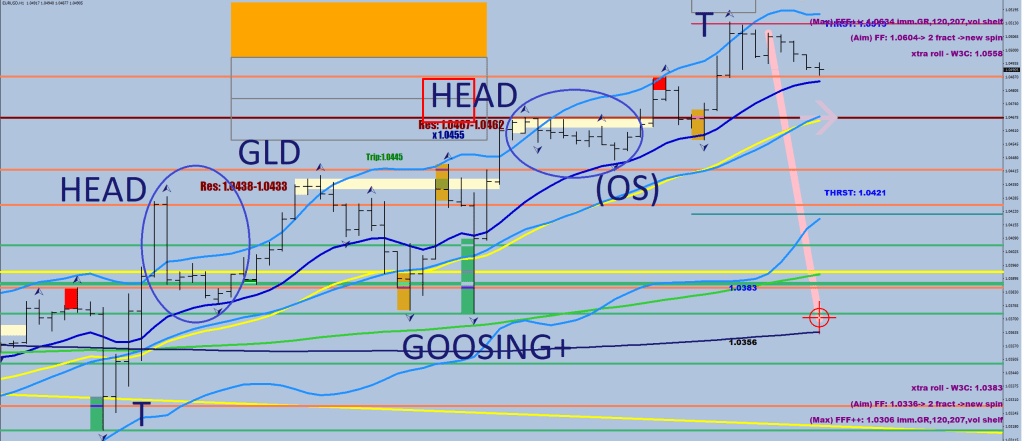
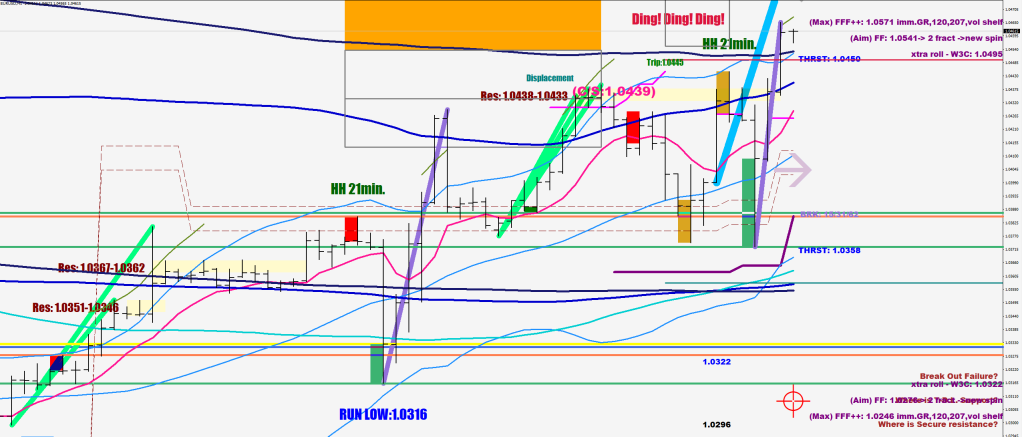
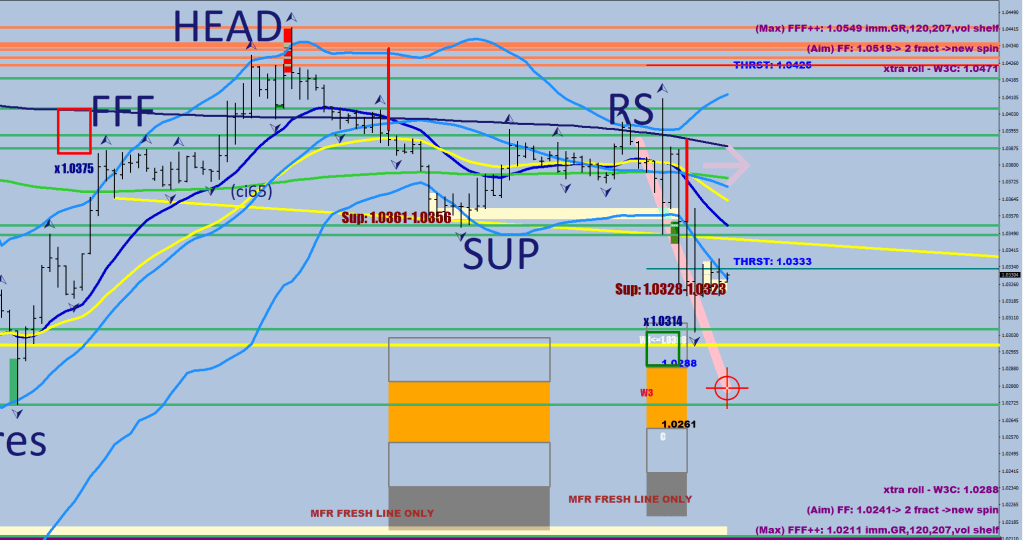
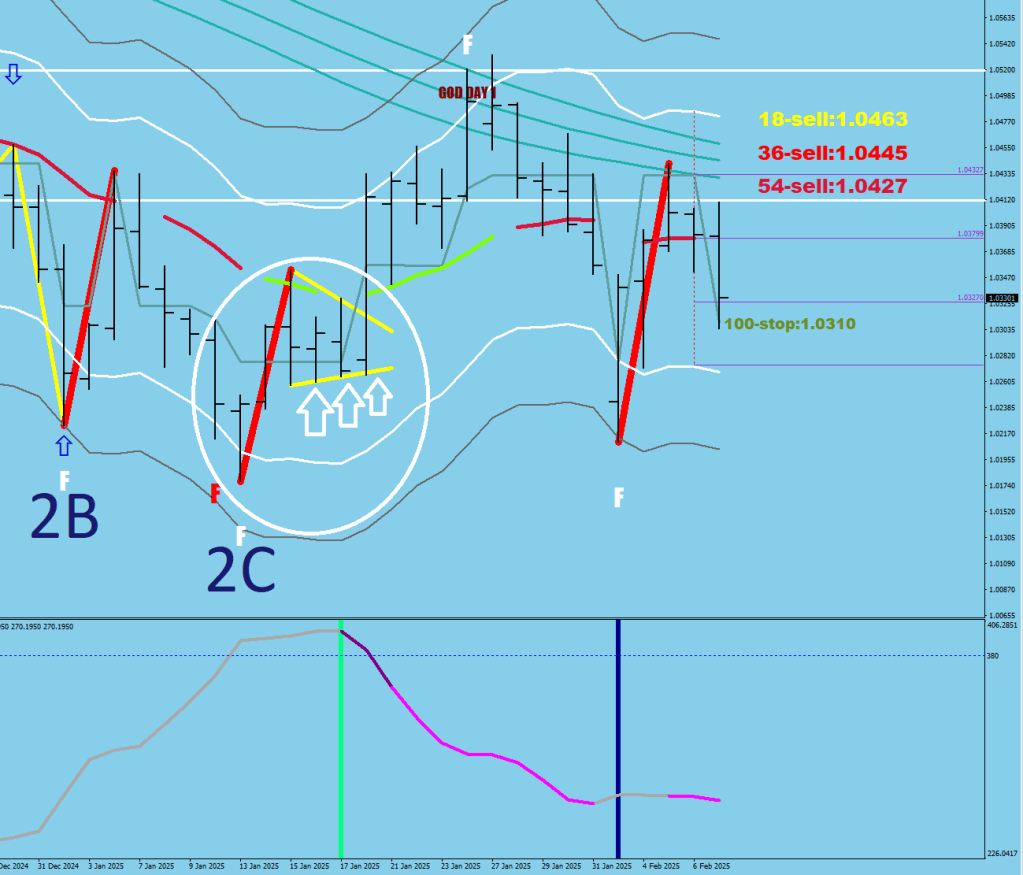
S2=1.0438
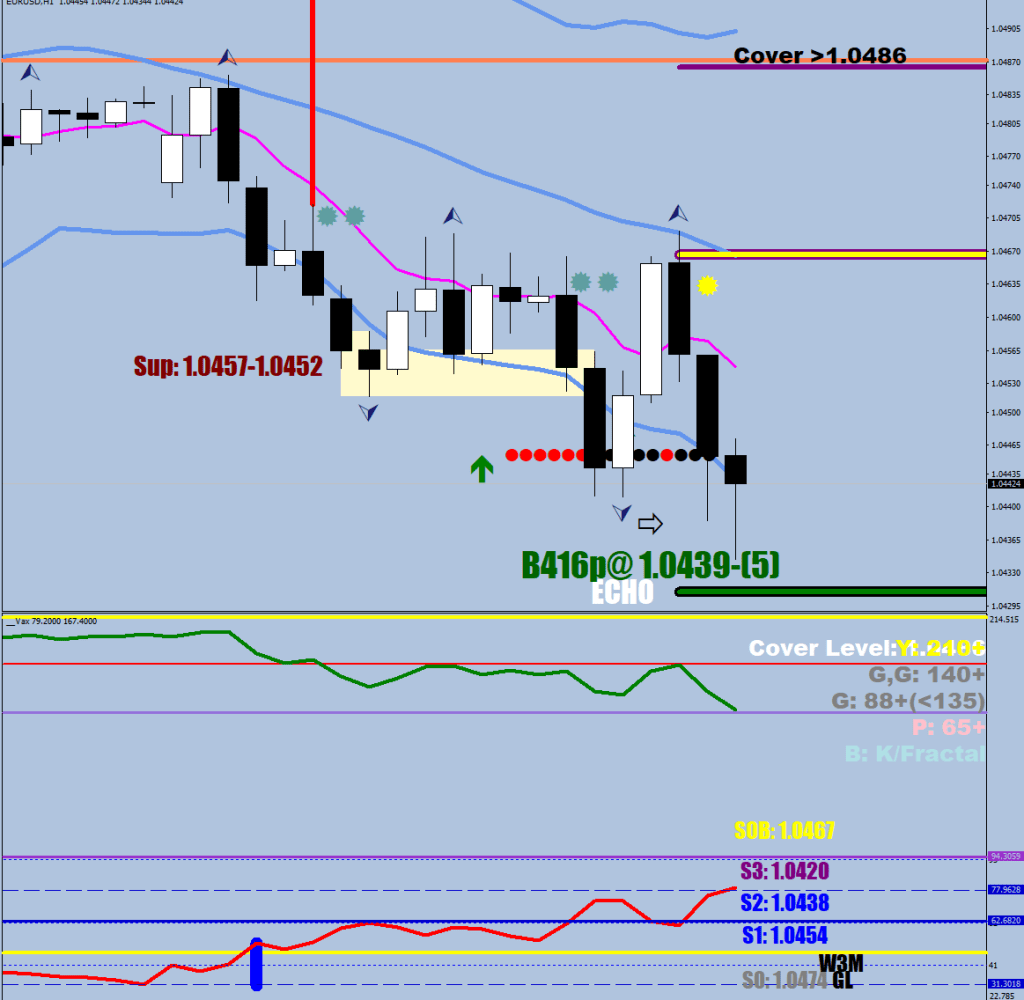
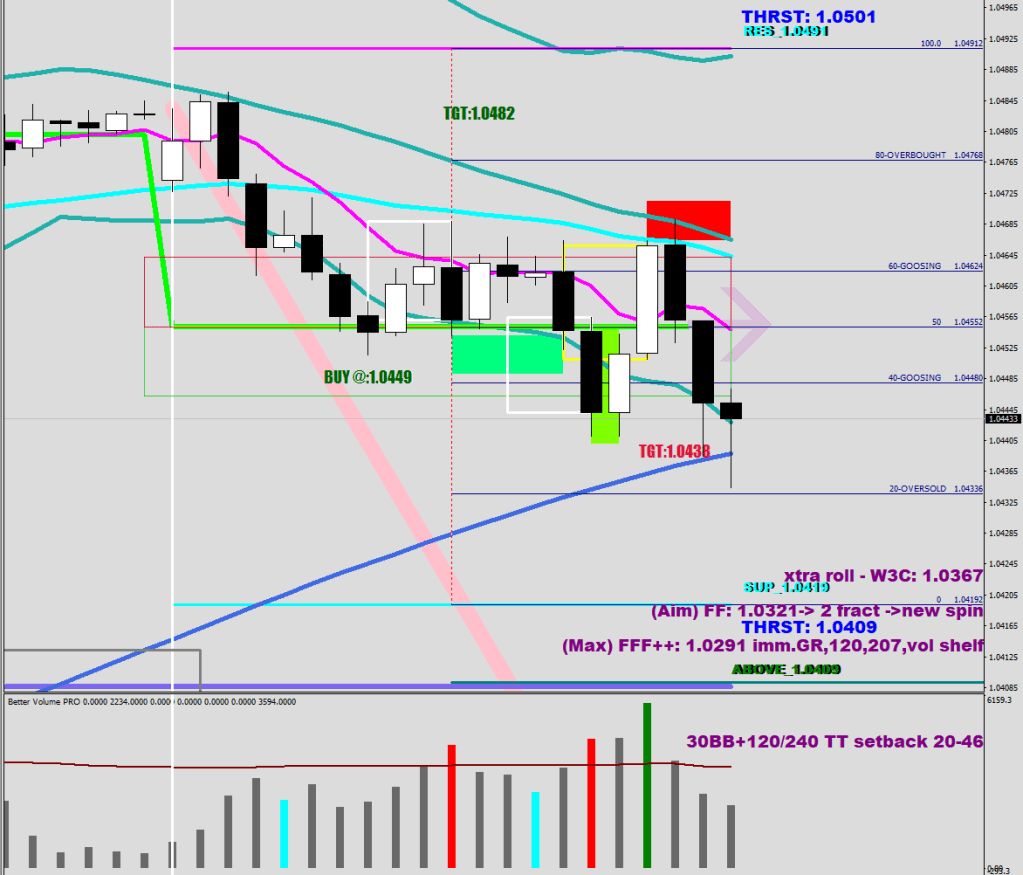
Oversold starts at 1.04336
False start: 120 sample stoch too oversold, money flow too high for a breakdown

Multiple false starts would be a bearish sign, meaning they will not reconsider their desire to take it lower.
Interestingly the bears seem to be gaining momentum.

continuation sell in 7 more hours