3 things to talk about, and they contradict each other a bit.
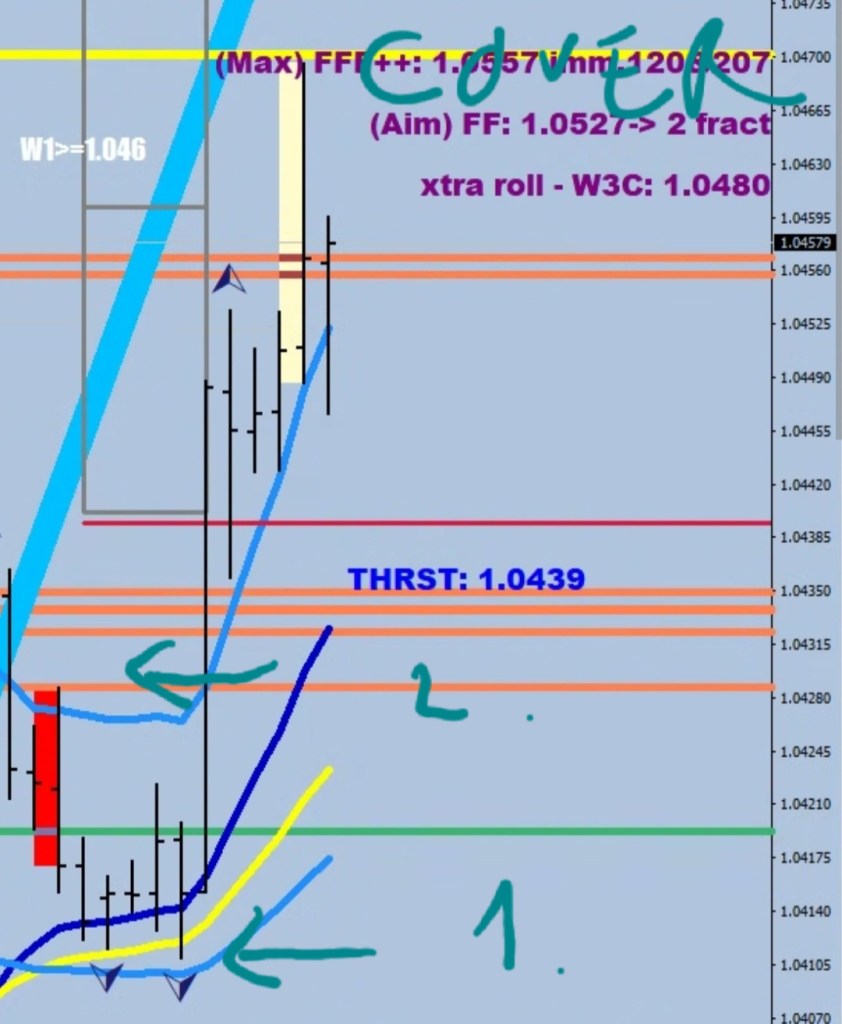
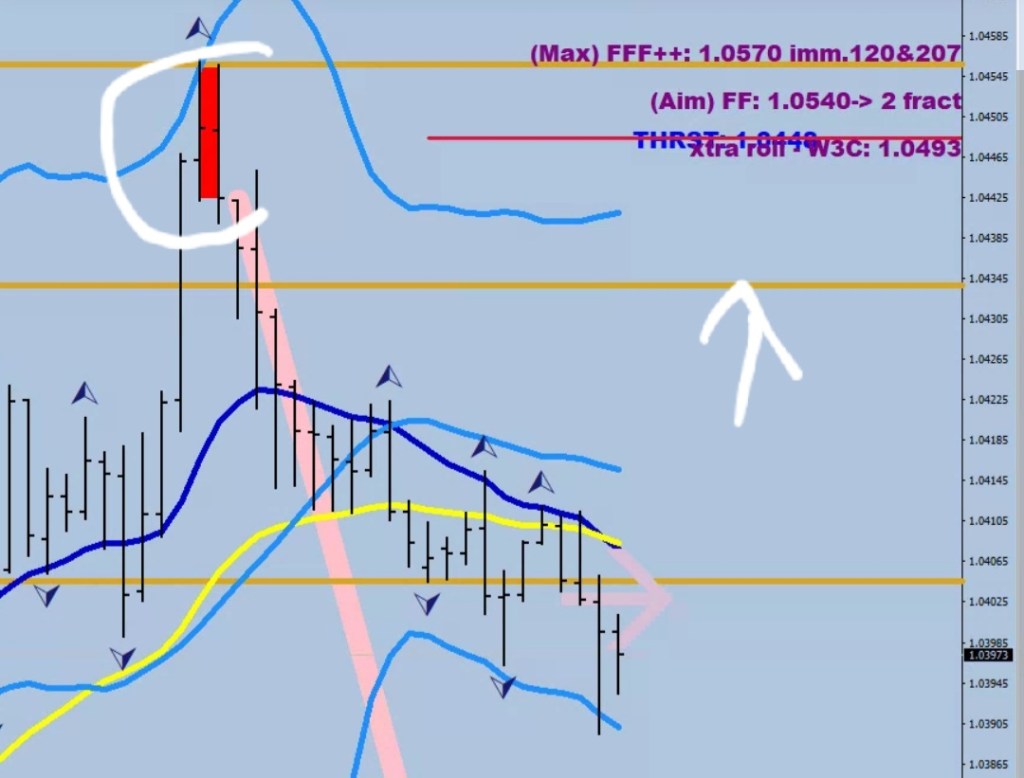
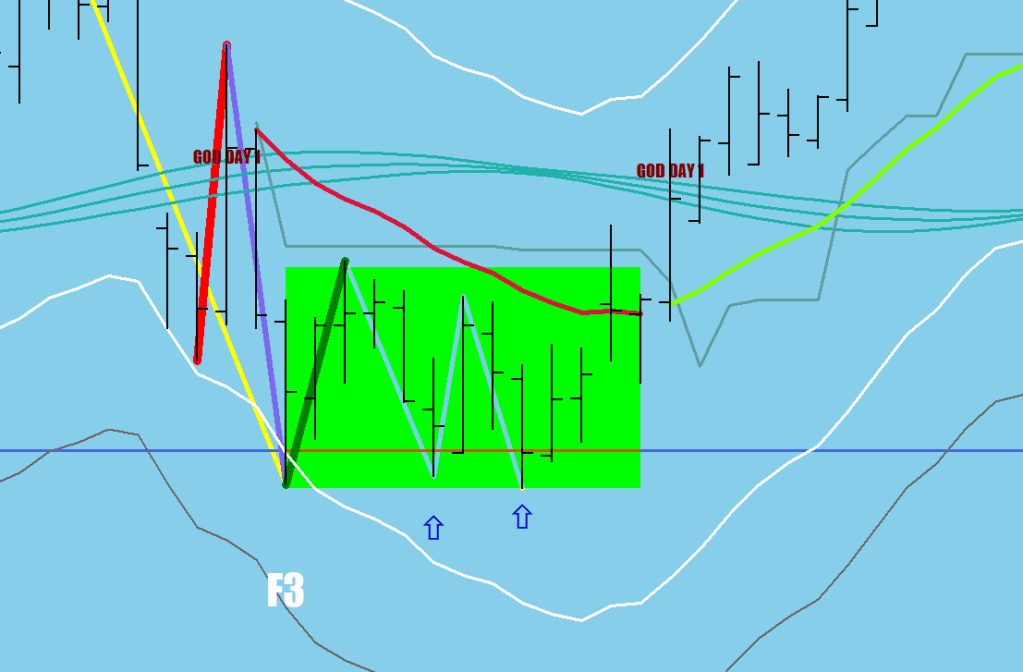
The first thing is the driven thrust sequence. The drive part (acceleration+ HH) was made, but the thrust is missing.
At the same time the market maker has squared the longs (red box).
So, I think the thrust would come from a lower low. In fact, I want to see two hourly fractals on the downside first. Also, the S30 should be exceeded at least.
The current pending fractal would get an override on the open merely by the expanding spread.
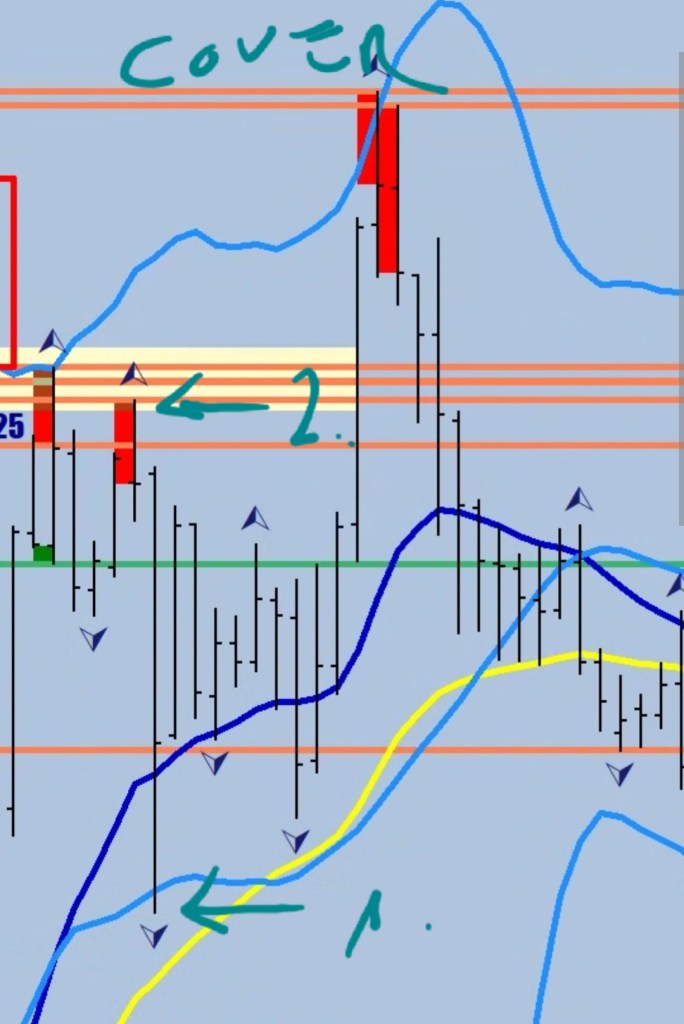
Now, the third interesting thing is again market maker behavior. They did not square the shorts upon the price cracking back inside the BB, which would have acknowledged a prolonged stay in the new zone above the previous high.
In the previous picture, you can see that there were more than 3 candles that formed completely outside the 30 BB. When this happens, normally there would be a crack and square upon re-entry.
Two recent examples:
X marks the crack.
The fourth thing is the F print on the upside. Volatility is still on the decline, putting the low out of reach.
We should see a reaction here, but the most severe kind would not likely get beyond the 3rd line, which is 1.0330 or so.
The 5h thing is Kissing The Ring.
The 6th thing is me writing politically charged lyrics lately for album 50, called Consilium – a sign of times.
From the European Election-Season
From far left to mid right
Torys wearing wigs
Clown carnival with an opening
For a bloodhound running
Mate, you better be quiet from now on
Don't you be cute, I'll put you on a mute
Put up or shut up
Choke on that pear-shaped
Cucumber sandwich
You have tried forking
But I have developed a
Skewer skill, and I intend to stick it

From Dinsdale On The Perk

Moved by an aristocrat
You build a telescope inside
A dark-ass tunnel
To find your own living standard
You would need to probe down
Further with a periscope
Cartoon villains running
The show in this dispensable
Existence

[Chorus]
Oil up and parch
You can already guess that
The refrain is going to be
Oligarch

The climate has gone strange
It seems to be undergoing some
Change
It's wild, these fires
Losing your home -
That's interesting
At least that's the official
Stand
Before the stampede shall commence

[Chorus]
Wishing on a rainbow
You can already guess that
The refrain is going to be
Overthrow
From Transfer Of Power
[Chorus]
Pretty big heap of it
Oh how I wish for it to burn down

Cross bun on the autobahn
It is fortified & endangered
Bone spurs don't disqualify presidents
A new Chapter from Chapelle
Flush it real good
Capital capitulation
Almost on time
Meanwhile at the Capitol
In the Capital there's almost no crime
Pip squeak on a short fuse
On seat C-4 in the stadium
The mood is about to explode
As the power gets transferred
From Ghengis Khan to
Kuk-Lux Khan
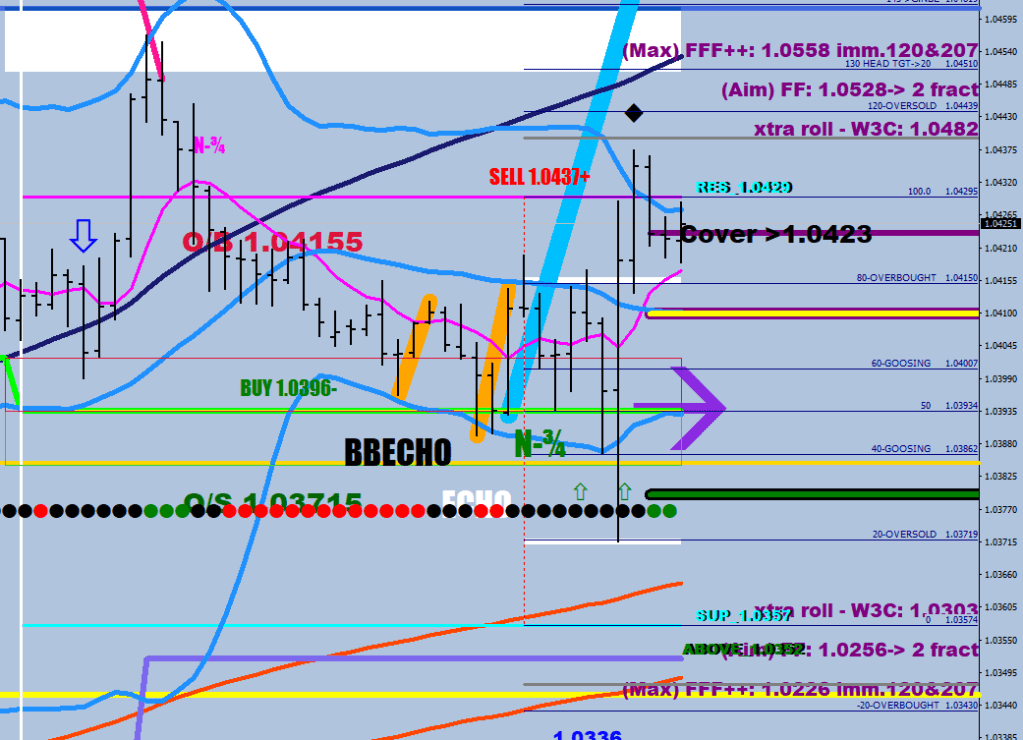
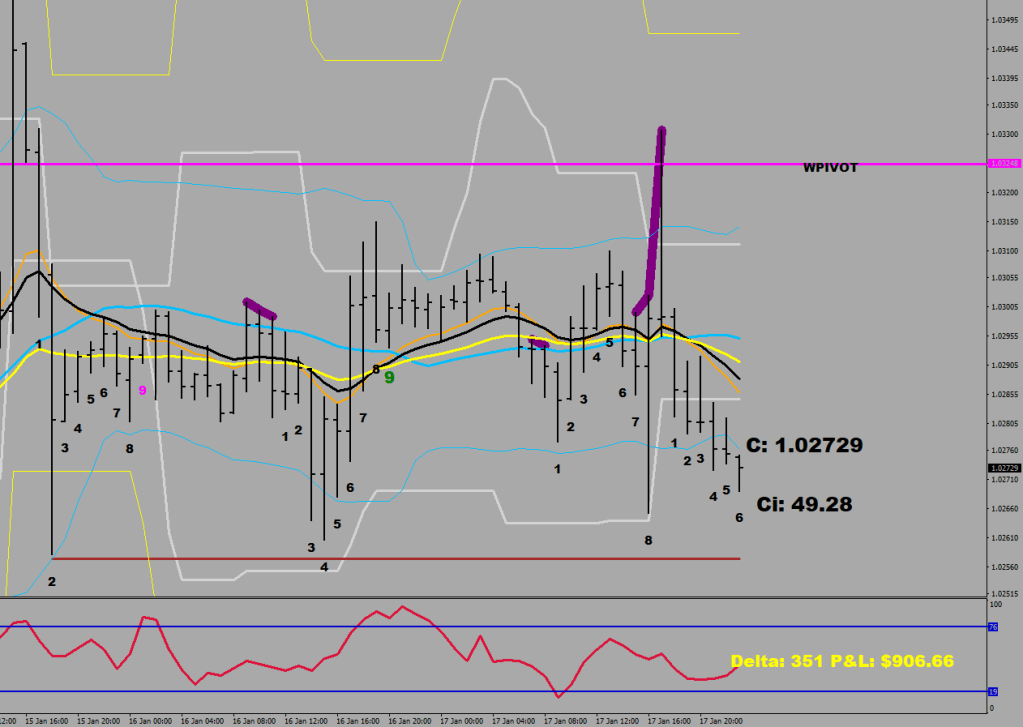
First, about the blue circle. It has been puzzling from the beginning. The market maker was responsible for the gap up. But the blue thing that would be a crack and square is completely out of character for an MM, as they do lift and square when buying. The conclusion is that this was active trading, new money.
Now, with the mindset of market makers reacting and squaring, the initiating moves had to be made by non-MM players. The purple fractals seem to have one thing in common: they utilize those market maker lines that were long squaring prints (coral-colored lines) and they hold their palms out 4-12 pips lower. The traders seem to ignore the green, short squaring lines.
The other conclusion is that a top is missing. The squaring at the recent top made no impression on the pendulum, it was a divergent close to a leg. The MM stronghold would see an overrun since the oversold level was just purchased.
Particularly because of the head and shoulders looks.
If the traders are still interested, they should buy below the 1.0405 line (minus 4-12 pips zone).
The aim could be as high as 1.0528 and with the consolidation mean being moved higher a little extra on top of that.
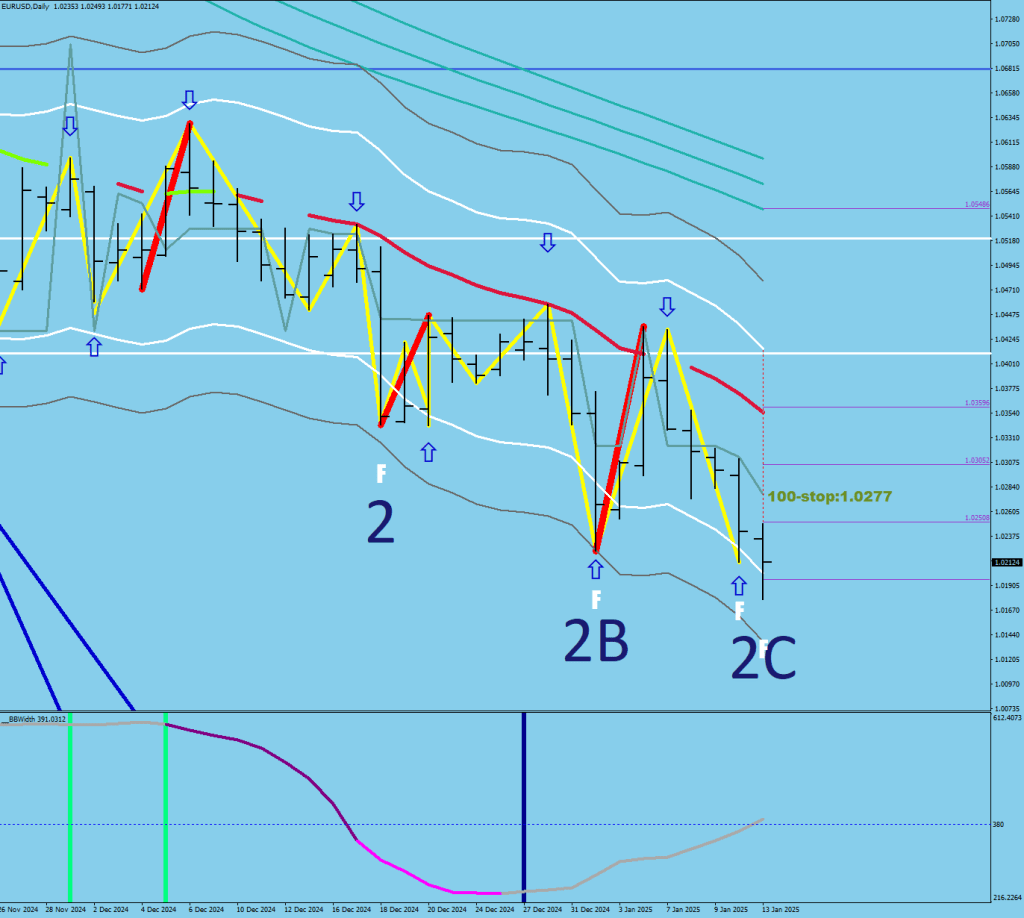
The bottoming sequence was a W3C getting a Support beat after a new consolidation.
I often fall into the trap of faith I put in filters that are not yet settled (if there was no signal no change has transpired attitude). A Money flow overbought peak is not the end on the upside according to my thinking, and a divergence sequence must play out first.
I could not be more wrong. The market maker can use this luck-found pocket of liquidity to square holdings into, thus there would be nothing more to look for on the upside
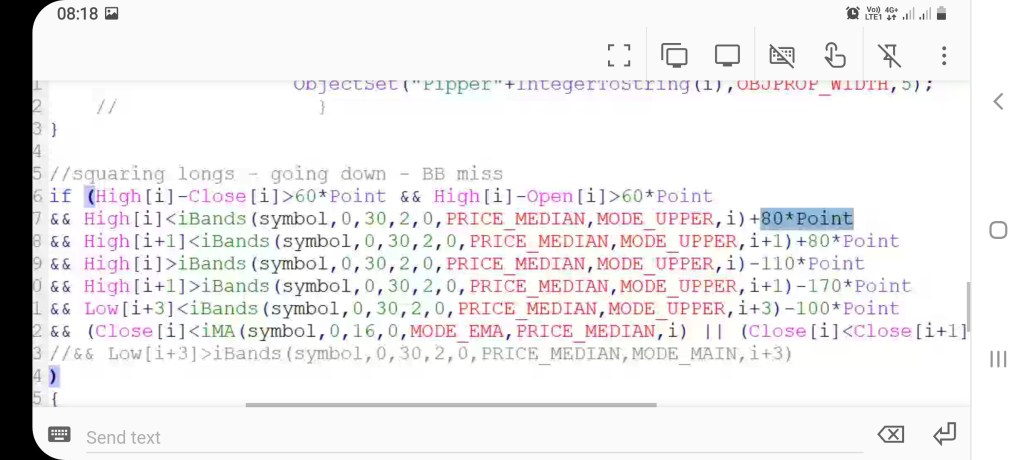
The sane mistake others make with drawing lines thinking any crossing to be a break and they must be repellant, well I commit the sane ctime when I exclude from BB shortfalls where price has gone over the line a bit. So some extra allowance is a must. 8 pips I added.
So I have this coworker reciting mindless sentences like “structure is king”.
The problem with discressionary trading that it has no rules, and it is not replicable. I cannot write a binary code for “I don’t like this long” and which side of the bed you woke up on is not a valid premise.
I chose not to exist in a world of narratives, I don’t like having no definitions for things, I want computers to stay binary. Maybe is not an answer to any question.
Undestanding market making however could make you a king.
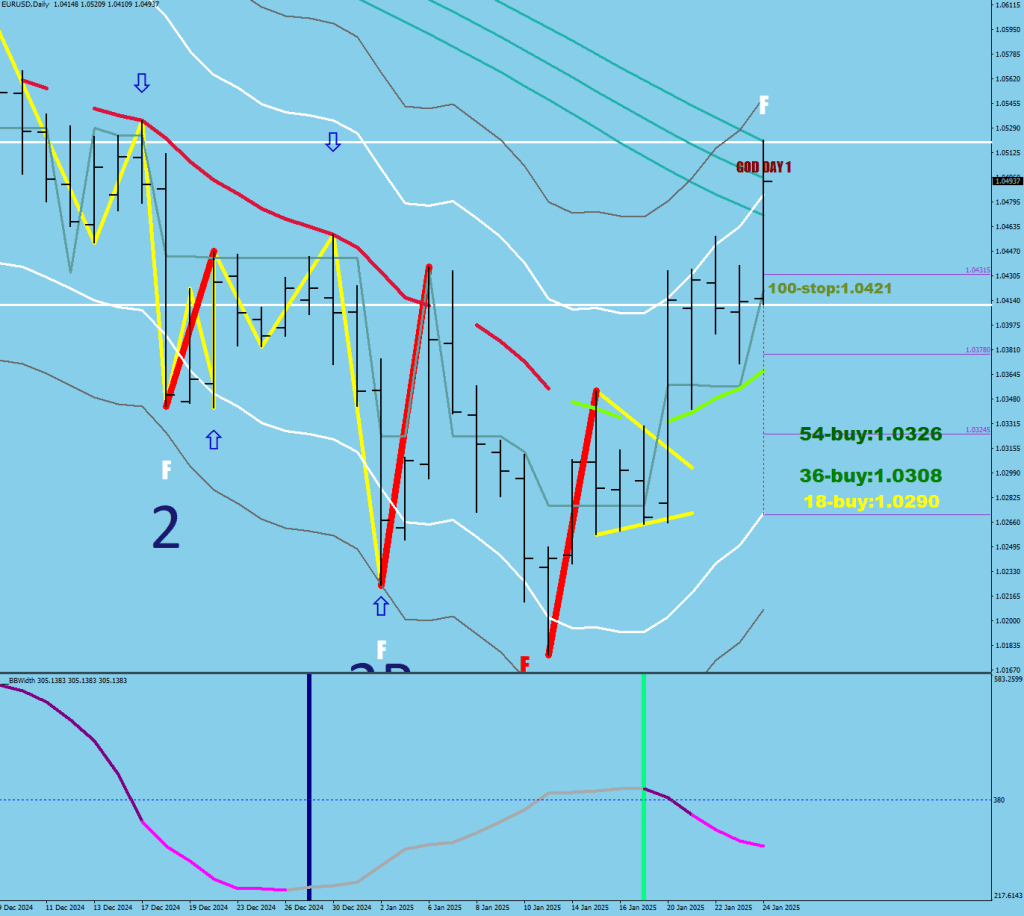
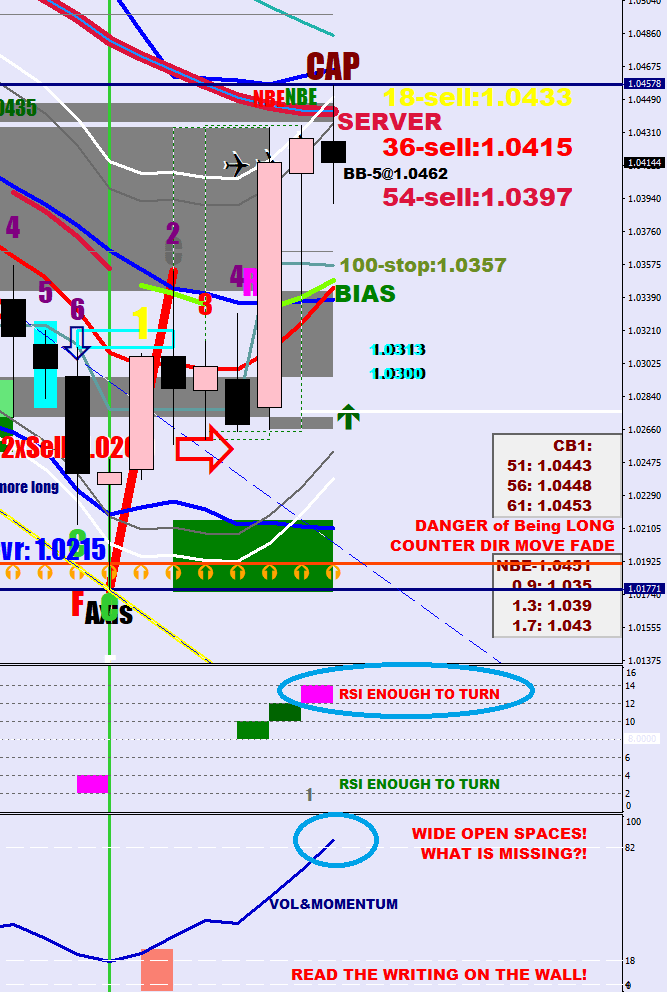
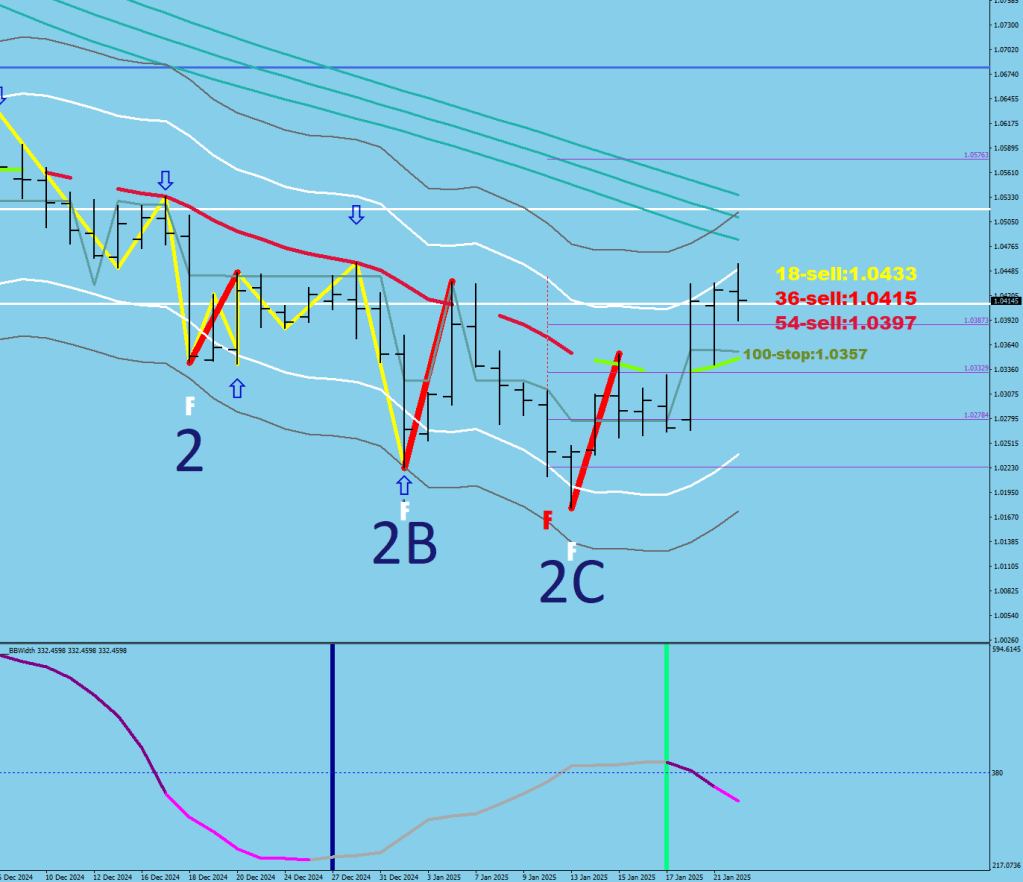
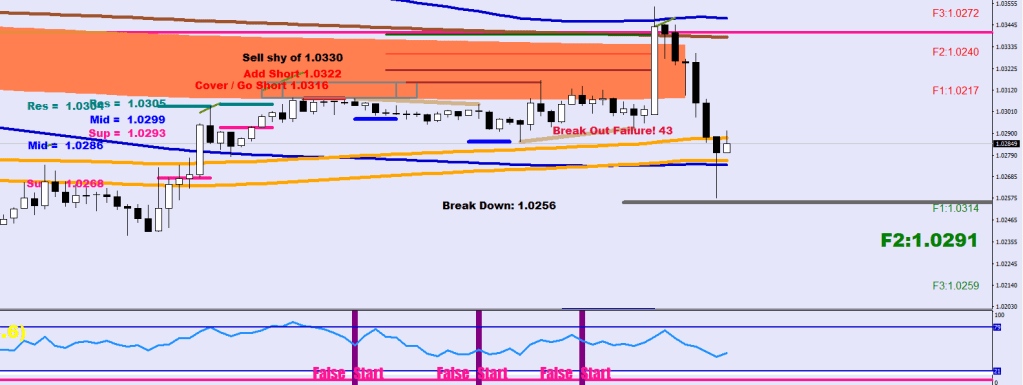
As for tangible advice, the market maker is now net short. Align your holdings accordingly. Use a move up to dump longs, i.e. towards 1.0430 or upon approaching the 30-sample BB.
The pause/difficulty here is the sudden overbought condition (RSI, Stoch).
At the same time, there is an hourly 200-sample new high made with an acceleration. That is not bearish, at least not in the short term, because a higher high and a thrust are missing.
A bottoming process is underway, and this is going to go back down for sure, possibly making an F3 print with a lower low.
There is a 28-hour allowance for the HH beat (expected to be 6-16 pips higher than the current one statistically).
If the HH is only made beyond 28 hours, the final thrust would only be a lower high.
I believe there will be a thrust when the MA ribbon is lower. The daily 50 EMA is likely going to be hit. 1.05 or so would make sense.
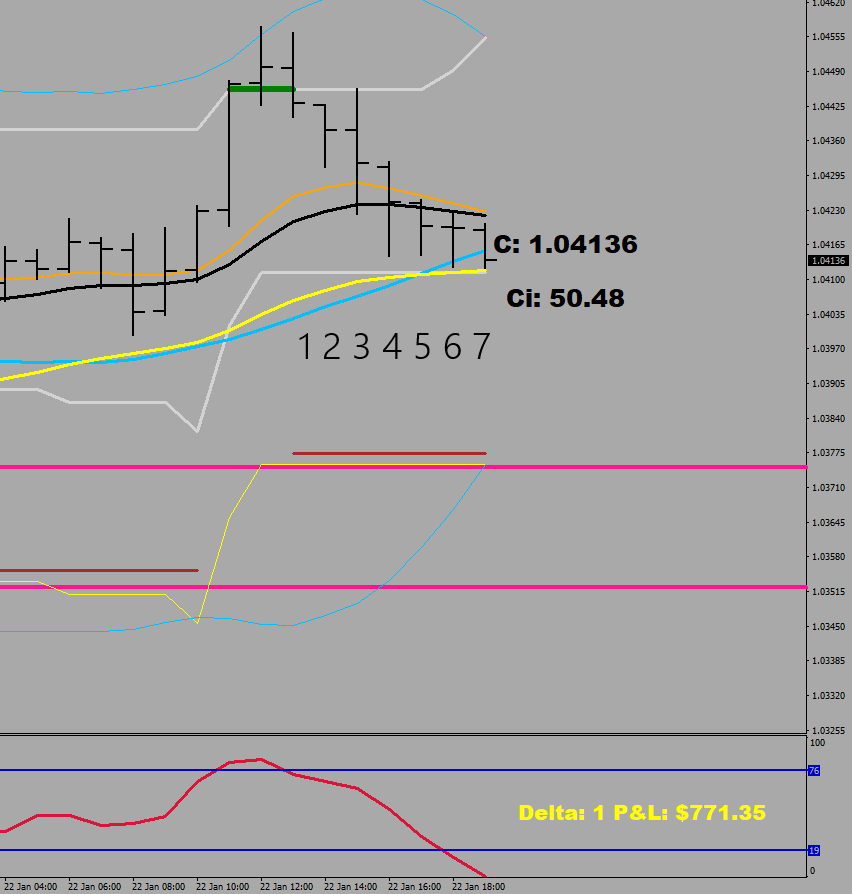
The main curve ball is the behavior lately starting 1 hour after the US close. They have been moving the market regularly, starting with the 2C low.
The least likely outcome would be a stochastic embedding (hanging out in the overbought for 3 days+) and starting to churn higher.
This is a pullback after a new high, that feels like a start of something new but barely got beyond the statistical 35-41 pips that is the highest likelihood after a Money Flow acceleration.
The downwards constraint is over with. The swing low is in. If you want to play something, play the upside.
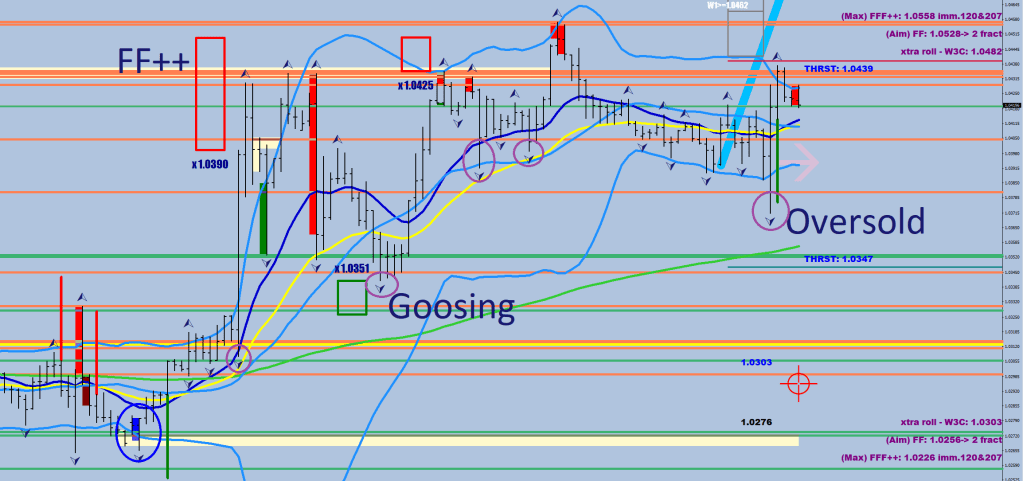
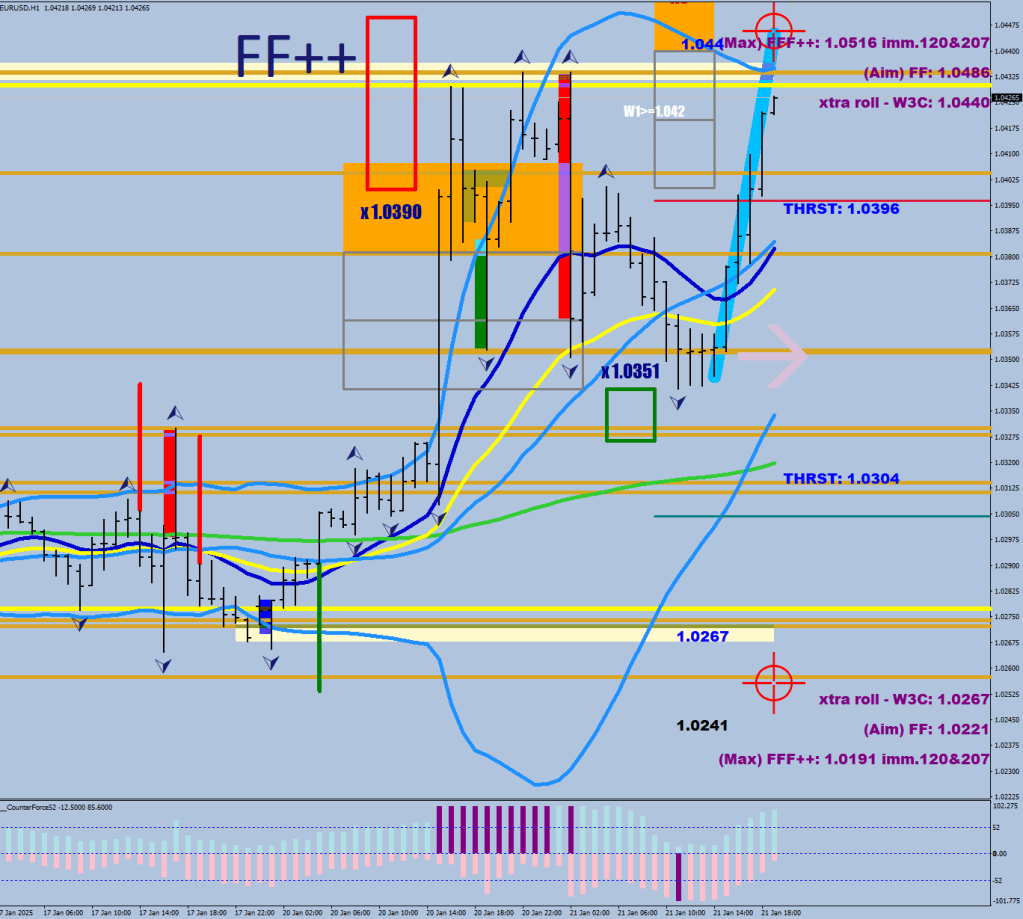
On the recent pullback after an FF++ move (very strong, only 20 pips away from the full tilt, we are looking at a possible FF hit at 1.0486.
They purchased the Goosing level, very close to the consolidation mean which tells you they are very bullish. Also, the purple stretch (93+ pips) condition on the downside did not receive a beat.
A liquidity break has finished (red line). A lower low is guaranteed. The Bollinger Bands are starting to compress (volatility will trend down – green vertical marker).
The market maker is a net short here. The thick red was the squaring of long holdings.
The week is closing more than 91 pips up, so technically a swing low is in place until the low gets taken out again.
The filters I wrote pick up this 3-hour selling as a short squaring.
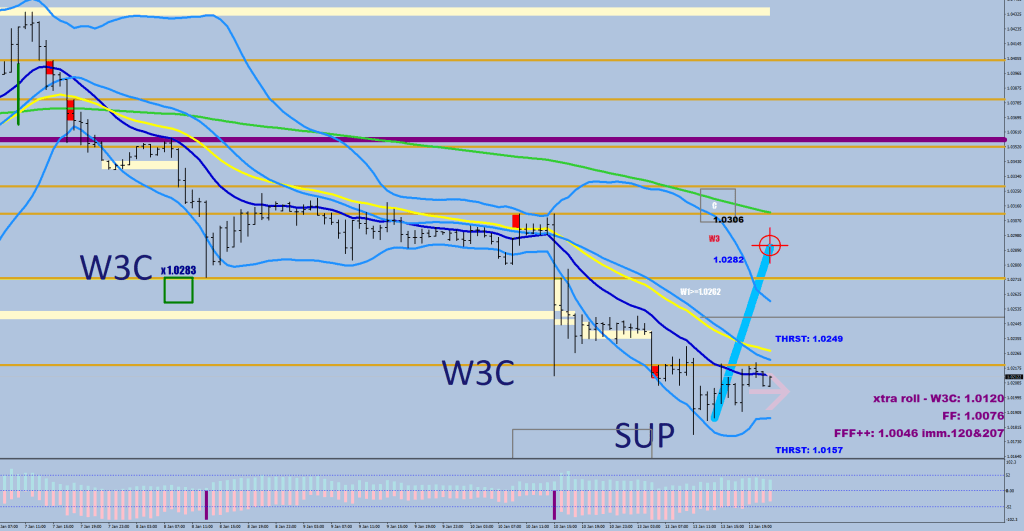
This is a fluctuation maximum (46 pips) from one side to the other side without moving the consolidation range. This move could be a Wave 2 down or a Wave B down. Either way, more upside beyond the high that was made today looks to be in the cards.
As for the CPI I knew that the Market Makers were wrong, see the green squarings prior, and also there were 3 false starts on the MFI/RSI2 combo, so I told my coworker that the upside was “prepped”, and this was going to rally.
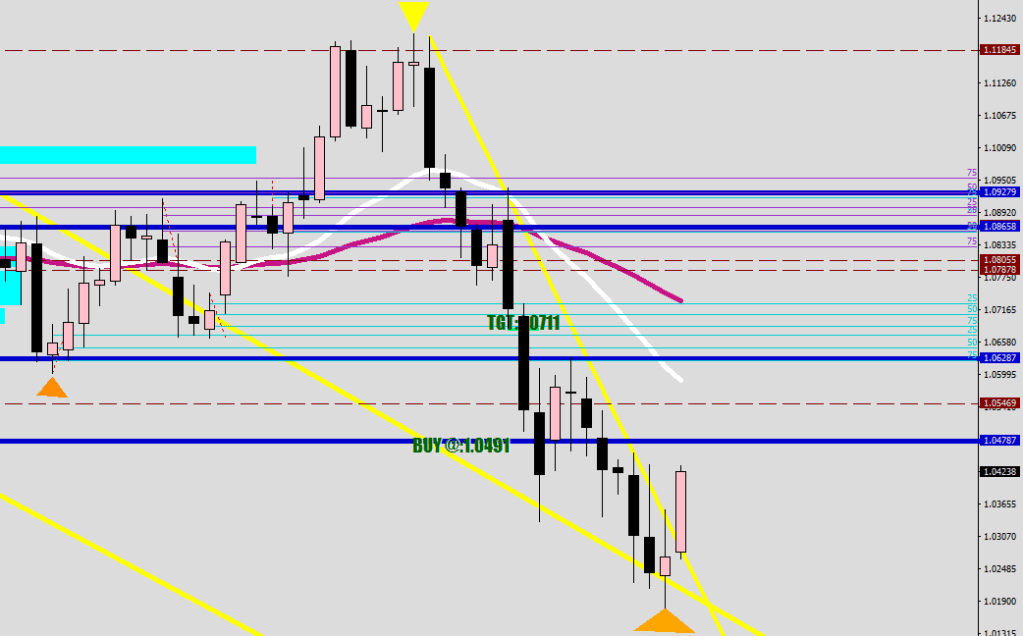
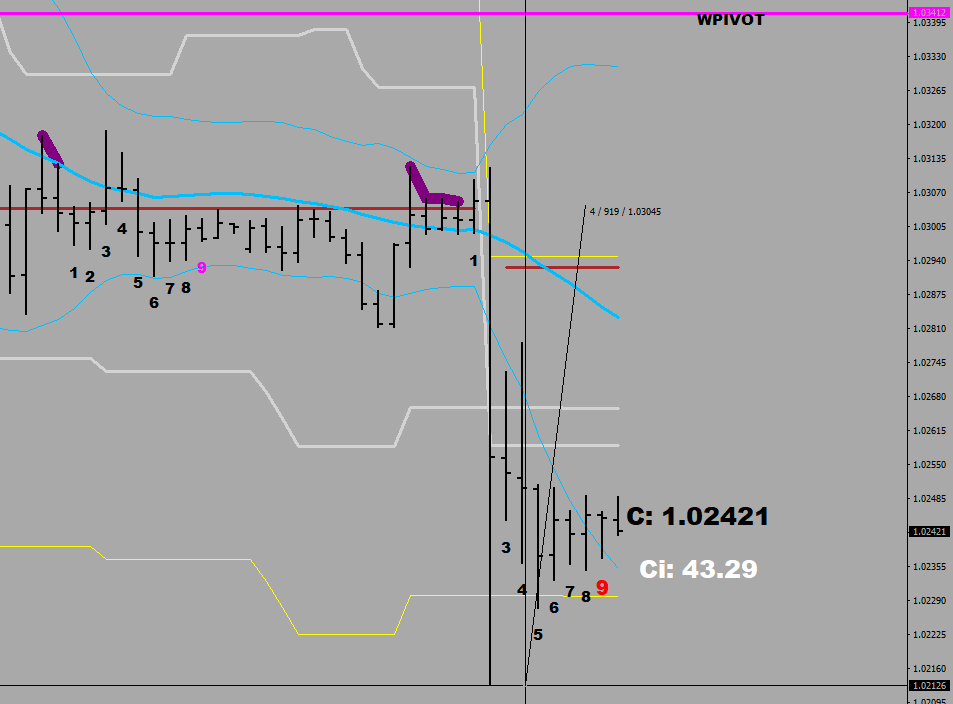
Buy 6 pips below the black candle’s close (1.0280) and add more if it moves lower for up to 16 pips.
The next three reactive lines are at 1.0381 and 1.04045 and 1.04337. Any of these could & should see a 25-pip counter move at least, but trail to be prudent.
The 2-hour thrust down took the price to the support level relative to the consolidation mean, 37 pips away (a no-break extension).
The next move should be a lift and square: a candle breaking above the 30 SMA and a consecutive candle with a 16+ pips wick on the bottom of it. Wherever that candle closes, 6-16 below would be the hot area to go long.
I expect to see a liquidity break, a rally at least 2 days long which would tackle the upper BB30 three times in a row. The 9-day EMA seems totally attainable in the coming days.
In short, 92-95 pips run up, then two bowbacks making a bid for the low, one close, the other closer, but a match of the F3 low on the second attempt, and then… it is all over.
The last two F3-s looked like this:
If you consider A and B prints, the first A would be a bit longer than the second, and the first B would be longer or equal to the second. This is a contracting pattern. Length? 3-8 days.
According to this blueprint, the first A should take the price to 1.0304-1.3010