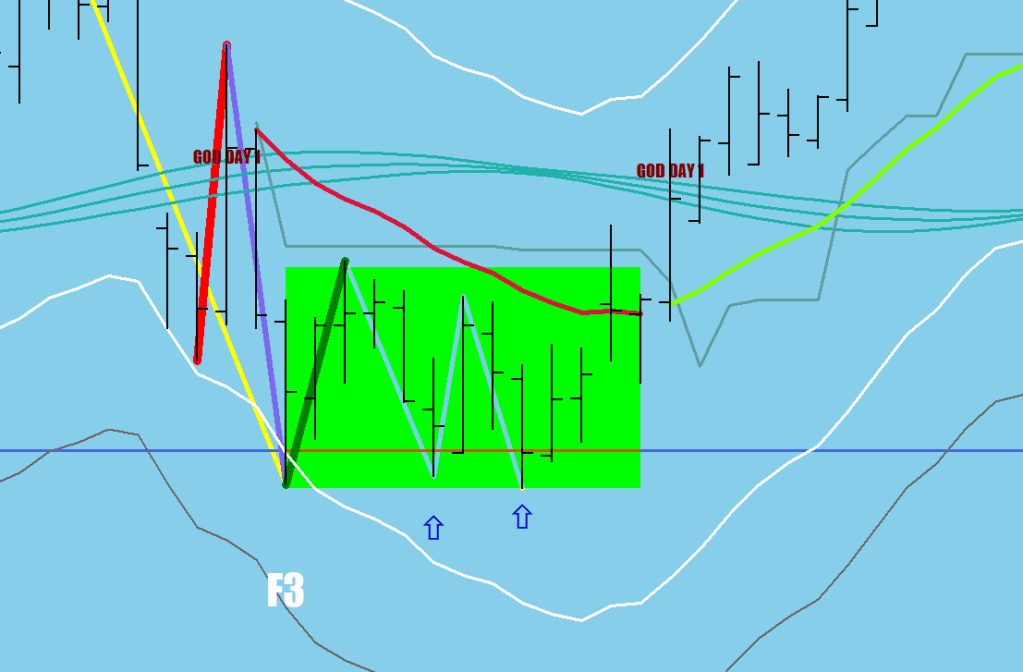
In short, 92-95 pips run up, then two bowbacks making a bid for the low, one close, the other closer, but a match of the F3 low on the second attempt, and then… it is all over.
The last two F3-s looked like this:
If you consider A and B prints, the first A would be a bit longer than the second, and the first B would be longer or equal to the second. This is a contracting pattern. Length? 3-8 days.
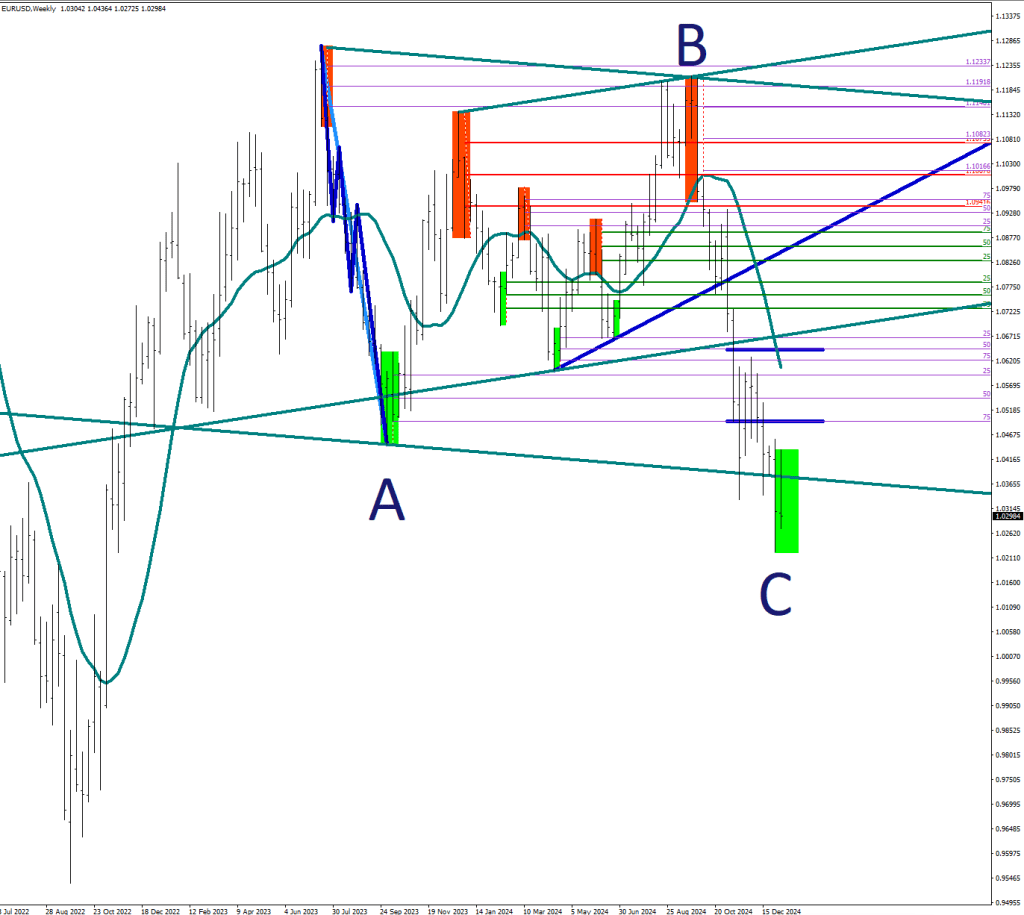
According to this blueprint, the first A should take the price to 1.0304-1.3010
#1 When the total regime change happened at the top, the entire consolidation took place below the 16 EMA. So it is not enough to be on the other side of the 80 line, it must be high-basing to turn.
This therefore did not qualify.
The current problem with the reversal is that the volatility is rising.
The third important clue was the failure to the leg 3 (which resulted in having to rename it as a 2B) was again too much volatility. Believe it or not, a steep 2-day incline is not productive.
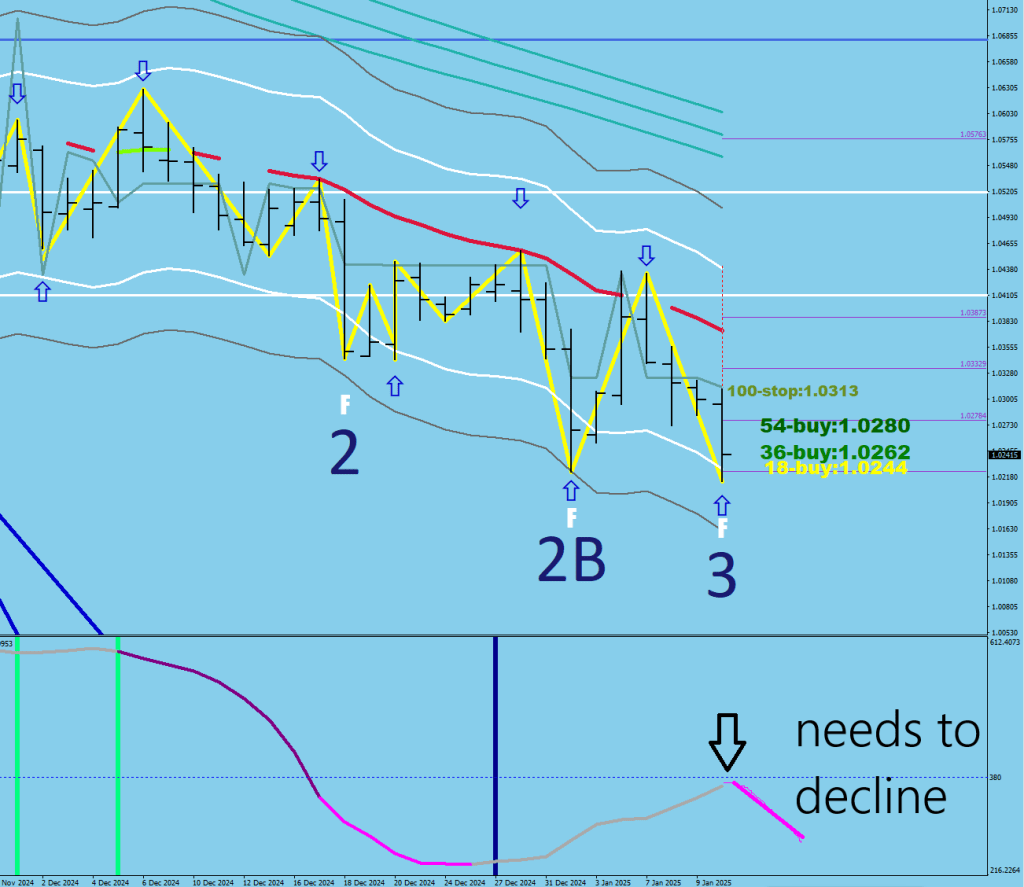
See those red diagonal lines? They are steep 2-day inclines that I call liquidity breaks. All of them have resulted a lower low, and only two of them had a re-visit/beat by 5 and 11 pips namely.
Two days and 100+ pips and the rally is spent.
if (iHigh(symbol,0,iHighest(symbol,0,MODE_HIGH,2,j))-Low[i]>1000*Point && iHigh(symbol,0,iHighest(symbol,0,MODE_HIGH,2,j))<iMA(symbol,0,9,0,MODE_EMA,PRICE_HIGH,iHighest(symbol,0,MODE_HIGH,2,j))+600*Point) ObjectSet("Liquidityx"+i,OBJPROP_COLOR,clrRed);
         ObjectSet("Liquidityx"+i,OBJPROP_WIDTH,9);
         ObjectSet("Liquidityx"+i,OBJPROP_BACK,1);
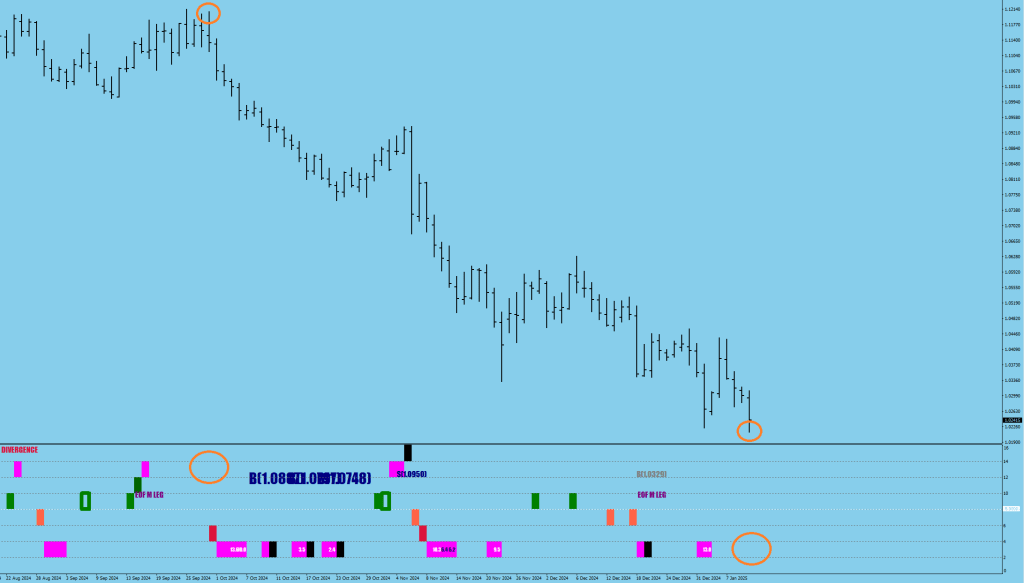
Other than that, the “3” did not register on my RSI2 scale which would make it equal to the one at the top. Strong divergence.
The idea is that a market maker closes out a block with balanced books (no excess holdings in the wrong direction), thus making a brief countermove. We are going to try to spot and plot these.
Our canes are 3 lines, the 30 sample BB Upper, Lower and Main.
On the upside: lift and square (green boxes)
I am looking for a move above the MAIN or the UPPER line on the previous 2 candles, an ascending 16 EMA, and a lower wick greater than 16 pips.
Once the plot is made, the early bird can get in on a dip below the candle close on the upper examples by 6 pips up to 16 pips.
The squaring lines are relatively safe spots to put stop losses beyond.
On the downside: crack and square (red boxes)
The downside works similarly, but instead of a separation, I am looking for a crack, then a follow-up candle that has an upper wick of 8+ pips (yes, another arbitrary number).
I added one extra condition with a combination of the 2 bands, which is a combination of the two bands when a squeeze makes a move like this possible.
The noodles that the market could make an acceleration/thrust from.
I’ve listed 3 check points that are statistically likely for a terminal move.
I should have considered having a full charge, in that case, the gray line (THRST/No Break Extension) is a slim chance.
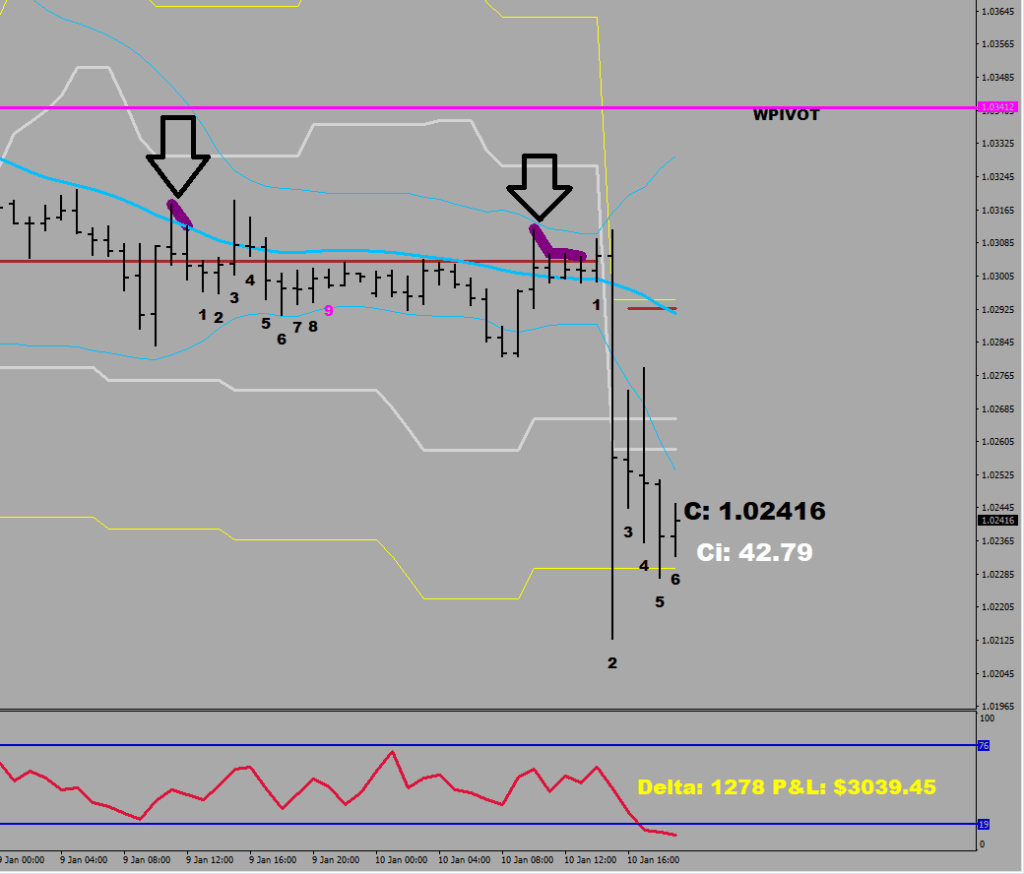
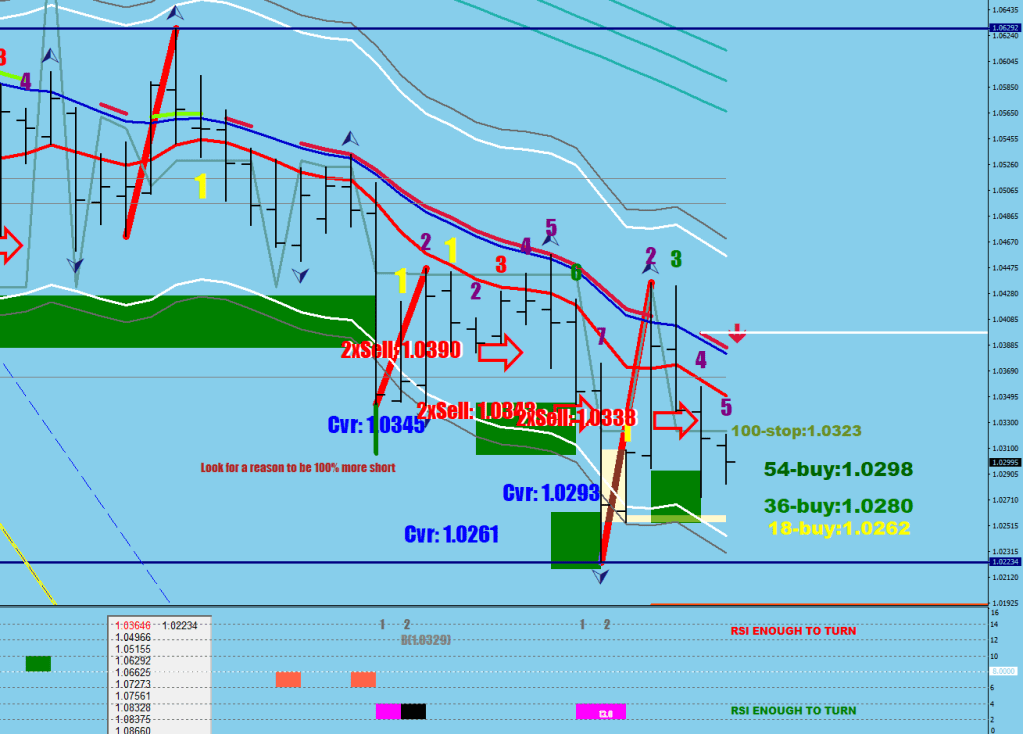
The second down candle was a push against the weekly low. It was good enough for another pierce beyond the 1.0250 level.
Now comes knowledge. The third candle hit a traction surface (back and forth through the 30-BB).
Notice on the following examples how a bull flag cand disable this secondary entry.
Now? One lifeline has been used; the 8 EMO should be the next to have some grip – a 3-5 hours long sell. I could picture another low that is lower than 1.0226 but would fall shy of 1.0213.
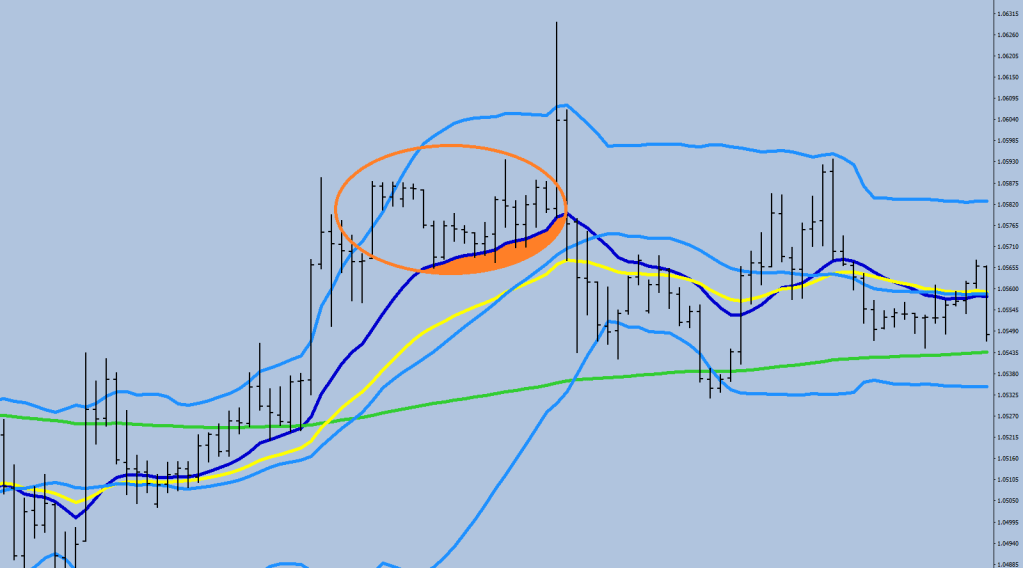
The importance of the last full candle outside the BB.
You either get a pullback to the 16 EMA for a continuation (with a break out beyond at some point), or multiple closes start to print on the other side of the 16 EMA for a reversal.
What do the Brits always say? Simples.
if ((High[i]>iBands(symbol,0,30,2,0,PRICE_MEDIAN,MODE_UPPER,i) && Low[i]<iBands(symbol,0,30,2,0,PRICE_MEDIAN,MODE_UPPER,i) || (High[i]>iBands(symbol,0,30,2,0,PRICE_MEDIAN,MODE_LOWER,i) && Low[i]<iBands(symbol,0,30,2,0,PRICE_MEDIAN,MODE_LOWER,i))) &&
   ((High[i+1]>iBands(symbol,0,30,2,0,PRICE_MEDIAN,MODE_UPPER,i+1) && Low[i+1]>iBands(symbol,0,30,2,0,PRICE_MEDIAN,MODE_UPPER,i+1))
|| (High[i+1]<iBands(symbol,0,30,2,0,PRICE_MEDIAN,MODE_LOWER,i+1) && Low[i+1]<iBands(symbol,0,30,2,0,PRICE_MEDIAN,MODE_LOWER,i+1)))
){

               ObjectCreate("KAROLYI"+DoubleToStr(i), OBJ_RECTANGLE, 0, Time[i+2], High[i+1] , Time[i+1], Low[i+1]);
              ObjectSetInteger(0,"KAROLYI"+DoubleToStr(i),OBJPROP_COLOR,clrLemonChiffon);
              j=i-1;
           if (High[i+1]<iBands(symbol,0,30,2,0,PRICE_MEDIAN,MODE_LOWER,i+1)){
              while (j>0){
               if (Close[j]<Low[i+1]) break;
               j--;
              }
              ObjectCreate("KAROLYII"+DoubleToStr(i), OBJ_RECTANGLE, 0, Time[i+1], Low[i+1]+50*Point , Time[j], Low[i+1]);
              ObjectSetInteger(0,"KAROLYII"+DoubleToStr(i),OBJPROP_COLOR,clrLemonChiffon);
           }
           else if (Low[i+1]>iBands(symbol,0,30,2,0,PRICE_MEDIAN,MODE_UPPER,i+1)){
              while (j>0){
               if (Close[j]>High[i+1]) break;
               j--;
              }
              ObjectCreate("KAROLYII"+DoubleToStr(i), OBJ_RECTANGLE, 0, Time[i+1], High[i+1]-50*Point , Time[j], High[i+1]);
              ObjectSetInteger(0,"KAROLYII"+DoubleToStr(i),OBJPROP_COLOR,clrLemonChiffon);
           }
}
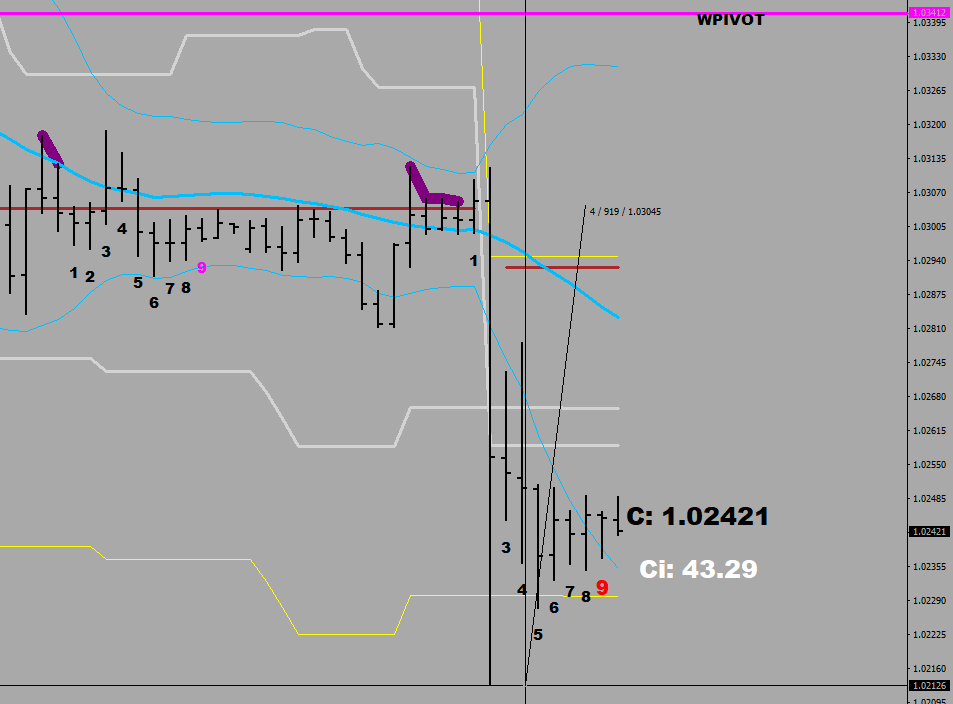
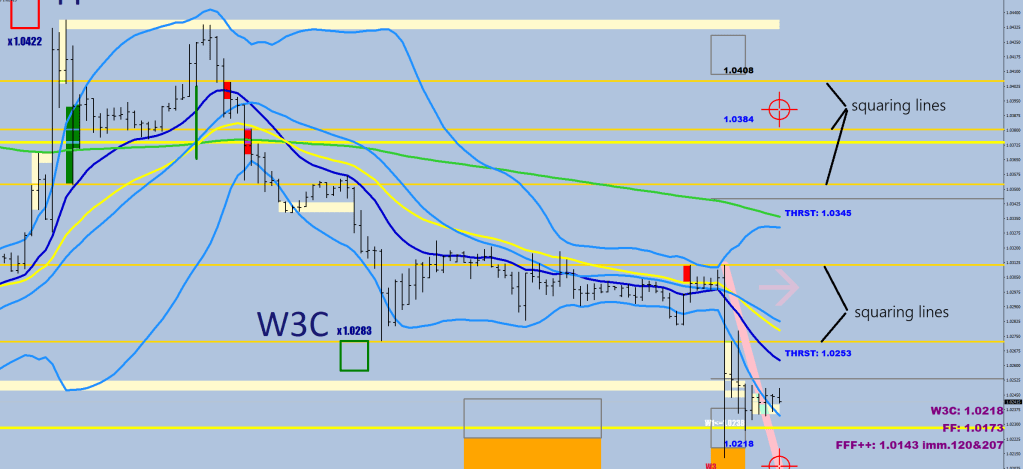
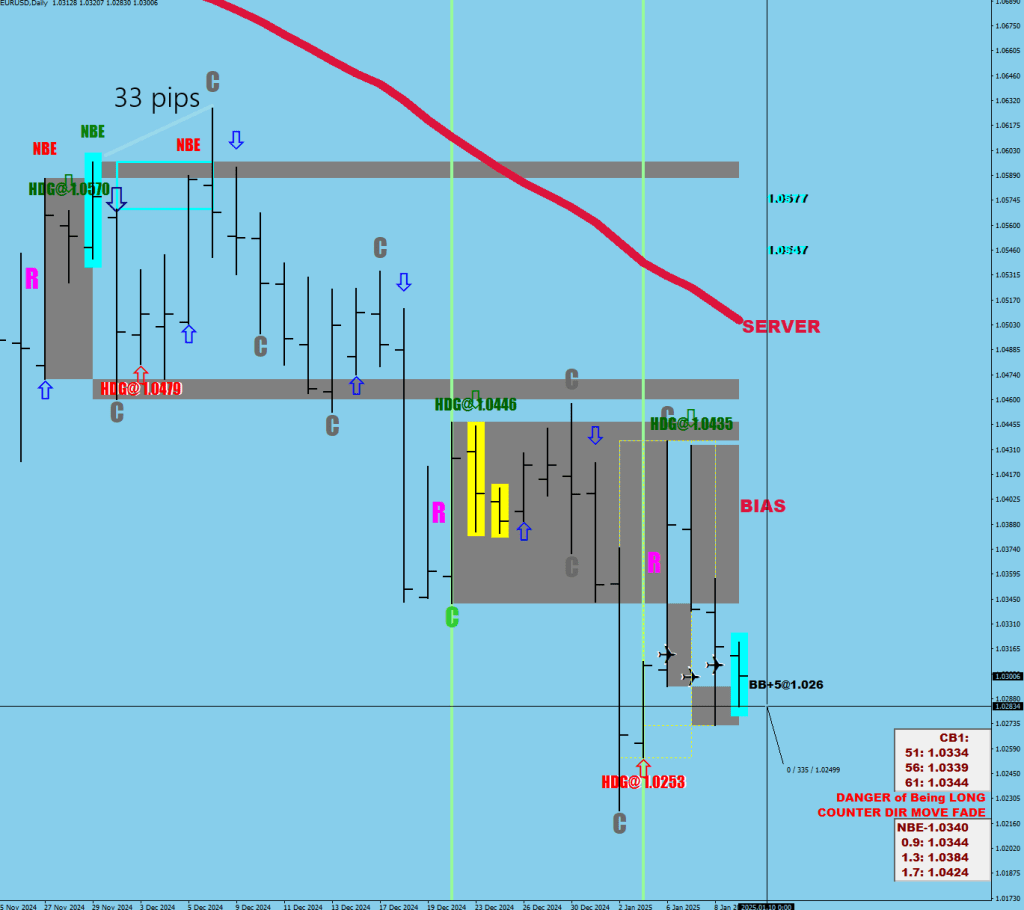
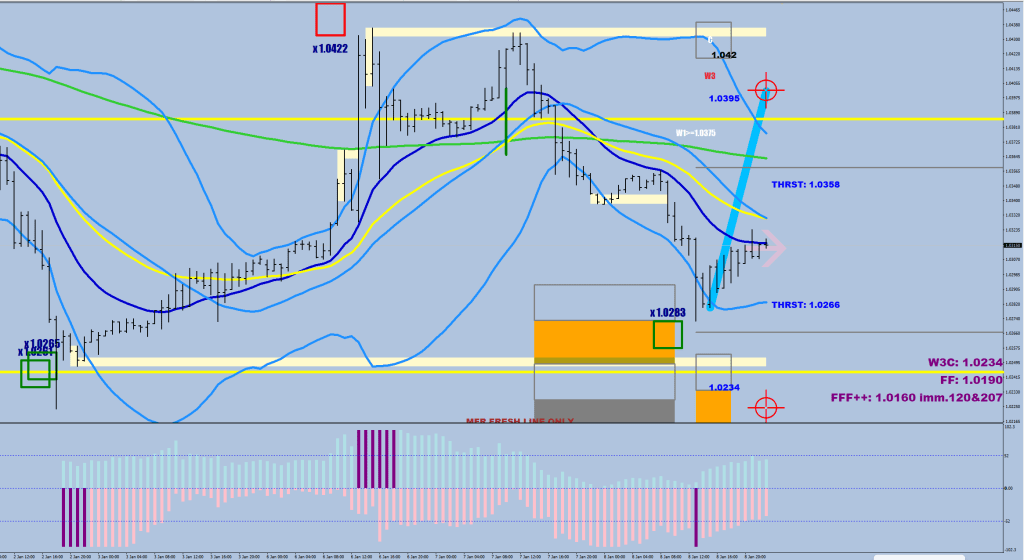
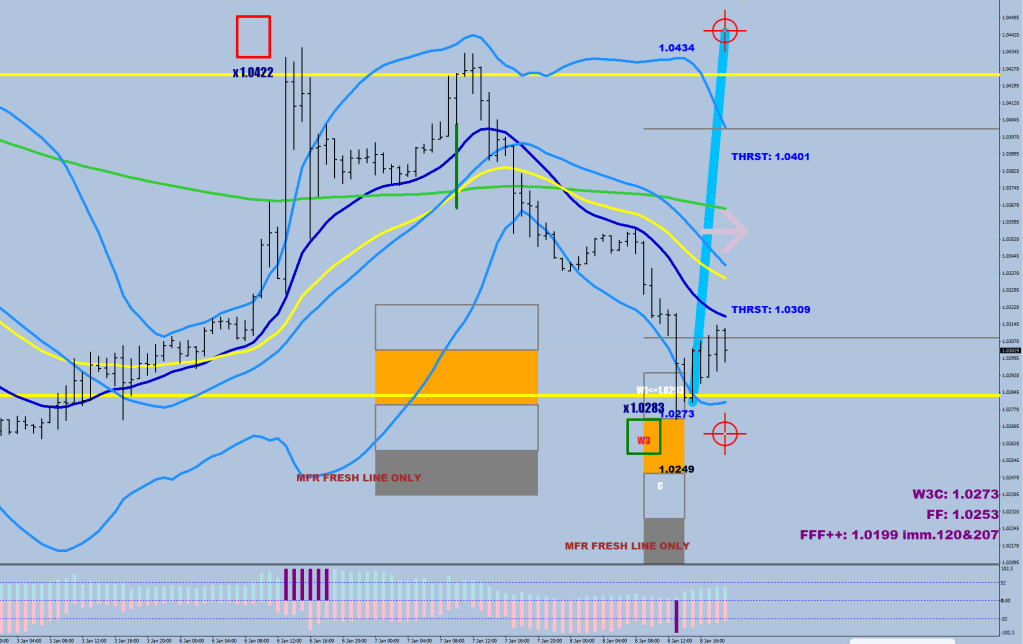
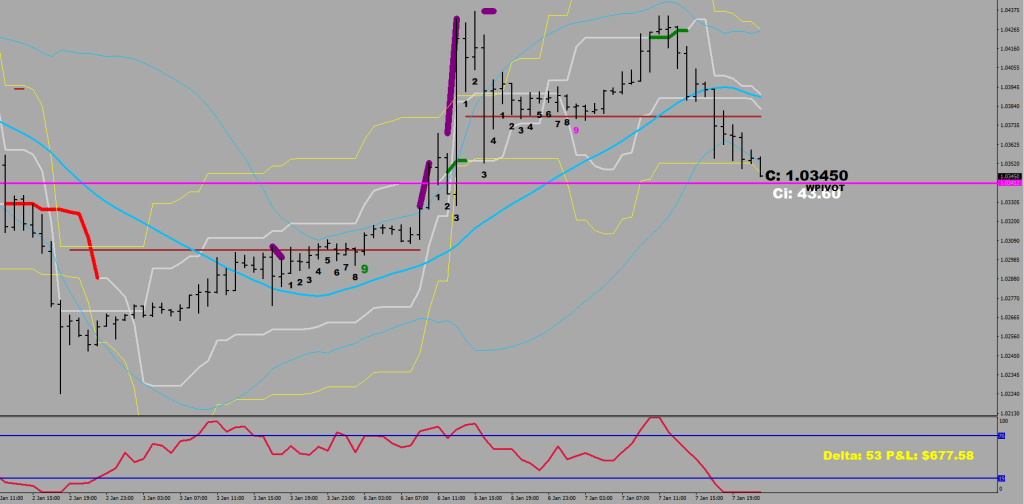
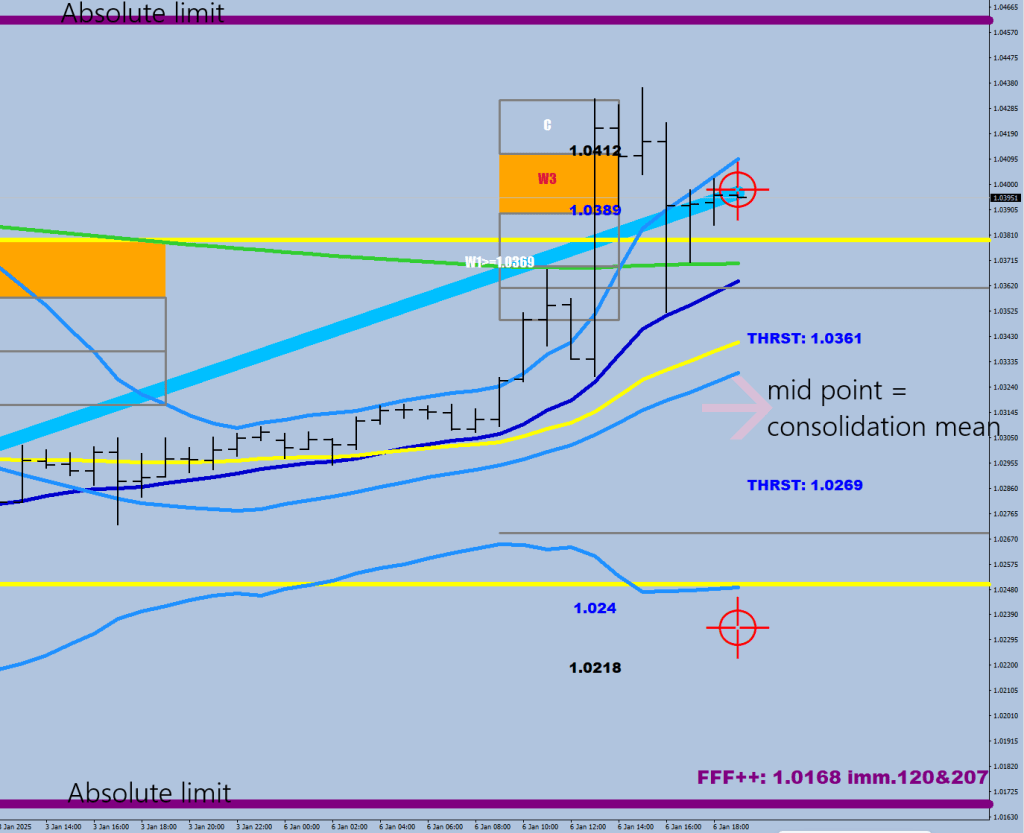
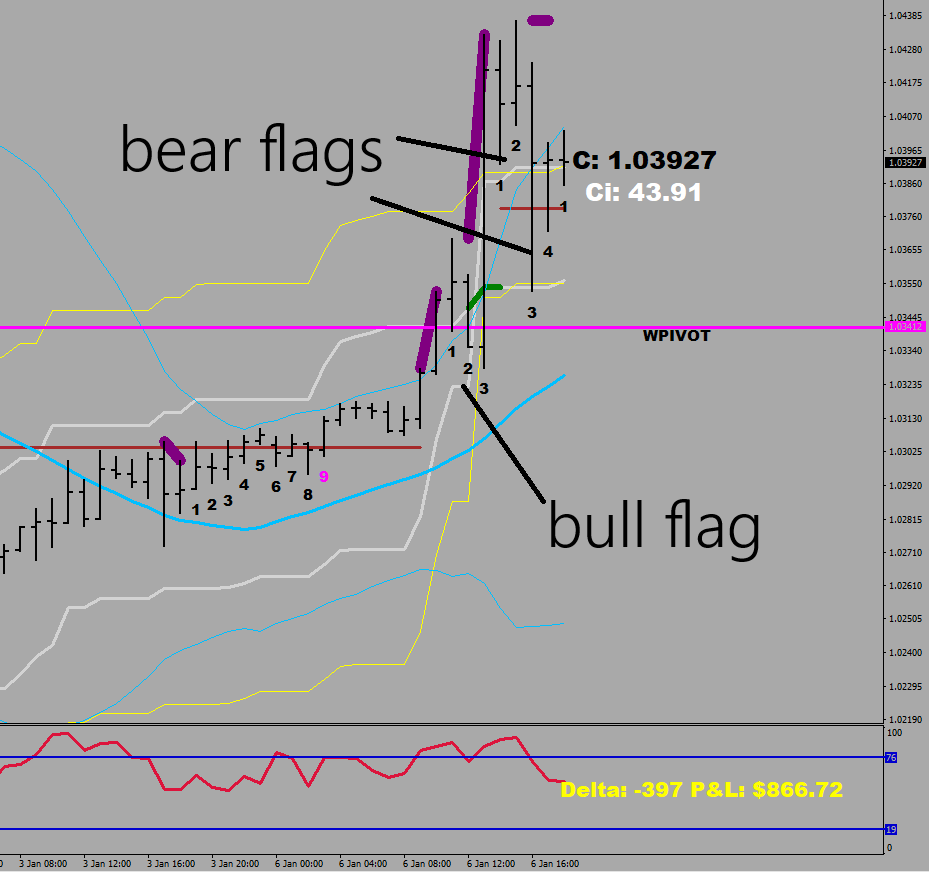
The MA ribbon (W2 buy) is at 1.0341, the No Break Extension of the consolidation (fluctuation maximum away) is 1.0337. Pretty much there now. Weekly pivot at 1.0341.
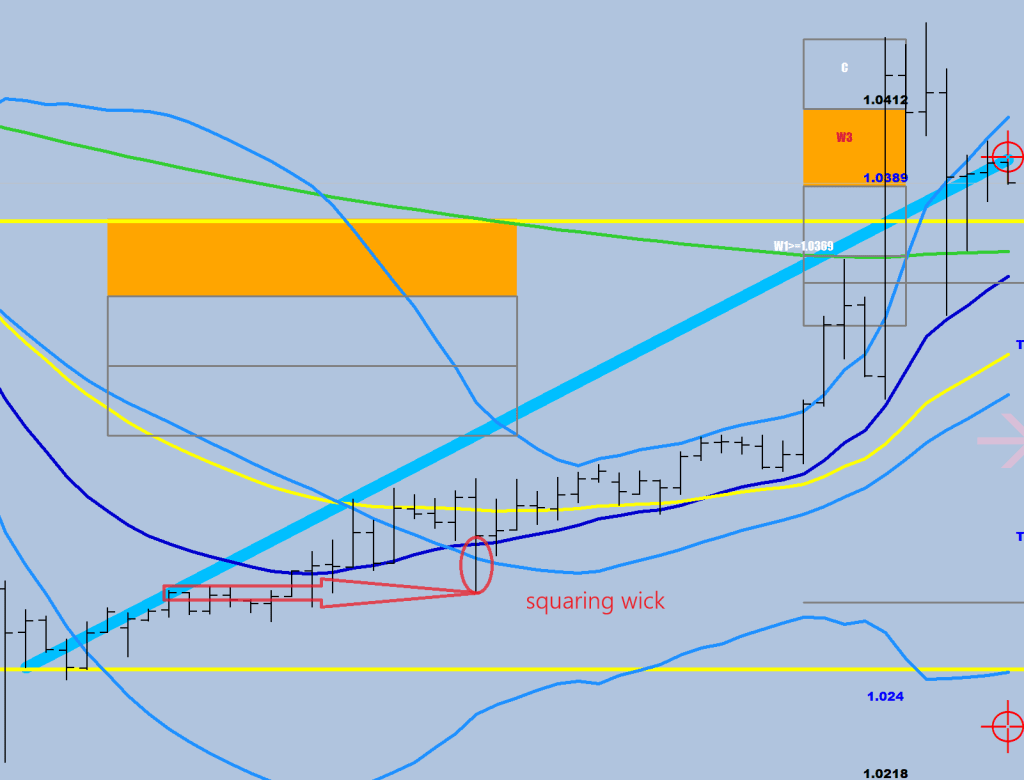
There’s gonna be a powerful move coming out of this falling wedge.
Me, I’m Scratchy – I wrote it yesterday about an ex-coworker. The style is halfway between UB 40 and Level 42. Currently, I hold this one in the best 5 ever, which is something out of the 800+ songs I have. Seriously, listen in.
The steepest trap is a capitulation thrust, as people’s short term memory/fears will be keep on fading the return trapping themselves more and more.
If the pendulum swings outside the playfield a calibration~mean reversion gets kicked off.
The pendulum swings between the absolute limits.
Any wick that is 16 pips or longer towards the extreme print is a clue of squaring (i.e. the market maker dumping out excess load in line with the unfolding mean reversion).
Fading efforts of the return move to the 120SMA and the 207EMA would get run over. If these two levels get taken without a correction in between below the S30, the market may be in a parabolic mode, receiving constant charge at the upper BB, it can get as far as the FF level.
Next? The short squeeze provided some bull advantage, there is a chance to consolidate above the 80 line. If that happens, the likelihood that we saw the low for the year on the first trading day goes from very high to certain.
Since numerous hourly candles were completely outside the 30-sample BB, if a new leg were to start (drive), I would expect the price to come back to the 30 SMA at a minimum or optionally to the lower 30-sample BB, which is currently in the 1.025x range thanks to the volatility increasing push.
As we discussed. The first F proves the presence of counter-directional volatility by blasting through the 100-pip stop.
The second F prompts a move that violates the 100-pip stop by a little.
The third F puts the price over the 100-pip stop for good after going beyond 1 and 2.
However, an F needs the ink to dry. The next 3 days would all have to stay above the low made. 2 more days to go. The #3 on the upside received 2 scares, one fell shy by 10, the other by 4.5 pips (on day 2 and day 3 namely).