
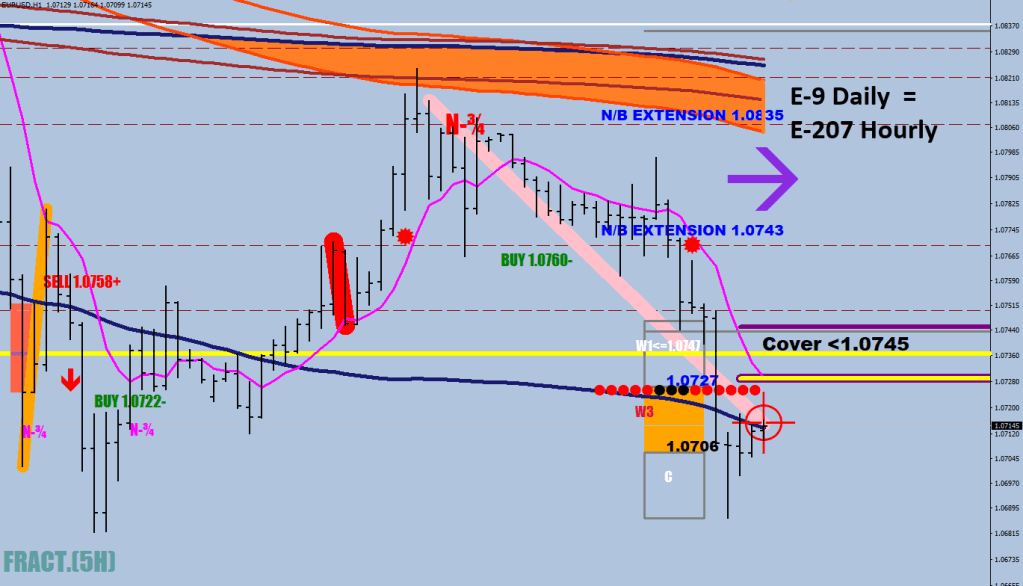
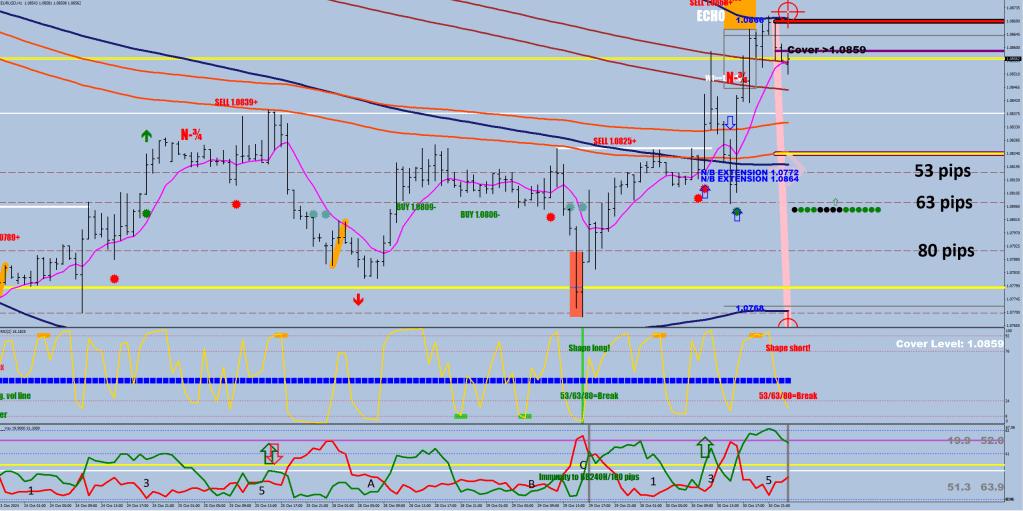
Cover 1 is at 1.0657 – possibly the target of the Echo.
No 91+ pips close up – no swing low in place.

Frankly, there are two options here. Dance back to the E-9 daily for the last leg to start or a bow back and break lower.

Cover 1 is at 1.0657 – possibly the target of the Echo.
No 91+ pips close up – no swing low in place.
Frankly, there are two options here. Dance back to the E-9 daily for the last leg to start or a bow back and break lower.
We have work to do, and the class is in session.
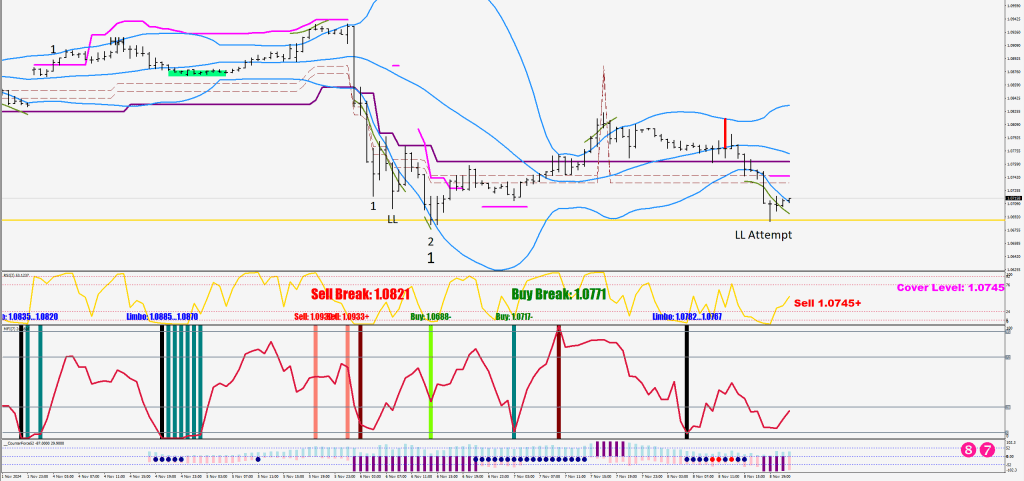
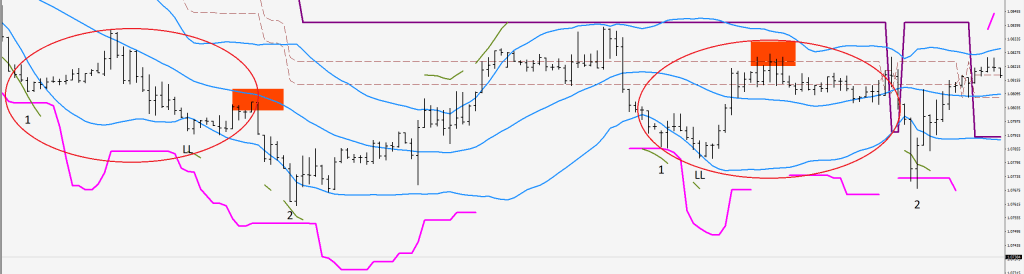
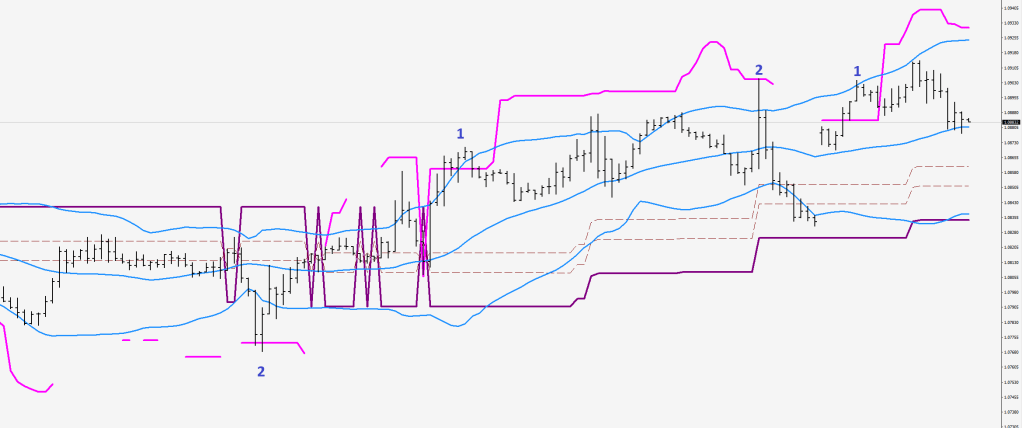
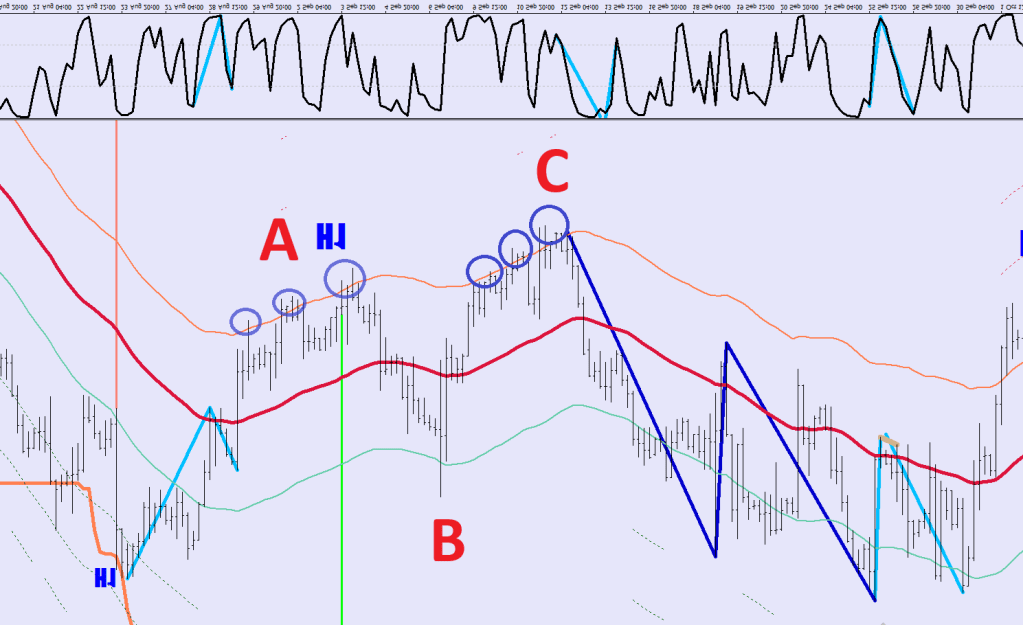
Besides the sell and the buy market, there are different phases.
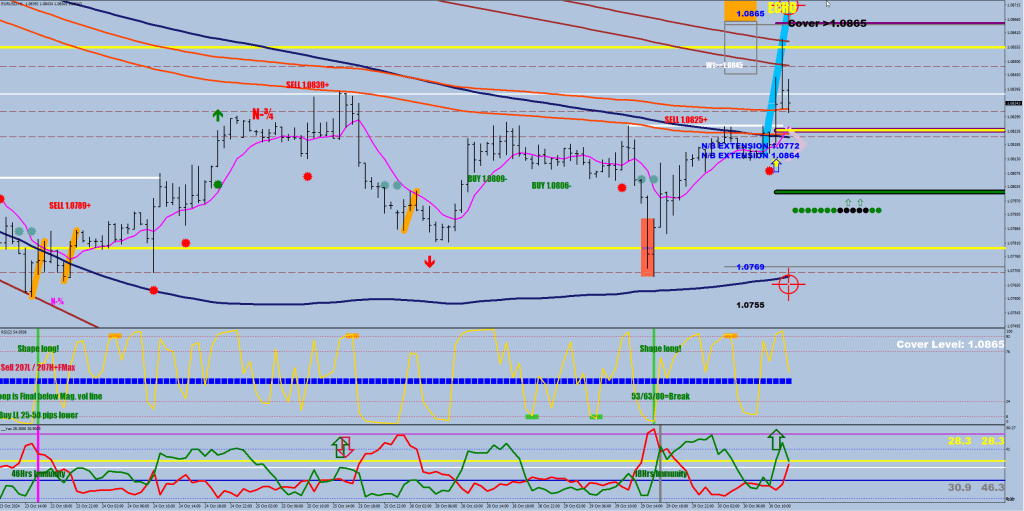
The market is considered “tendered” after it has made a charge for the cover level and has not yet made the final thrust.
This is a protected mode, where there are at least two distingishable fractals, “1” is the initial charge. The HH or LL print is another (unsuccessful) reach for the cover level.
The green ovals are the “tendered” period. They end in a higher low (lower high) before the final thrust (2), which usually would tag the cover line one more time – it fell short in the second example.
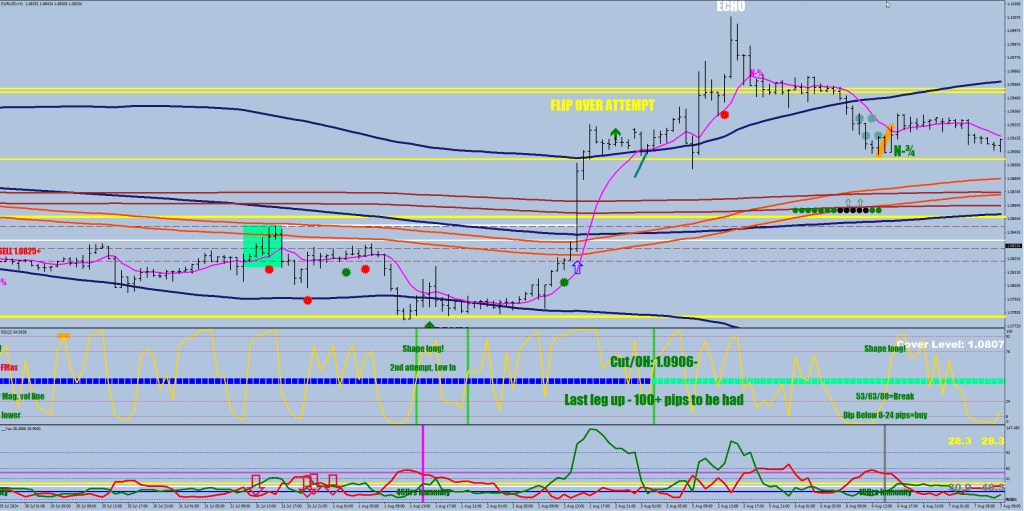
After the market has “thrusted”, there is a window of opportunity for breaking the 80-pip line from the 200-sample high / low, which is what happened here.
A 250-pip day does not happen often. However, impulse waves do not end in strength, and this Wave 5 would not be an exception.
I would like to call your attention to the market maker squaring wick back to the 80-pip line where they dumped out long holdings (arrows) and the little hoop shows how much the 80-line was respected a bit later.
Right now, there is time needs to be burnt, so that the cover line would end up lower than the swing low (relative to the 10-sample high) and then onto the LL print before the red box and the final thrust (2).
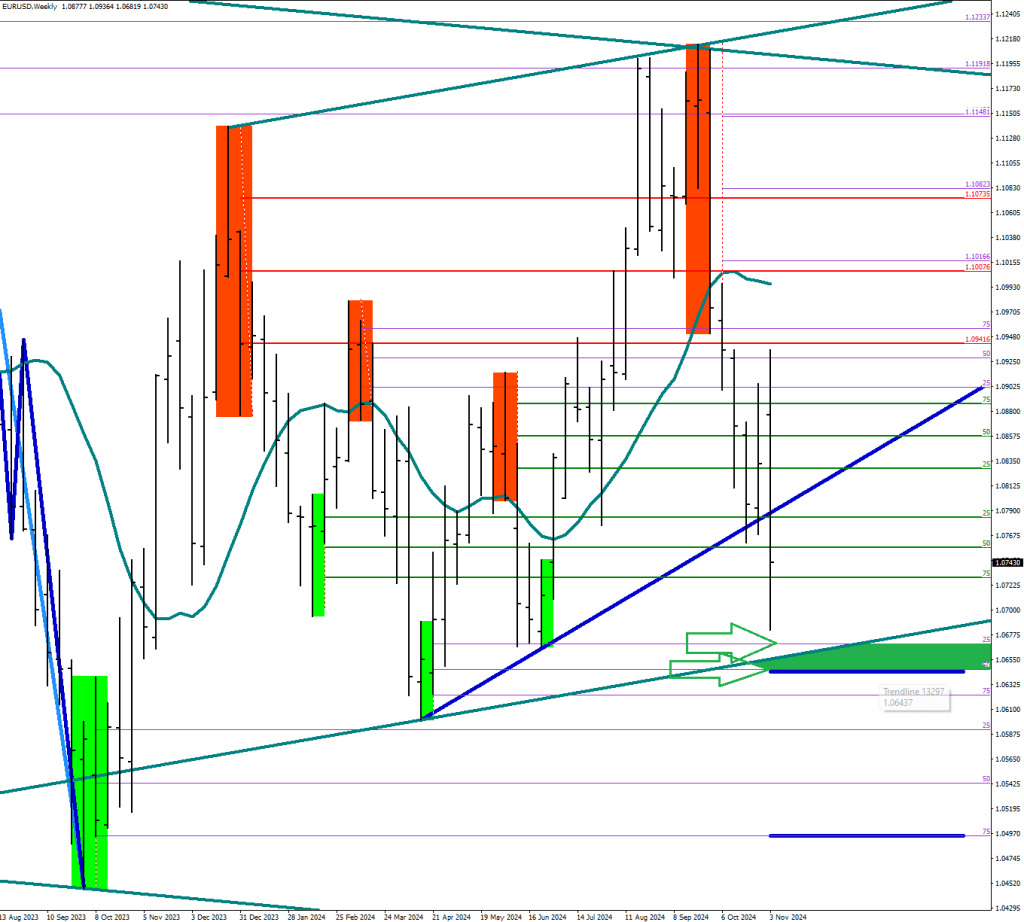
We are going for that 1.0670-1.0643 block.
The pro volume block got picked up in one go, but the low would have to be cut under for max damage.

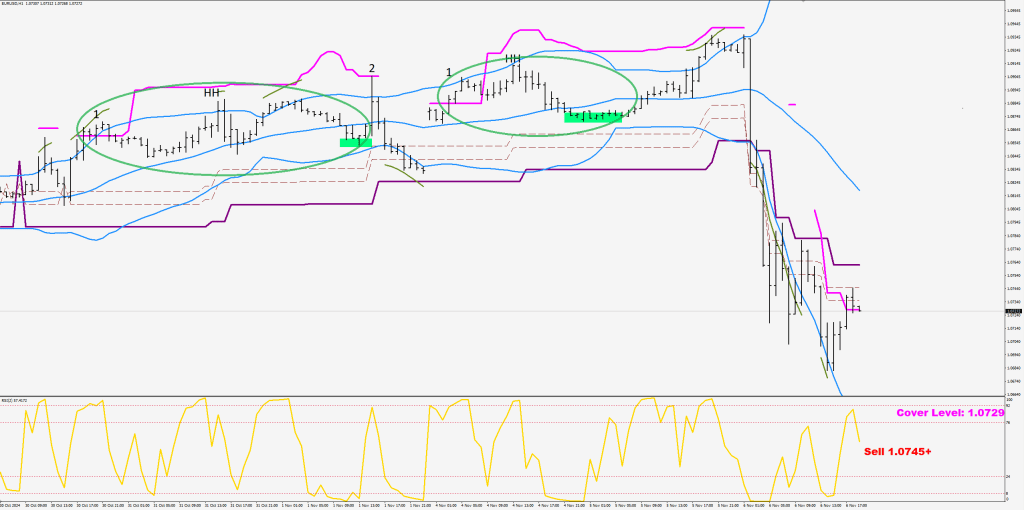
Wave 3’s waning end missed the cover level even on the first try.
Made an indicator with it.
When the purple thing is open on the upside, the market is set to rally.
An optimal buy starts at 63 pips from the recent 200-sample high and is a game till 80 pips.
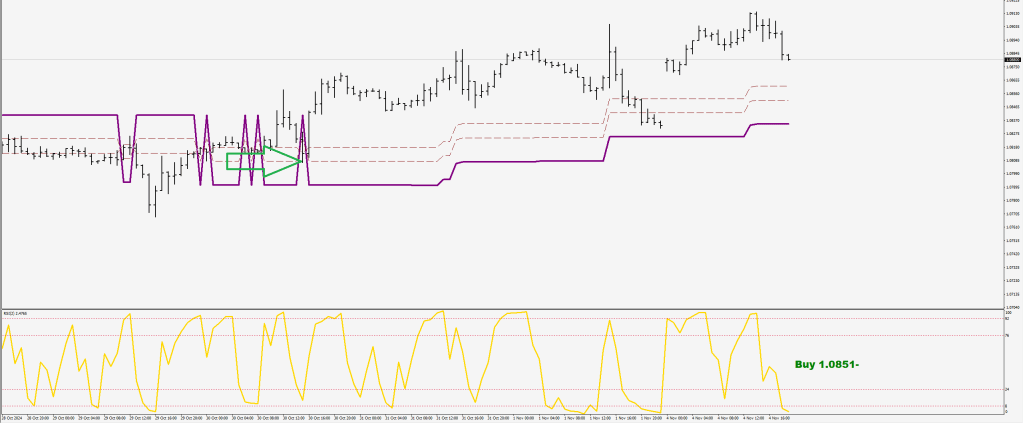
You can see above as the purple thingy flips from sell to buy.
if (MathAbs(Close[i]-iLow(symbol,0,iLowest(symbol,0,MODE_LOW,200,i)))<MathAbs(iHigh(symbol,0,iHighest(symbol,0,MODE_HIGH,200,i))-Close[i]))
{reference[i] = iLow(symbol,0,iLowest(symbol,0,MODE_LOW,200,i));
L53[i]=reference[i]+530*Point;
L63[i]=reference[i]+630*Point;
L80[i]=reference[i]+800*Point;
if (L80[i]==L80[i+1]) L80p[i]=L80[i];
else L80p[i]=L80[i+2];
if (Close[i]<L53[i]) cover[i]=iHigh(symbol,0,iHighest(symbol,0,MODE_HIGH,10,i))-530*Point;
}
else {reference[i] = iHigh(symbol,0,iHighest(symbol,0,MODE_HIGH,200,i));
L53[i]=reference[i]-530*Point;
L63[i]=reference[i]-630*Point;
L80[i]=reference[i]-800*Point;
if (L80[i]==L80[i+1]) L80p[i]=L80[i];
else L80p[i]=L80[i+2];
if (Close[i]>L53[i]) cover[i]=iLow(symbol,0,iLowest(symbol,0,MODE_LOW,10,i))+530*Point;
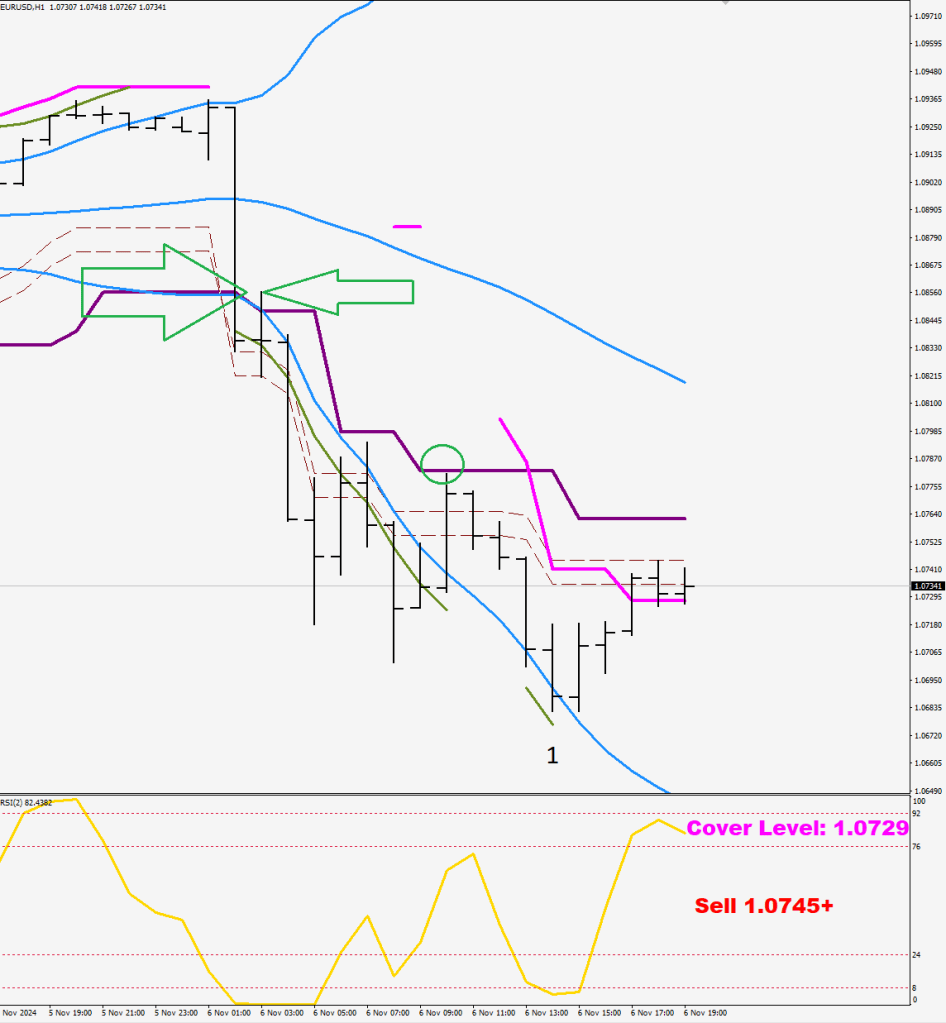
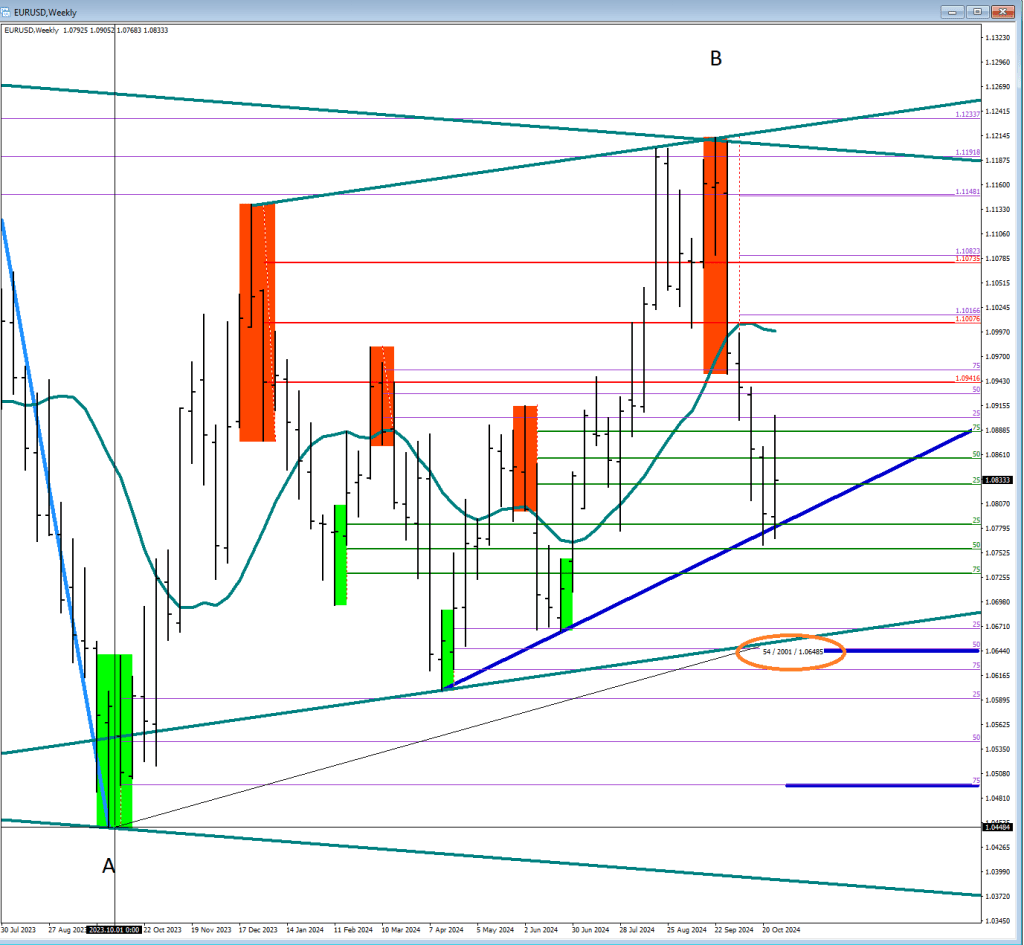
}The yellow circle below shows in a different format the high voltage kiss goodbye of the two poles.
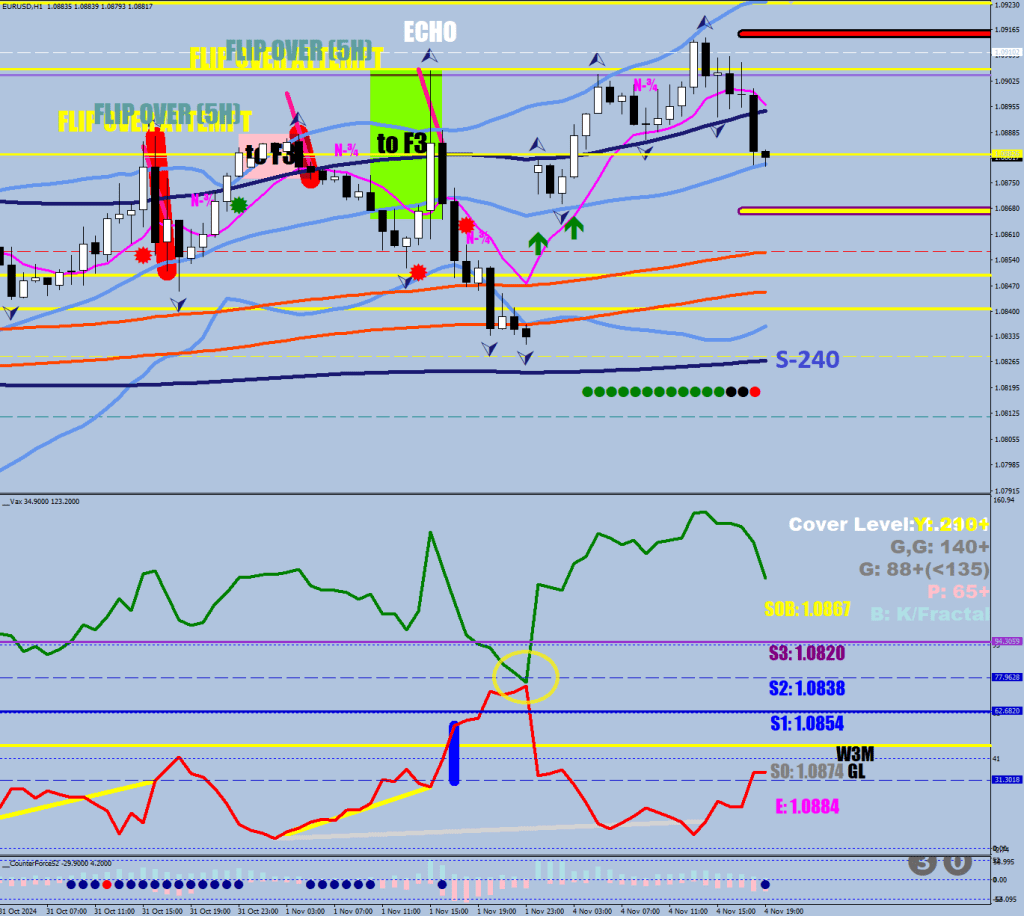
So far the rally stayed within the moratorium of the Echo, but another higher high would be necessary for a gray divergence (the second hour would have to touch the 8-EMO on the way down).
I made an article about Gaps before saying that if the price is near the S-240, the gap would be away from it.
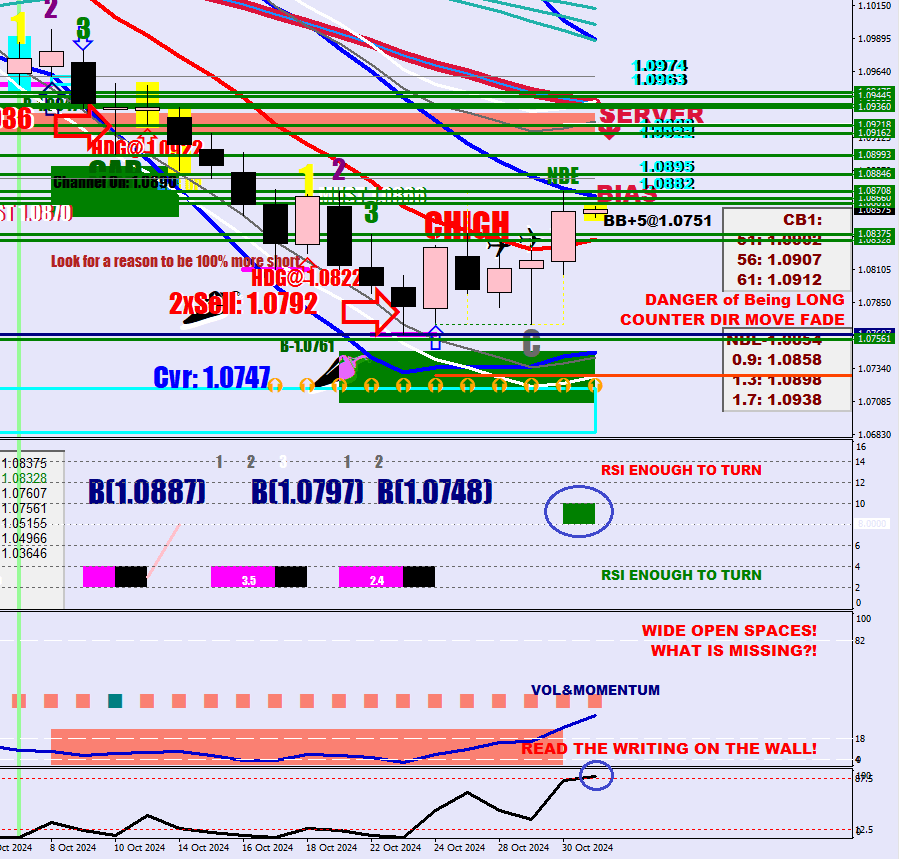
The current cover level is projected at 1.0931 – 53 pips from the 10-sample low.
Will need to see another green loop hooking back and printing another pink slip.

cover level added in magenta

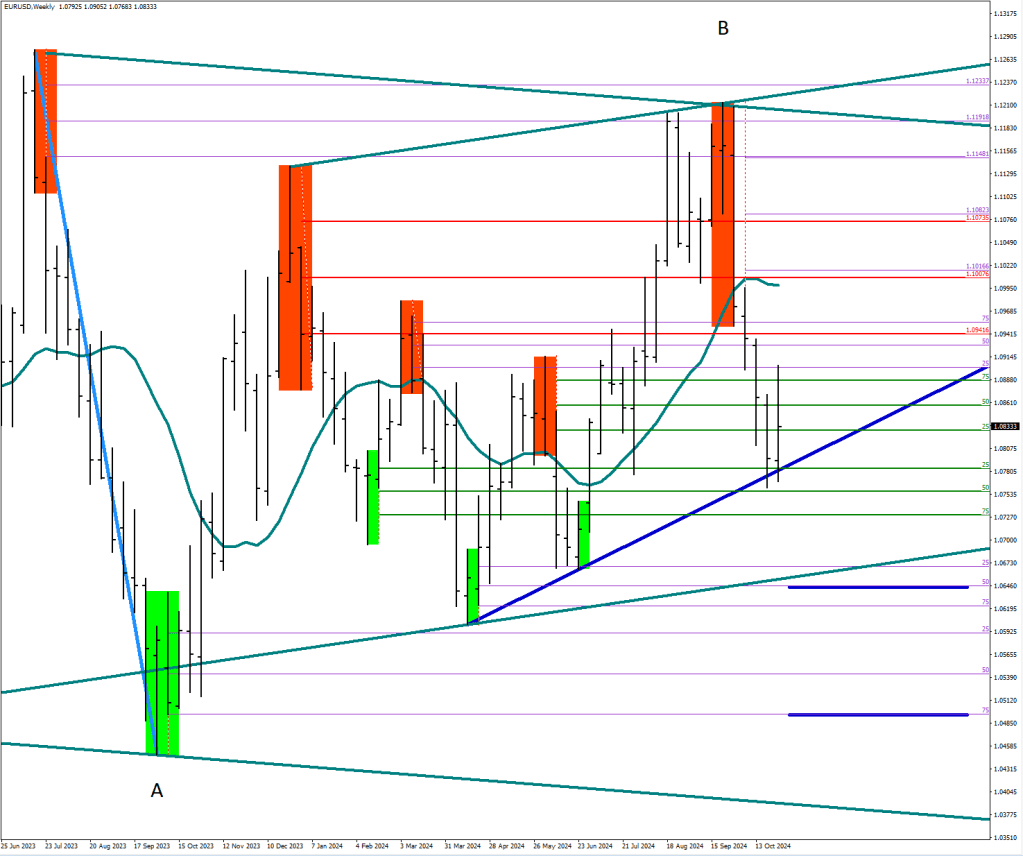
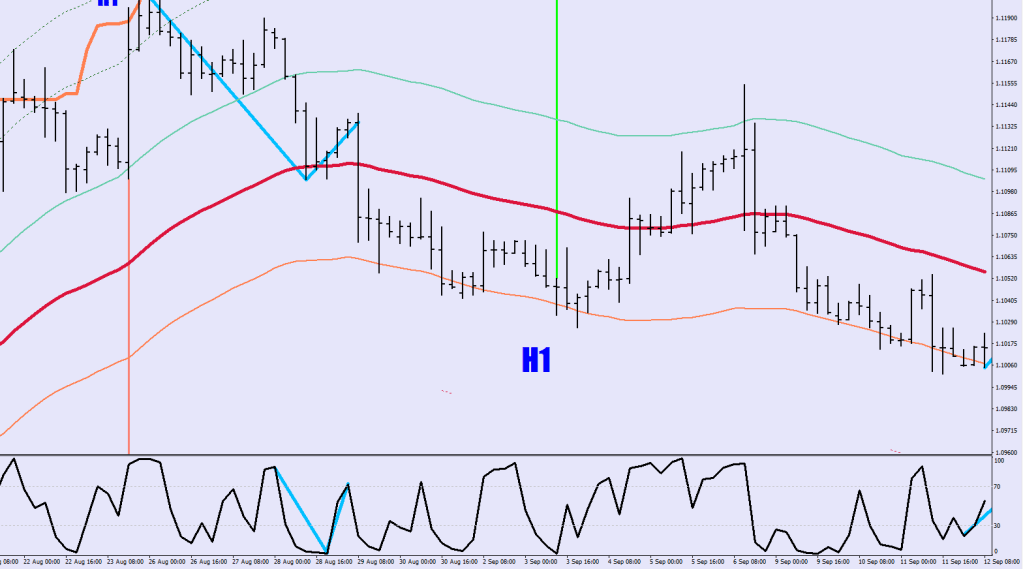
Not a large sample size, but two things I’ve noticed.
Regardless of the direction of the wave structure, within the correction, there is a fast direction and a slow one.
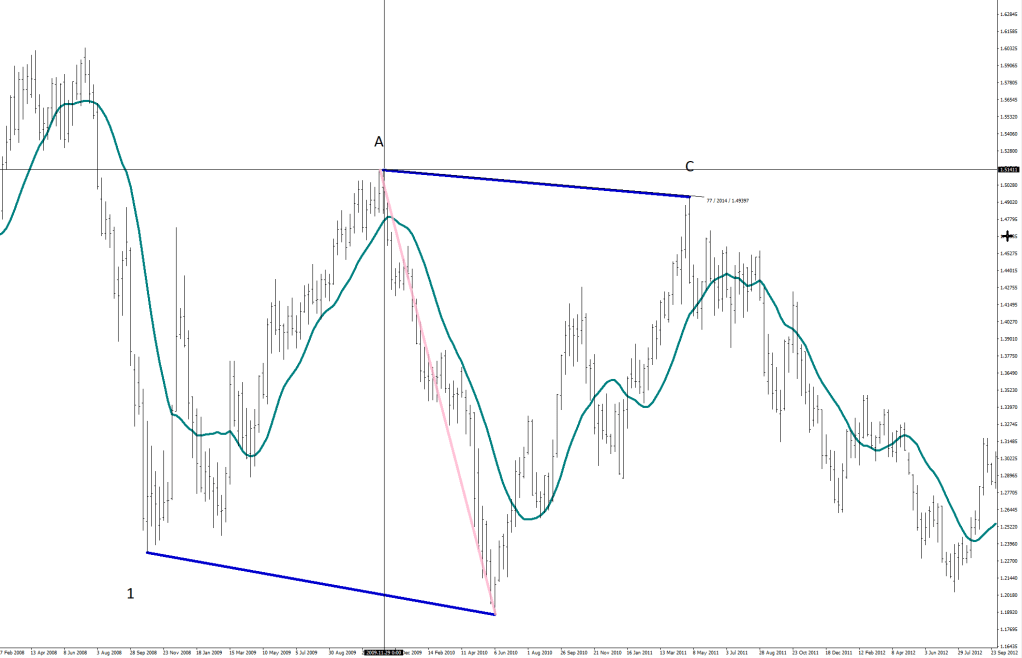
I highlighted the B leg for taking less time to cover the same distance in pink since it is in the direction of the 5-wave structure.
I highlighted the A and the C legs for being the rapid legs against the overall move in light blue.
The first conclusion is that regardless of the shape being expansionary or contractionary (due to the direction of the quick legs) the C had a shortfall of the A by about 200 pips. Interesting coincidence.
Guess where a 200-pip shortfall would put the C terminal at.
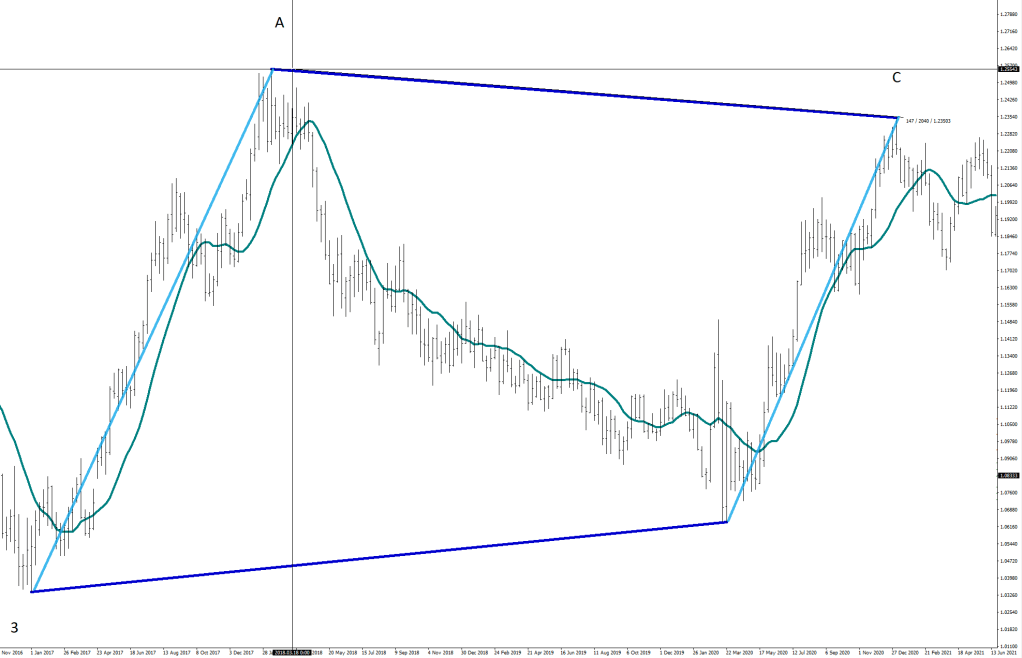
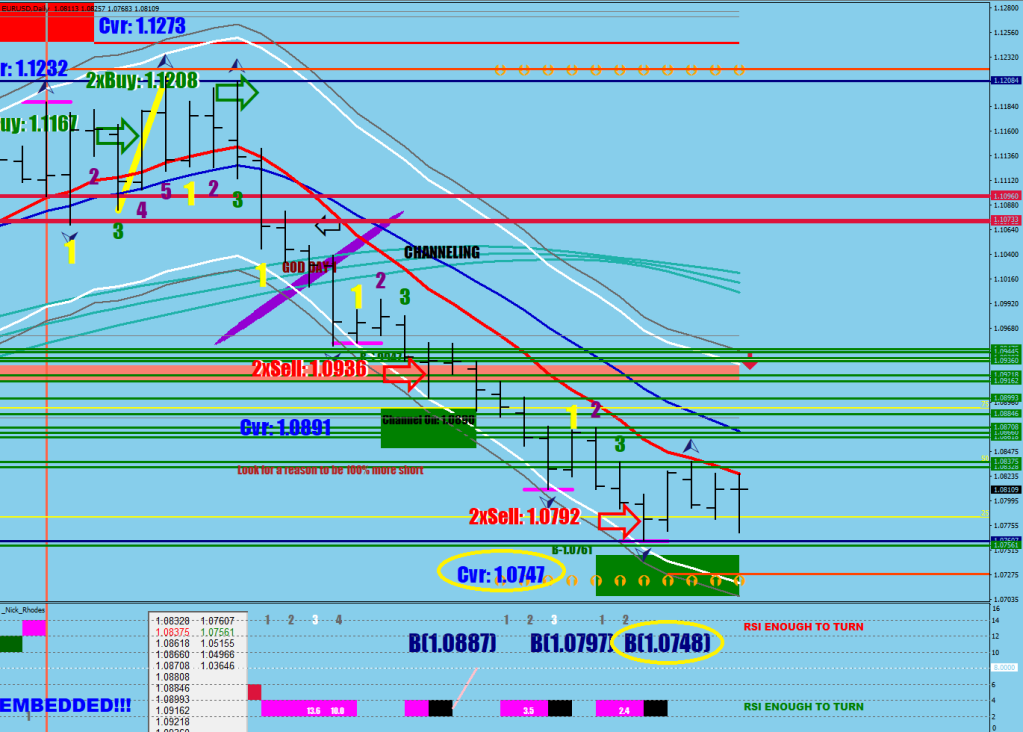
After 5 waves down, the move up has triggered an extensive correction.
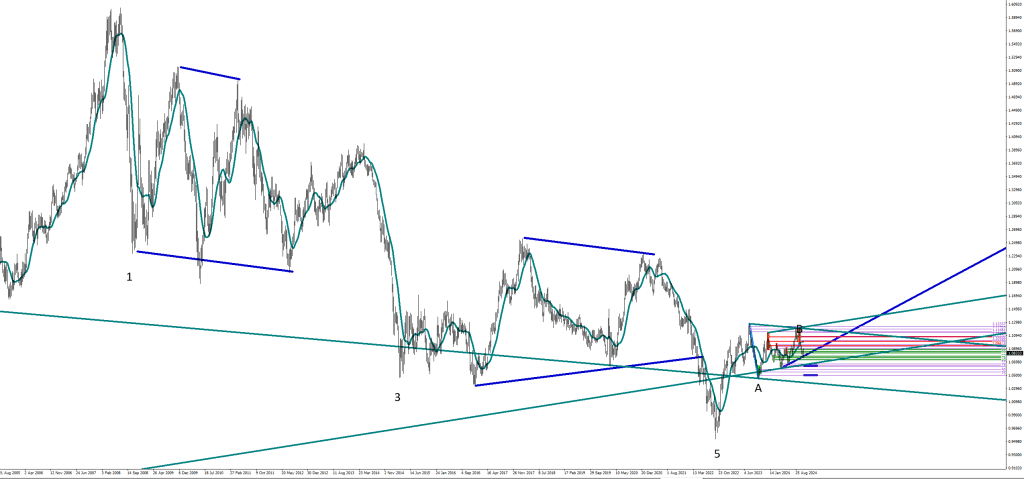
The light blue is the 1st post of the corrective structure (leg A).
Currently in leg C. The 3 options that I think are plausible here: a contracting structure where the inner swing low holds in a parallel with the last two inner swing highs is the 1.0673-1.0640 area.
The second possibility is a contraction to a lesser degree where the outer swing low holds. That’s the second horizontal line at 1.0490 or so.
The third option for the Wave 5 finish of the C Leg would tag the teal trendline for a flat correction at the astonishing level of 1.0380 or lower.
I think tagging the 14 SMA option was an option a few weeks ago, but it isn’t now.
This was released on Achilles Day.
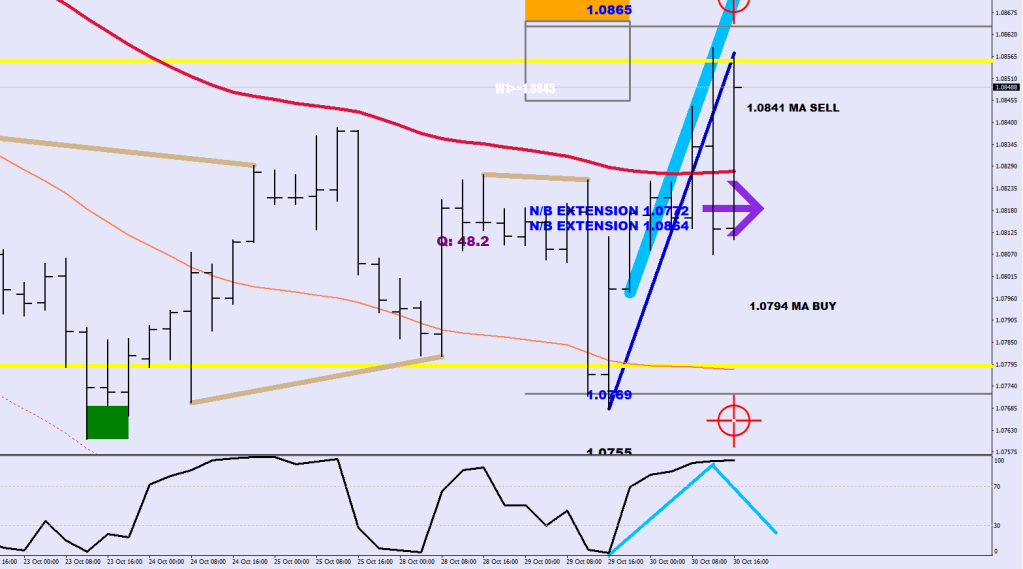
This was my analog for a W4 turn.
As you can see there were 3 failures at the guard rail for the first leg as well as the third.

If the price turns back up around the guard rail below, the Wave 4 continues as planned.
If the low gets taken out by the move down (1.0760) then you are in Wave 5 which would mean the last leg down.
The other rhyme/symmetry was the beginning of the 3rd wave up and the end of it (driven thrusts).

I personally think that you have seen the entire W4 already, but would go into a full hedge at the lower guard rail (1.0790ish) just in case.

A corrective structure.
The A5-B3-C5 patterns consist of zigzags.
Didn’t I just say that this move-up could be Wave 1 (from the orange-shaded root)?
First of all, we have not had a Wave 4 yet. Apparently, every C wave is made up of 5 waves.
A 5 wave up move not a correction. An ABC with a 5-3-5 structure qualifies.
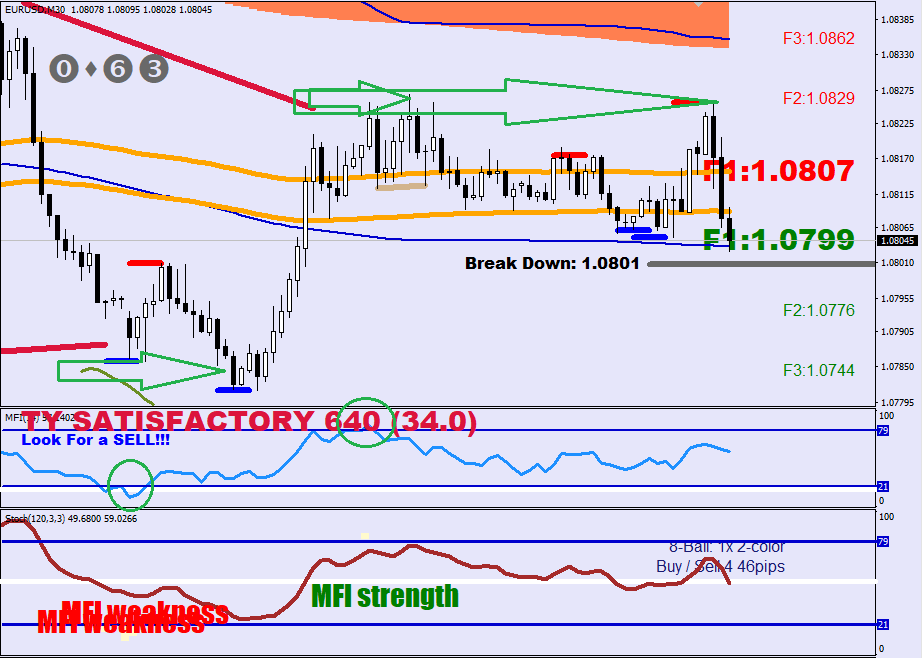
This was a mean reversion to the S-20. The stochastic embedding is now lost. The daily RSI2 has reached a level that registers as excessive, and so this could be all that she wrote for a counter move before Wave 5 down.
In the first image, you can see the 80-pip checkpoint, at 1.0791. Breaking that would clarify the intention of making that missing lower low. A typical beat would be 16 pips beyond the previous low, so around 1.0745.
If things really get rolling, the 1.0708 target would be the second important beat a Wave 5 could be making.
Once you have the E-9 Daily Band in place and you plot the guard rails 1-fluctuation maximum out, you may start to ponder if the breach of the E-9 is a must for a Wave 1 print, and perhaps something else may be required before a Wave 3 can commence.

Such a system makes sense to me, even if some of the first waves would later be renamed as an A.

The 4H RSI2 HL2 has to print an overbought/oversold value (70+, 30-) at the end of Wave 2 before the rest of the structure can commence.
At times the pullback may be so shallow, that it would become a target for a beat.

These “Expansions” are suggestive of a corrective structure.
All in all, Wave 2 seems to always end in a Lower High / Higher Low.
Like I said before, my proxy on the 4H for the E-9 is E-52. The FMax value is 38.4 pips measured from the E-52 Lows and the E-52 highs.
Volatility trading is a very complex subject.
A breaker wave is when a counter wave becomes strong enough to reverse the current.
No clue about how the sell-side operates yet, but spotted something about the long side.
Lime Green Plots.


if (ExtATRBuffer[i]>33 && ExtATRBuffer2[i]>15 && ExtATRBuffer2[i+1]<15 && Close[i]>Open[i]-50*Point && !(ExtATRBuffer[i]>41 && ExtATRBuffer[i]<53)){
            ObjectCreate("LINUSS"+IntegerToString(i),OBJ_VLINE,1, Time[i], 0);
            ObjectSet("LINUSS"+IntegerToString(i),OBJPROP_COLOR,clrLimeGreen);
            ObjectSet("LINUSS"+IntegerToString(i),OBJPROP_WIDTH,6);
            ObjectSet("LINUSS"+IntegerToString(i),OBJPROP_STYLE,STYLE_DOT);
            ObjectSet("LINUSS"+IntegerToString(i),OBJPROP_BACK,1);
}
The other subject would have been about immunity. Nothing scientific, just pure statistics.
  if (Low[i]>iBands(symbol,0,240,2,0,PRICE_MEDIAN,MODE_LOWER,i) && !((Low[i+1]<iMA(symbol,0,207,0,MODE_EMA,PRICE_LOW,i+1) && Close[i+1]>iMA(symbol,0,207,0,MODE_EMA,PRICE_LOW,i+1)) || (Low[i+2]<iMA(symbol,0,207,0,MODE_EMA,PRICE_LOW,i+2) && Close[i+2]>iMA(symbol,0,207,0,MODE_EMA,PRICE_LOW,i+2))))
             {ObjectSet("LINUS"+IntegerToString(i),OBJPROP_COLOR,clrGray);
             if (ExtATRBuffer2[i]<6) ObjectSet("LINUS"+IntegerToString(i),OBJPROP_COLOR,clrBlack);
             else if ((ExtATRBuffer2[i]>ExtATRBuffer2[i+1]) || ExtATRBuffer2[i]>30) { ObjectCreate("LINUSZZS"+IntegerToString(i),OBJ_TEXT, 2, Time[i],25);
               ObjectSetText("LINUSZZS"+IntegerToString(i),"14Hrs Immunity", 16, "Impact", clrDarkGreen);
               if (magenta[ArrayMaximum(magenta,100,i)]>0) ObjectSetText("LINUSZZS"+IntegerToString(i),"18Hrs Immunity", 16, "Impact", clrDarkGreen);

             }
               if (Low[i+1]-iBands(symbol,0,240,2,0,PRICE_MEDIAN,MODE_LOWER,i+1)>240*Point)
               {ObjectCreate("LINUSZZZ"+IntegerToString(i),OBJ_TEXT, 1, Time[i],15);
               ObjectSetText("LINUSZZZ"+IntegerToString(i),"Dip Below 8-24 pips=buy", 16, "Impact", clrGreen);}
             }
             if (((ExtATRBuffer[i]<42 && ExtATRBuffer[i+1]>42) ) && Close[i+2]<iBands(symbol,0,240,2,0,PRICE_MEDIAN,MODE_LOWER,i+2) && Close[i+1]>iBands(symbol,0,240,2,0,PRICE_MEDIAN,MODE_LOWER,i+1))
             {ObjectSet("LINUS"+IntegerToString(i),OBJPROP_COLOR,clrGray);
               if (ExtATRBuffer2[i]<6) ObjectSet("LINUS"+IntegerToString(i),OBJPROP_COLOR,clrBlack);
               ObjectCreate("LINUSZZZ"+IntegerToString(i),OBJ_TEXT, 1, Time[i],15);
               ObjectSetText("LINUSZZZ"+IntegerToString(i),"Dip Below 8-24 pips=buy", 16, "Impact", clrGreen);
               if (Low[i+1]<iBands(symbol,0,240,2,0,PRICE_MEDIAN,MODE_LOWER,i+1)) {ObjectSet("LINUS"+IntegerToString(i),OBJPROP_COLOR,clrBlue);
                  ObjectCreate("LINUSZZS"+IntegerToString(i),OBJ_TEXT, 2, Time[i],25);
                 ObjectSetText("LINUSZZS"+IntegerToString(i),"64Hrs Immunity", 16, "Impact", clrDarkGreen);
               }
             }

if (Close[i]>iBands(symbol,0,240,2,0,PRICE_MEDIAN,MODE_LOWER,i)-50*Point && Close[i+3]<iBands(symbol,0,240,2,0,PRICE_MEDIAN,MODE_LOWER,i+3)){ ObjectSet("LINUS"+IntegerToString(i),OBJPROP_COLOR,clrMagenta);
                 ObjectCreate("LINUSZZS"+IntegerToString(i),OBJ_TEXT, 2, Time[i],25);
                 ObjectSetText("LINUSZZS"+IntegerToString(i),"46Hrs Immunity", 16, "Impact", clrDarkGreen);
There is an Echo printing on the upside. The upside would have failed at the S-356 band if the next hour would not be able to take out the fractal high.
1.0747-48 keeps coming up
There are two possibilities for getting out of jail currently.

There is a lesser chance, but a possibility that the C leg down does not get much beyond the squaring leg.
There is a higher chance that a lower low would be made.

The red arrow is a relative weakness with the 3-sample volatility going above 10, yet falling short of the band.
 ///upside fall short of the band
     if (uvol[i]!=0 && Low[i+1]>iMA(symbol,0,8,0,MODE_EMA,PRICE_MEDIAN,i+1)
     && uvol[i]>10 && High[i+1]>iMA(symbol,0,60,0,MODE_SMA,PRICE_MEDIAN,i+1) &&
      High[i]<iBands(symbol,0,60,2,0,PRICE_MEDIAN,MODE_UPPER,i) && uvol[i]>uvol[ArrayMaximum(uvol,3,i+1)] && uvol[ArrayMaximum(uvol,3,i+1)]>uvol[ArrayMaximum(uvol,3,i+4)] && uvol[ArrayMaximum(uvol,3,i+4)]>0){
           ObjectCreate("Citeras"+DoubleToStr(i), OBJ_TEXT, 0, Time[i+2], High[i+2]+90*Point);
           dir[i]=-1;
          ObjectSetText("Citeras"+DoubleToStr(i), CharToStr(222), 44, "Wingdings",  Red);
     }
More tips & tricks?
Both A and B ended after a beat of where the 14-sample 30-minute Money Flow peaked.
Album #35 has sailed out.
