Yes, that was my second guess for a C wave to end at (horizontal blue, on the nose).
So, if a Thrust consolidates, the NBE (No Break Extension level) would become a target prospect.
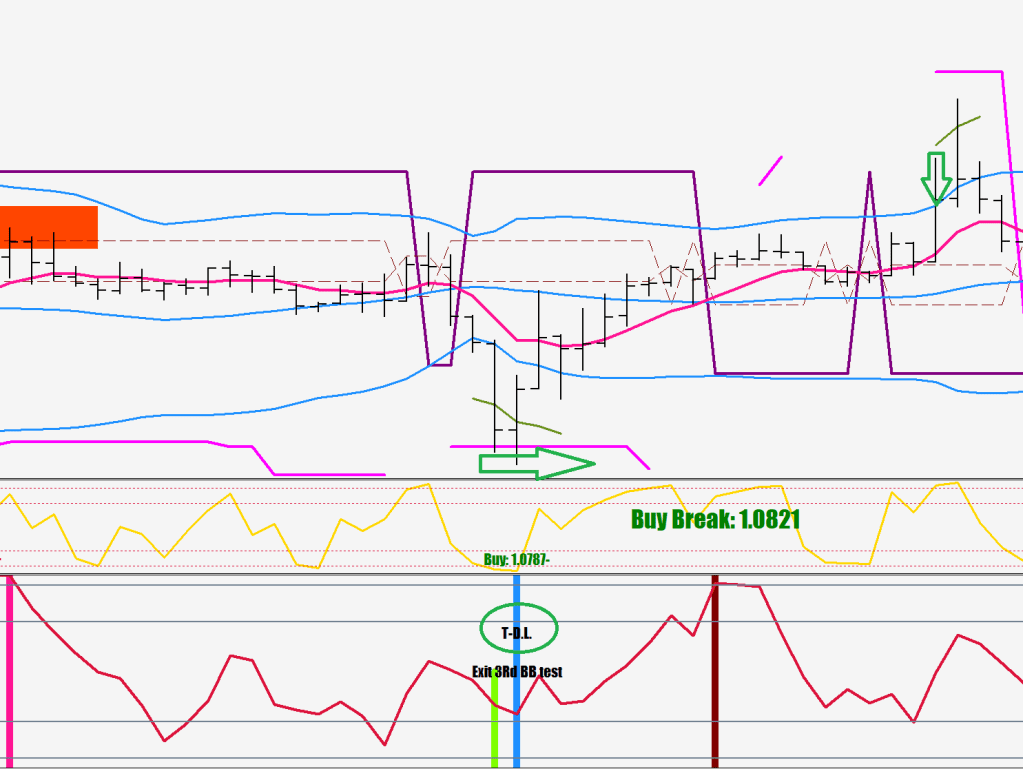
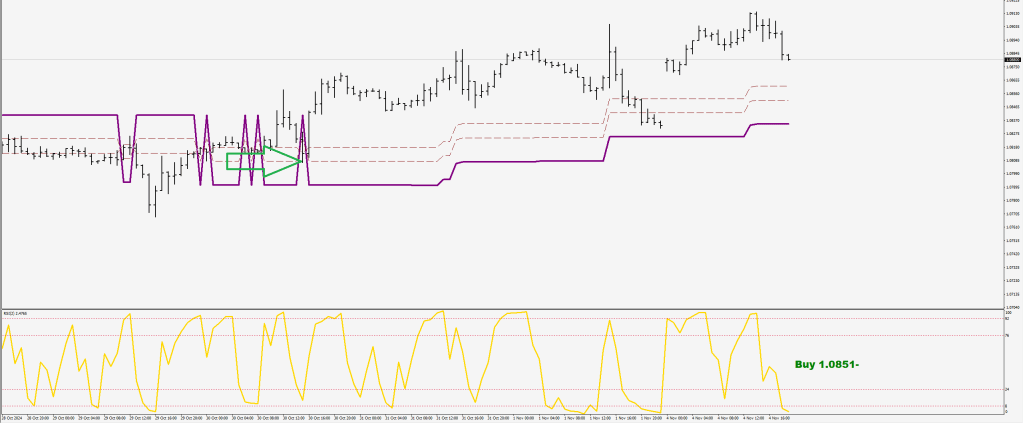
There was a Touchdown low made, so the logical target is the upper 30 sample BB, 3 times to be exact, so a break at the 80 line has a high probability. You should get 23 hours of upside movement at least.
I am not so fond of the gray color, which sort of means too high volatility (5.16x stretch from the E-9), and that normally is not the end of an impulse move.
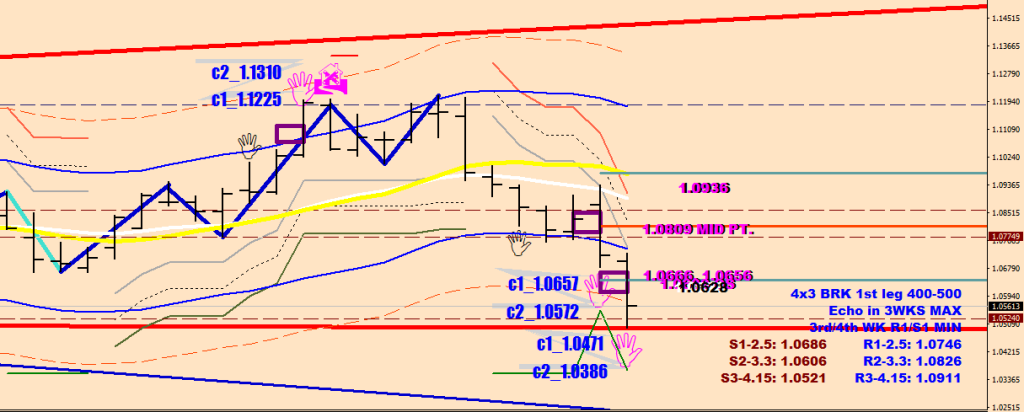
If the week were to close above 1.05863, you may have a swing low in place.
I’m now showing back-to-back push weeks, and the new cover levels are 1.0471 and 1.0386.
Deflationary bust. Whatever that means. Dollar 110 they said.
The current Touchdown low got downgraded (replaced) by a secure low.
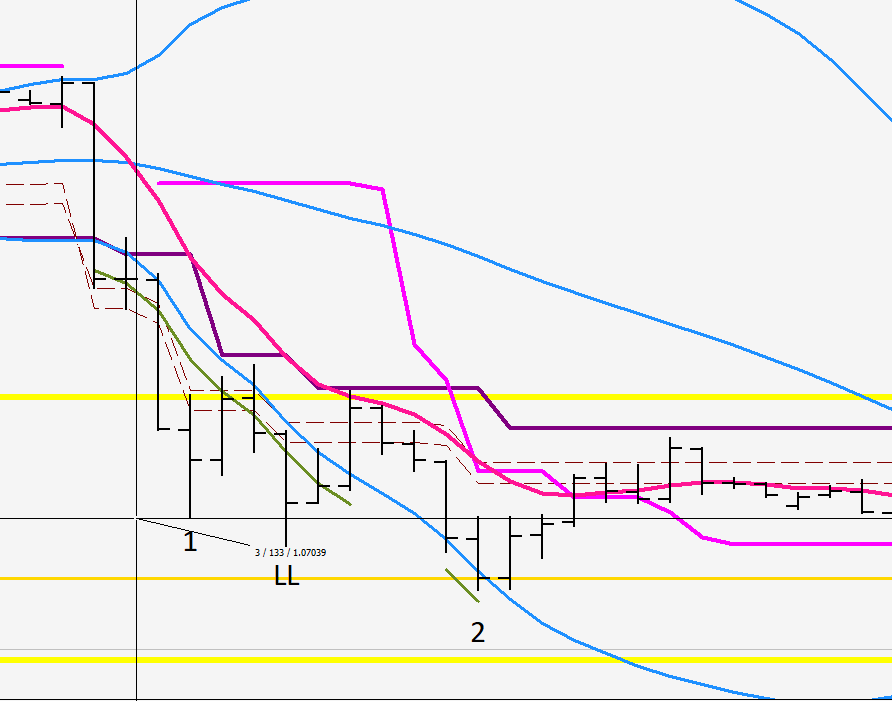
The “2” print of the driven thrust proceeded a bit lower.
An interesting twist was that the LL got undercut first (doubling down) signaling the thrust yet to come.
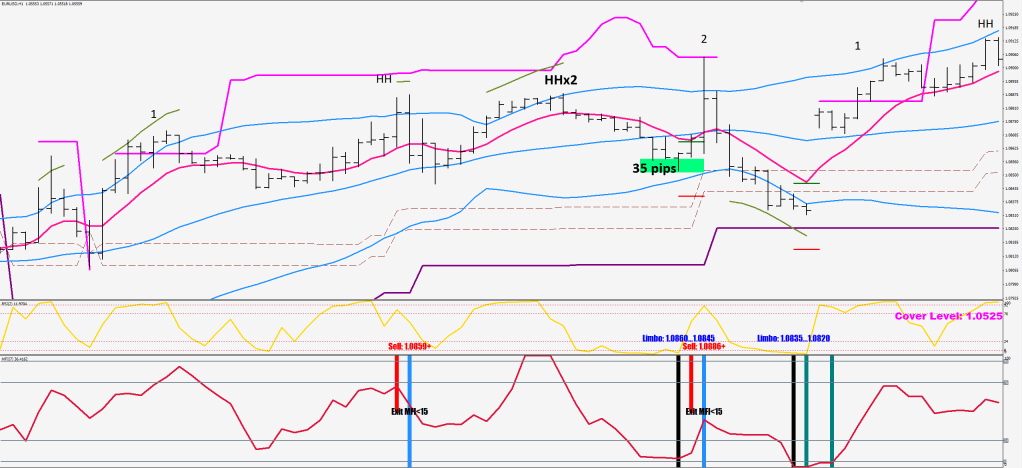
Below is a sample of a similar double down / double up before the SOB 35 pips out.
The bungee move was proportionately muted, 53 pips or so.
BWB stands for BoWBack, SOB is short for Shot Over the Bow, which typically means 47+ pips of a pullback that brings on the final leg that may be in the 70-100 pips range (bungee move).
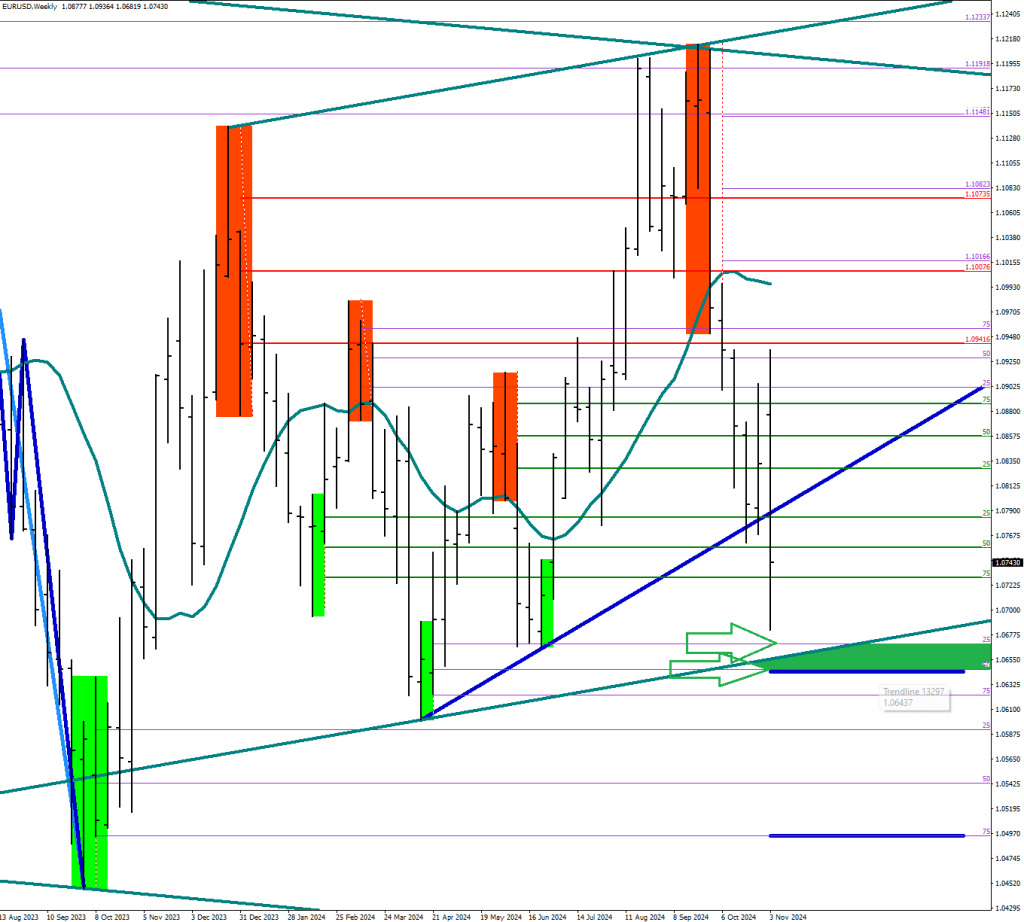
Here’s where we are on the big picture:
In closing here are 3 reasons why you may want to learn the Macdulioff Driven Thrust structures.
They are paying me £11 per hour here in the UK. Every little Phelps.
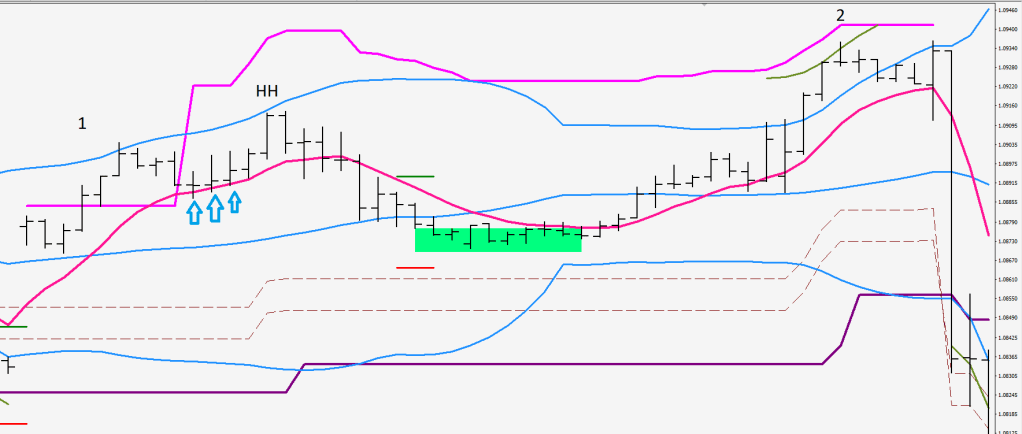
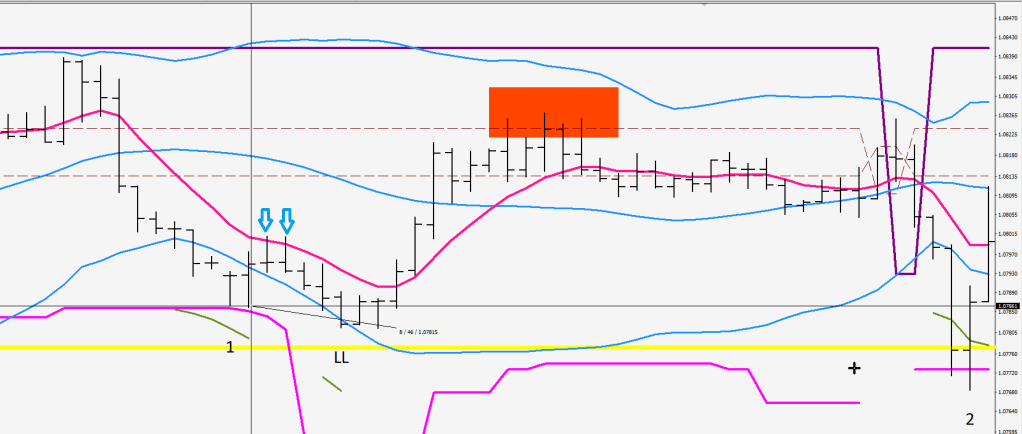
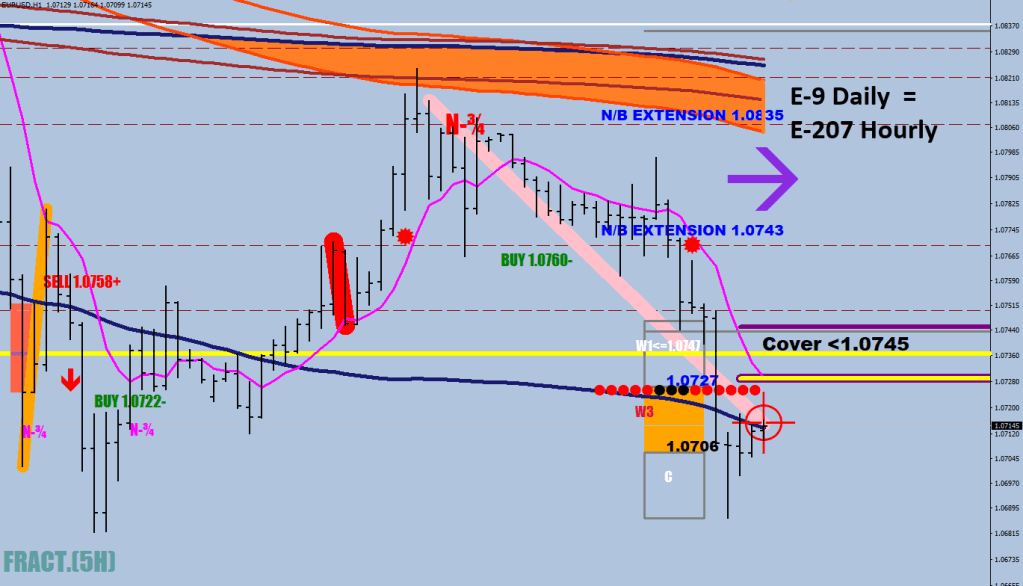
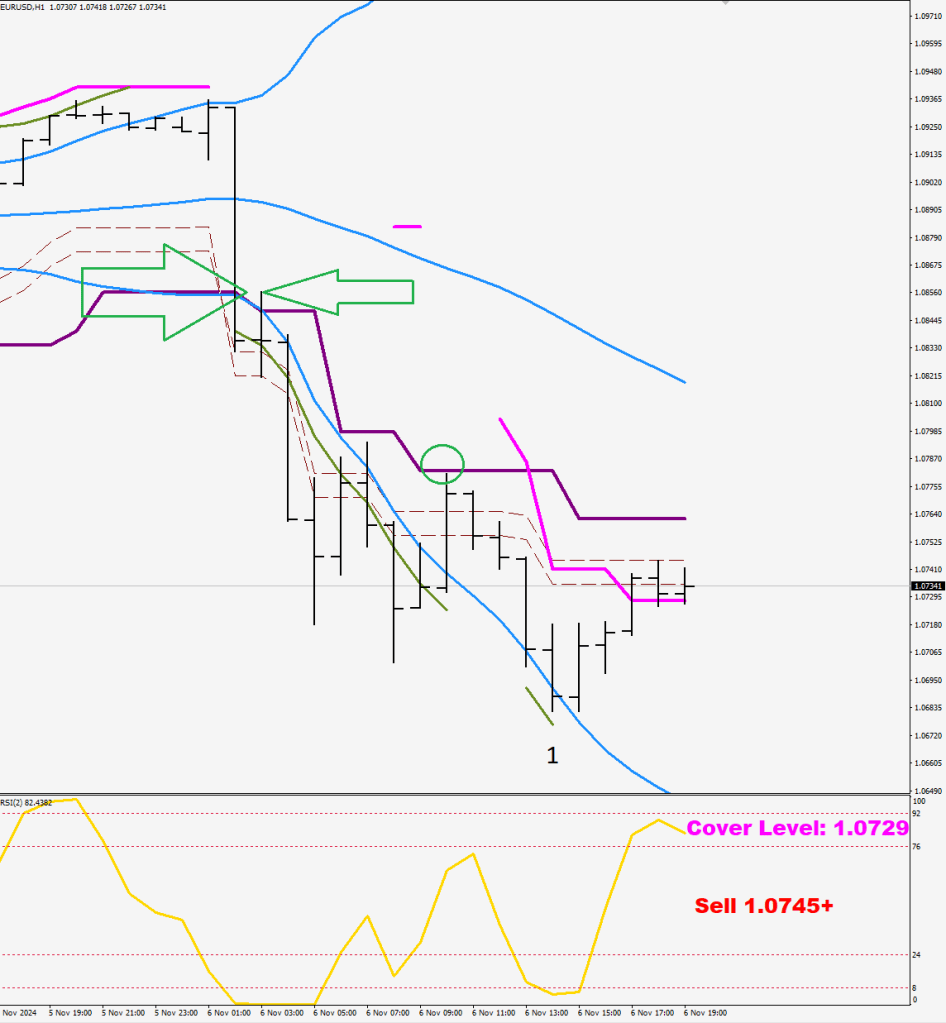
The tendering phase’s 1st leg makes a push outside the cover line (magenta) and proceeds to the W3M. This means the middle of the orange box relative to the last consolidation level.
Then you get a pullback after the end of the first leg, that may not take the price back much beyond the 8EMO (Blue Arrows/ deep pink line).
Then the LL shall be printed that would make a beat beyond the “1” print by 3-14 pips statistically.
After the LL print the Tendering phase is over, and you get a deeper pullback typically beyond the S-30 (middle Bollinger) during extreme volatility the LH pullback would fall shy of the 80-pip line (purple).
The LL-LH pullback is 35-45 pips during peace times, and the thrust to the #2 endpoint is going to print at the cover level (53 pips from the current 10-sample high plus minus 10 pips. The high volatility example shows the 30-sample BB low as a substitute.
The “2” print is the end of the driven thrust structure.
This is a recent find thanks to my search for an objective answer even during increased volatility.
Buying and selling do not behave the same way – perhaps because of the draft present in one direction.
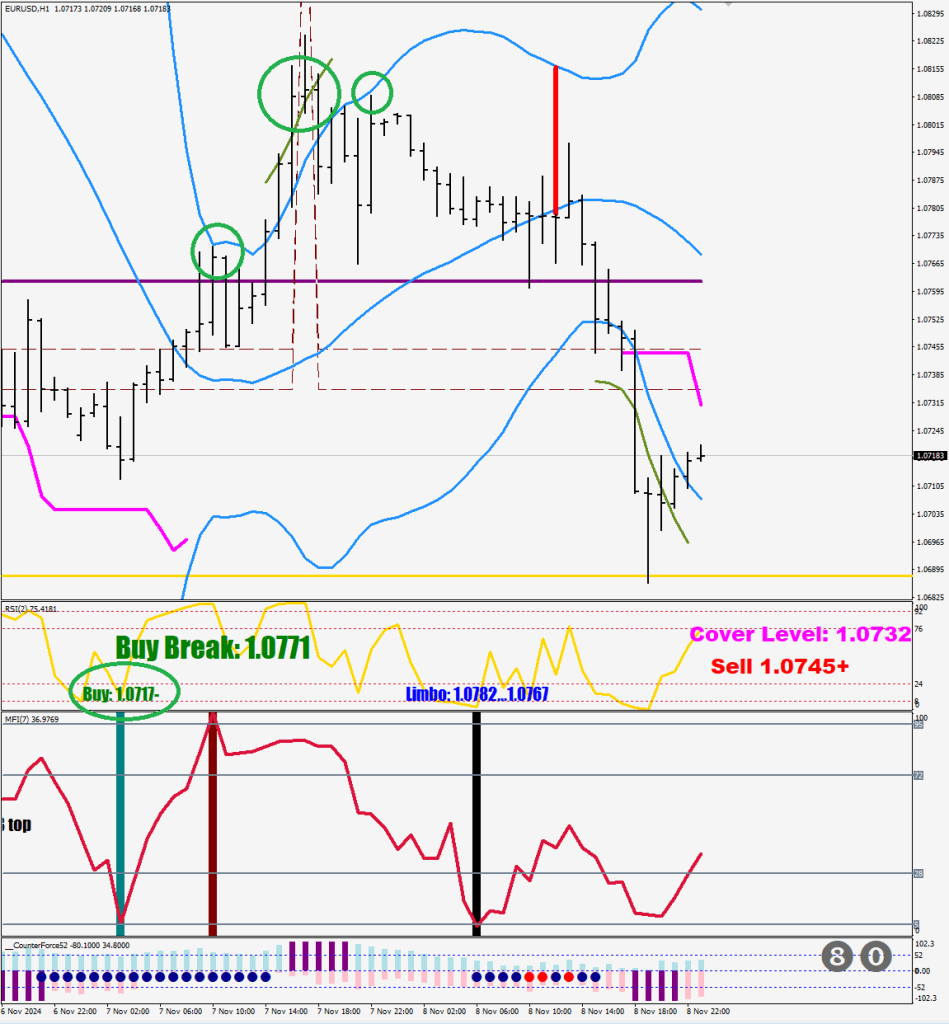
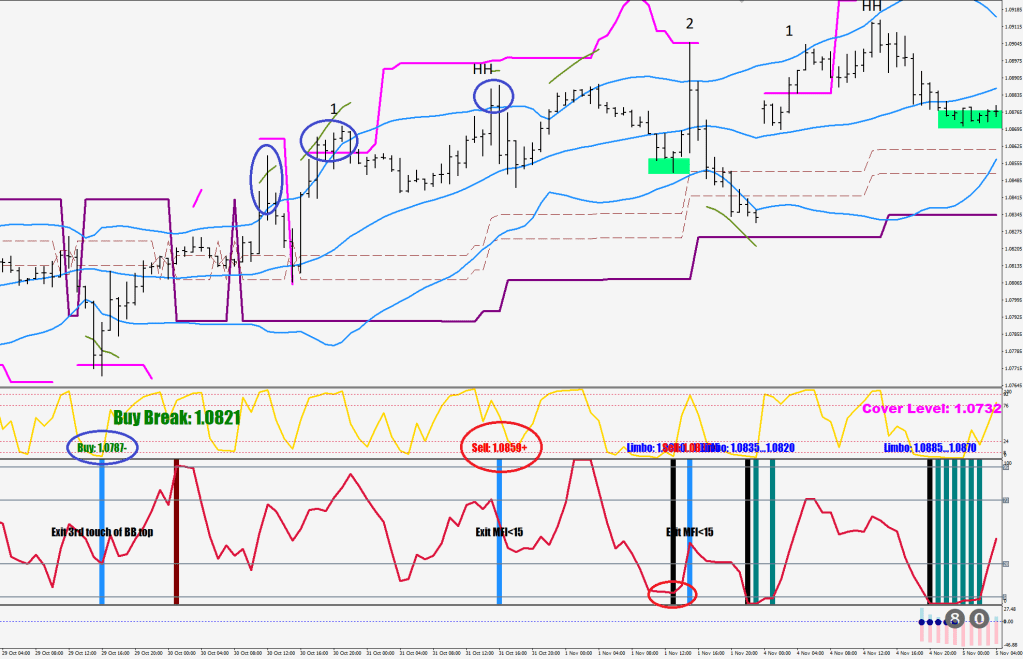
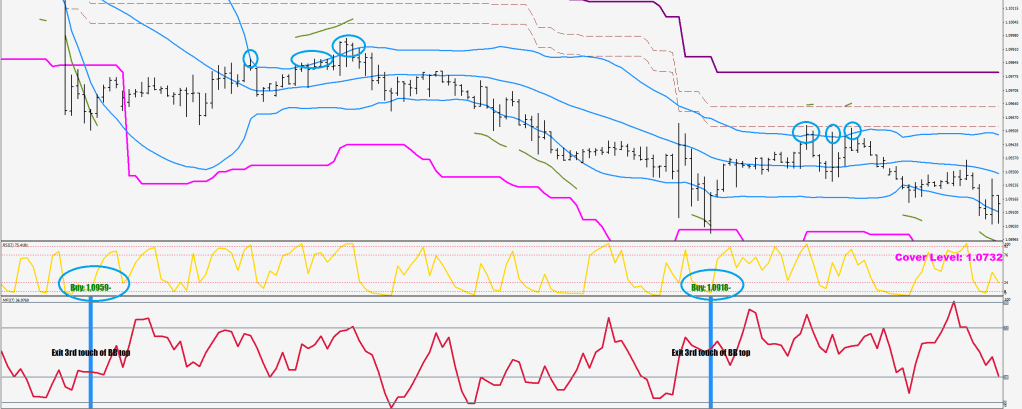
A buy is good for 3 touches (or good attempts) on the upper 30-sample BB.
Whilst the sells seem to last only to the MFI going below 15 – without a break at the 80-line (brown) of course.
The limbo is what they do with the MFI below 8. After the first hourly close, there are another 15 pips of a tolerated zone that they must buy if they are serious.
Taking out the Limbo candle’s high without going below its close by 20 pips is a buy – for a thrust or for 3 failures at the BB.
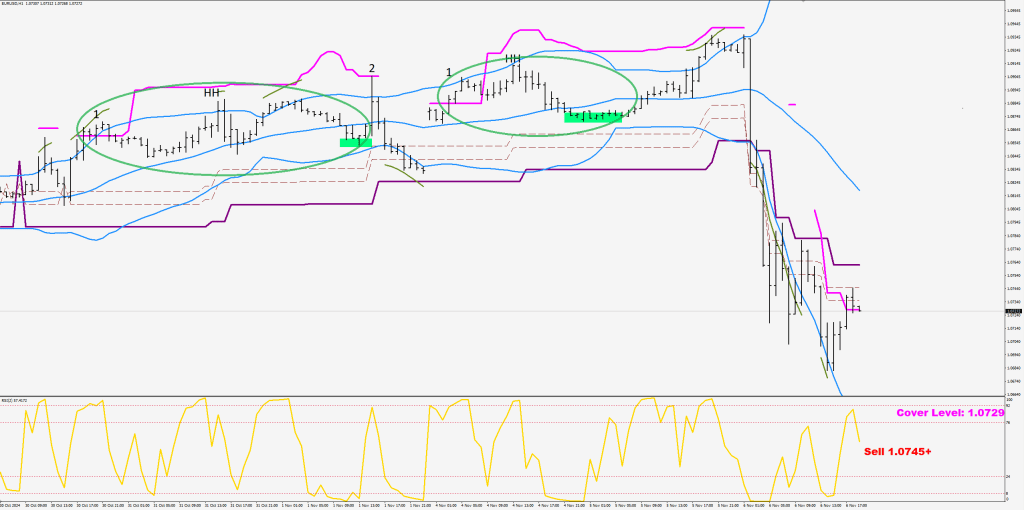
Besides the sell and the buy market, there are different phases.
The market is considered “tendered” after it has made a charge for the cover level and has not yet made the final thrust.
This is a protected mode, where there are at least two distingishable fractals, “1” is the initial charge. The HH or LL print is another (unsuccessful) reach for the cover level.
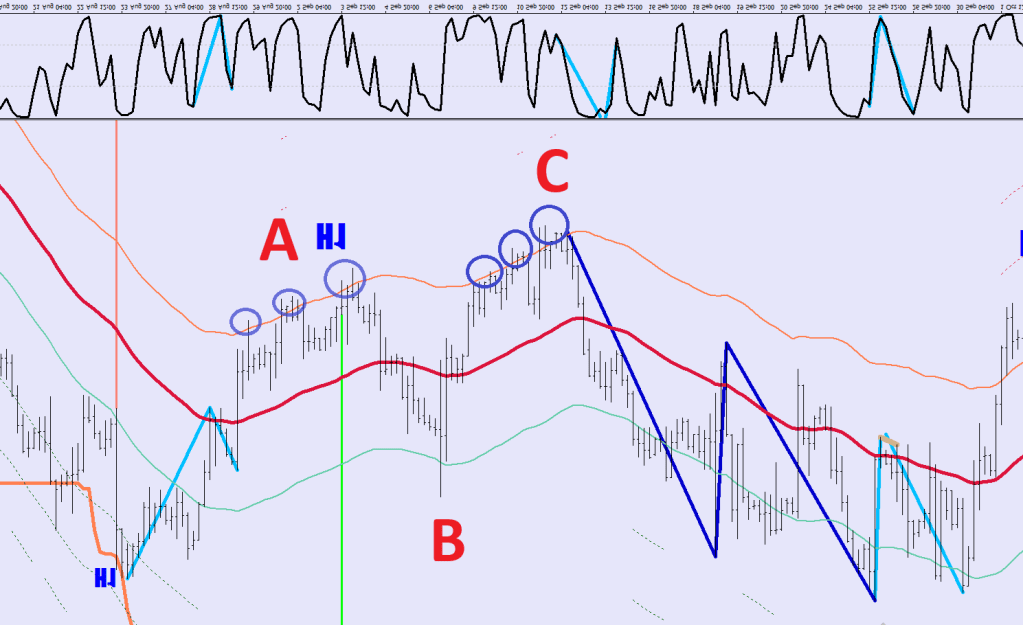
The green ovals are the “tendered” period. They end in a higher low (lower high) before the final thrust (2), which usually would tag the cover line one more time – it fell short in the second example.
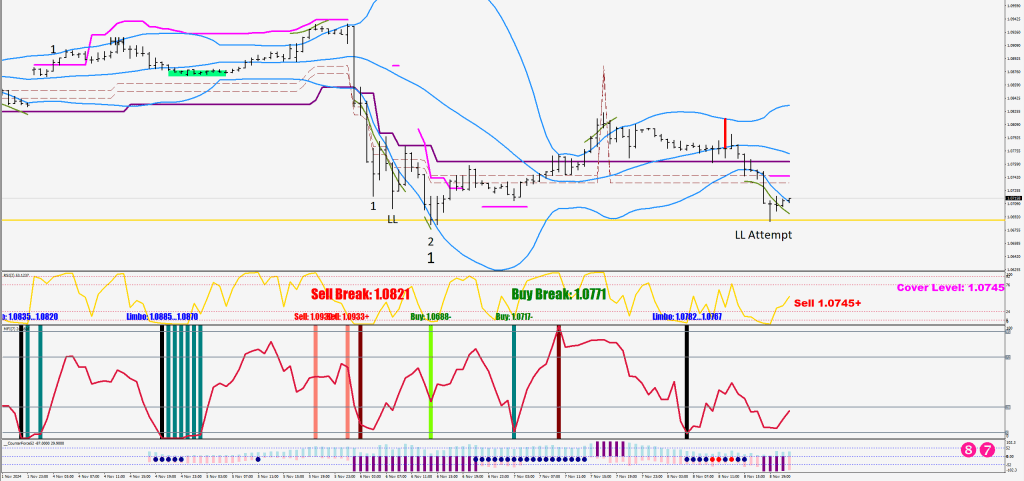
After the market has “thrusted”, there is a window of opportunity for breaking the 80-pip line from the 200-sample high / low, which is what happened here.
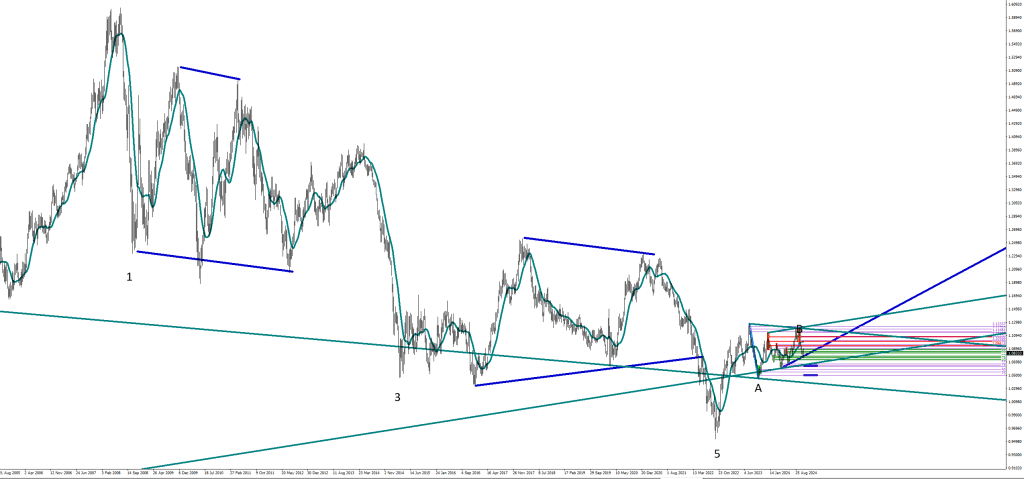
A 250-pip day does not happen often. However, impulse waves do not end in strength, and this Wave 5 would not be an exception.
I would like to call your attention to the market maker squaring wick back to the 80-pip line where they dumped out long holdings (arrows) and the little hoop shows how much the 80-line was respected a bit later.
Right now, there is time needs to be burnt, so that the cover line would end up lower than the swing low (relative to the 10-sample high) and then onto the LL print before the red box and the final thrust (2).
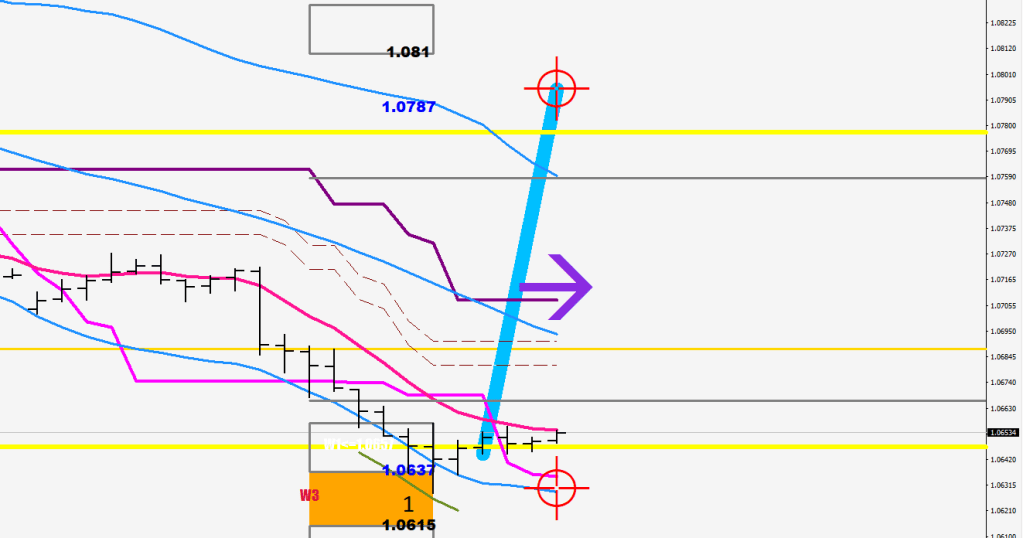
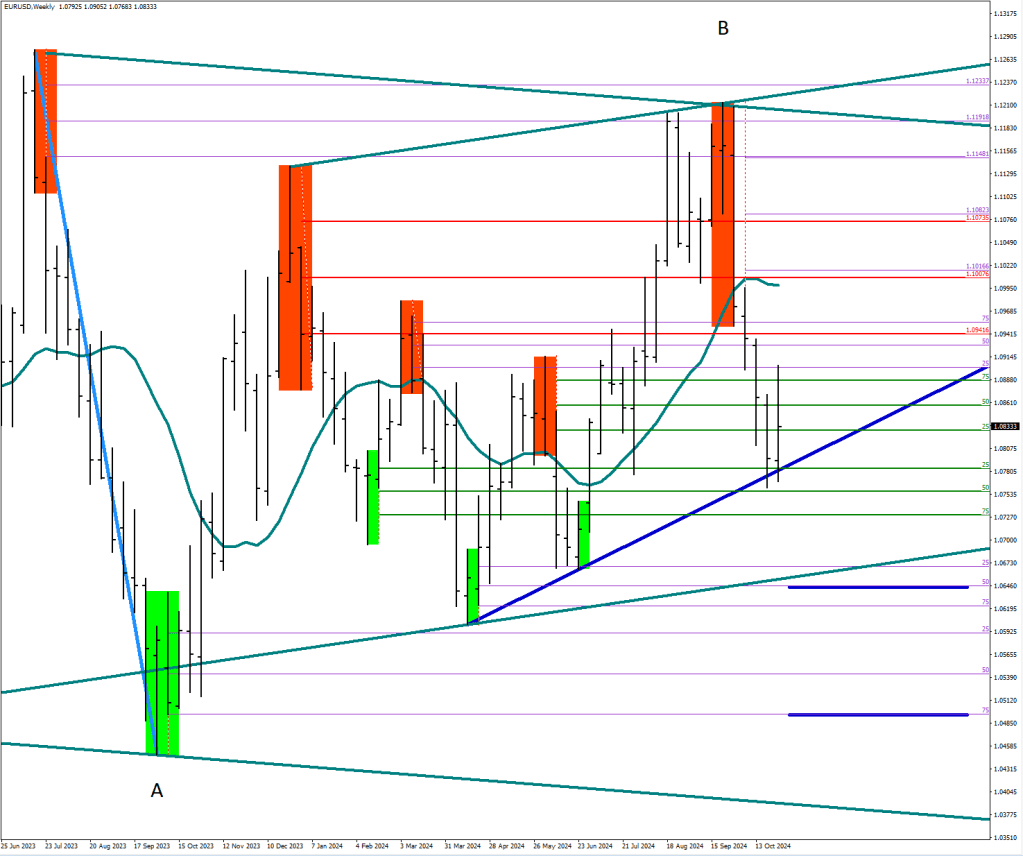
We are going for that 1.0670-1.0643 block.
The pro volume block got picked up in one go, but the low would have to be cut under for max damage.
Wave 3’s waning end missed the cover level even on the first try.
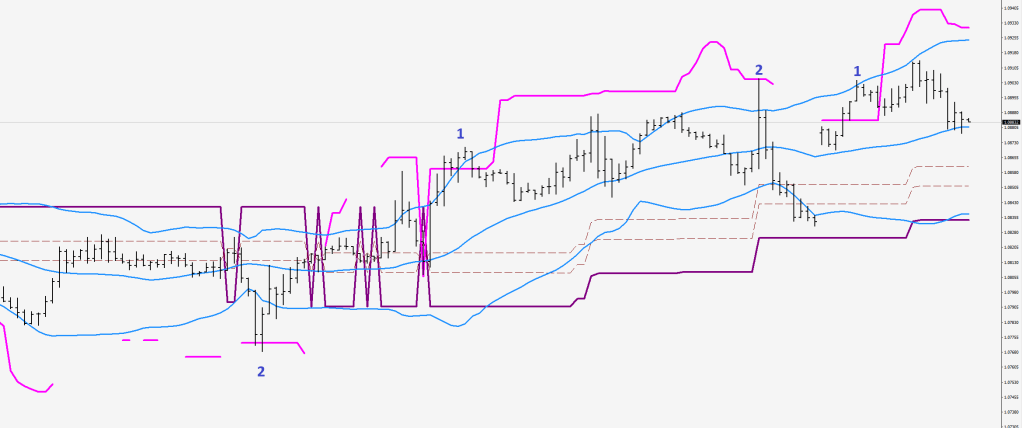
When the purple thing is open on the upside, the market is set to rally.
An optimal buy starts at 63 pips from the recent 200-sample high and is a game till 80 pips.
You can see above as the purple thingy flips from sell to buy.
   if (MathAbs(Close[i]-iLow(symbol,0,iLowest(symbol,0,MODE_LOW,200,i)))<MathAbs(iHigh(symbol,0,iHighest(symbol,0,MODE_HIGH,200,i))-Close[i]))
      {reference[i] = iLow(symbol,0,iLowest(symbol,0,MODE_LOW,200,i));
       L53[i]=reference[i]+530*Point;
       L63[i]=reference[i]+630*Point;
       L80[i]=reference[i]+800*Point;
       if (L80[i]==L80[i+1]) L80p[i]=L80[i];
       else L80p[i]=L80[i+2];
       if (Close[i]<L53[i]) cover[i]=iHigh(symbol,0,iHighest(symbol,0,MODE_HIGH,10,i))-530*Point;
      }
      else {reference[i] = iHigh(symbol,0,iHighest(symbol,0,MODE_HIGH,200,i));
       L53[i]=reference[i]-530*Point;
       L63[i]=reference[i]-630*Point;
       L80[i]=reference[i]-800*Point;
       if (L80[i]==L80[i+1]) L80p[i]=L80[i];
       else L80p[i]=L80[i+2];
          if (Close[i]>L53[i])  cover[i]=iLow(symbol,0,iLowest(symbol,0,MODE_LOW,10,i))+530*Point;
      }
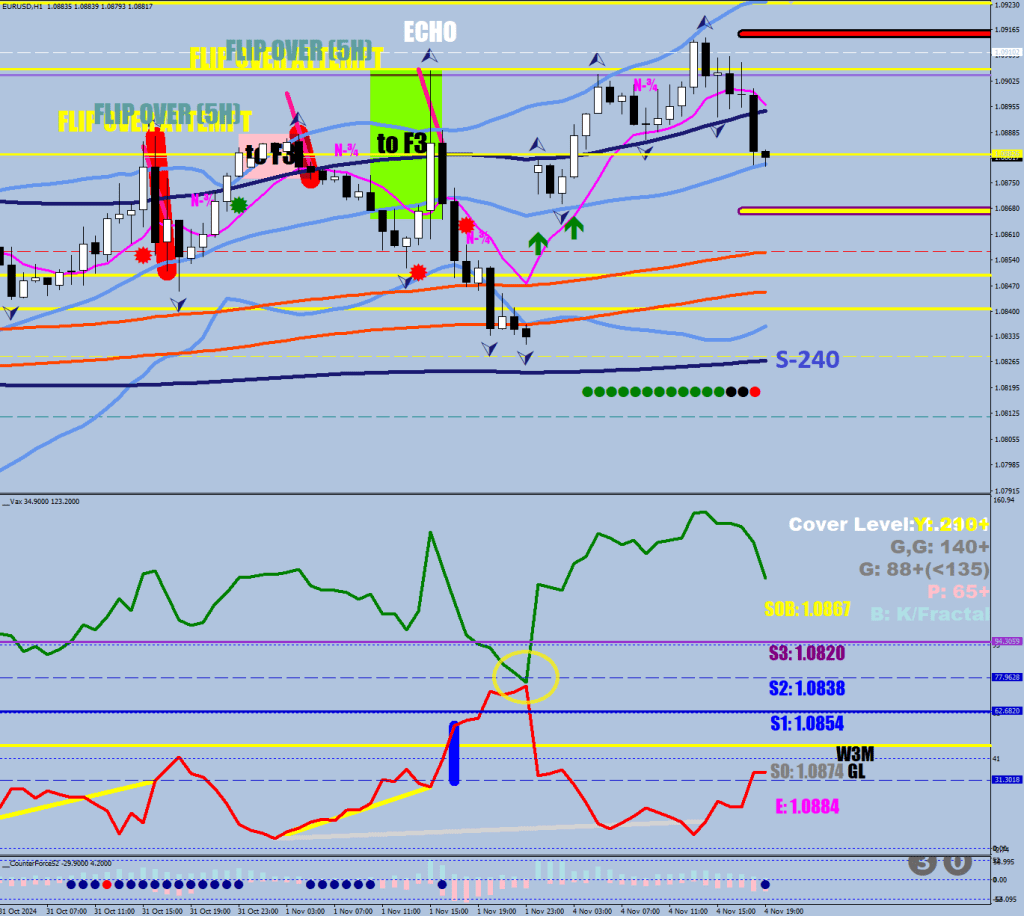
The yellow circle below shows in a different format the high voltage kiss goodbye of the two poles.
So far the rally stayed within the moratorium of the Echo, but another higher high would be necessary for a gray divergence (the second hour would have to touch the 8-EMO on the way down).
I made an article about Gaps before saying that if the price is near the S-240, the gap would be away from it.
The current cover level is projected at 1.0931 – 53 pips from the 10-sample low.
Will need to see another green loop hooking back and printing another pink slip.
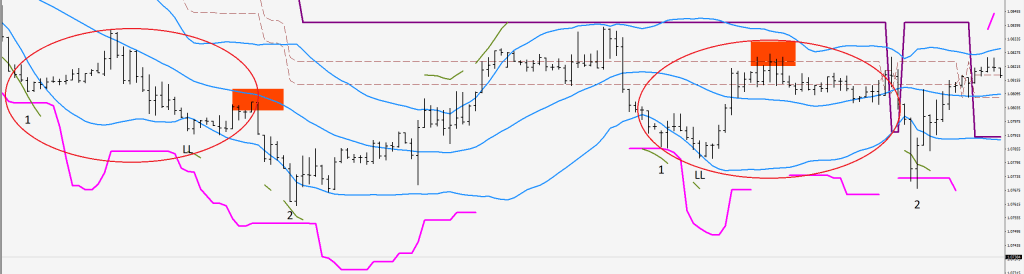
Not a large sample size, but two things I’ve noticed.
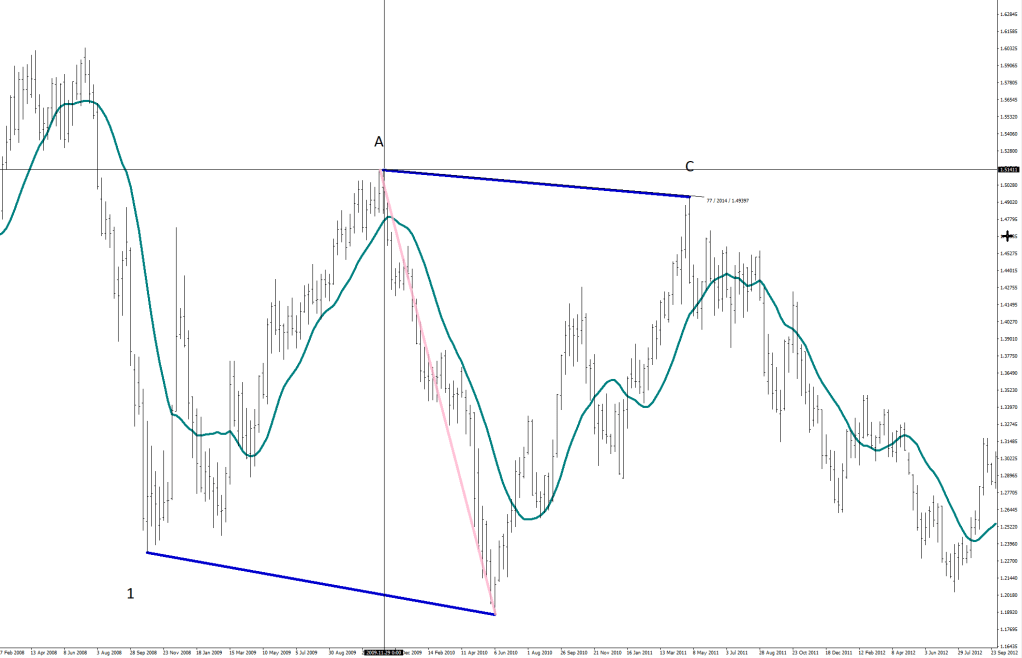
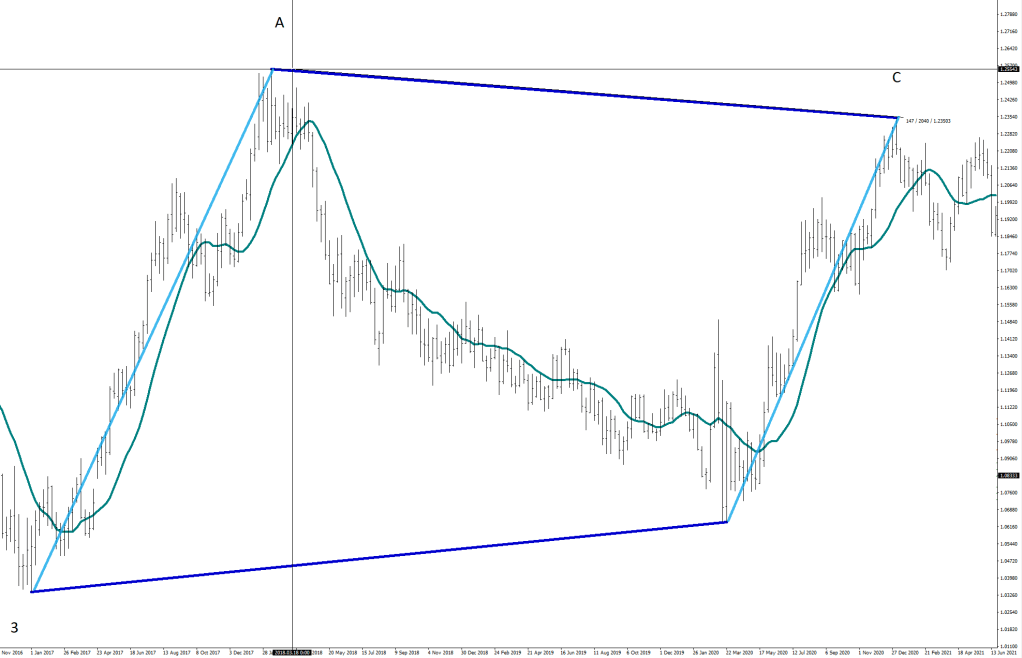
Regardless of the direction of the wave structure, within the correction, there is a fast direction and a slow one.
I highlighted the B leg for taking less time to cover the same distance in pink since it is in the direction of the 5-wave structure.
I highlighted the A and the C legs for being the rapid legs against the overall move in light blue.
The first conclusion is that regardless of the shape being expansionary or contractionary (due to the direction of the quick legs) the C had a shortfall of the A by about 200 pips. Interesting coincidence.
Guess where a 200-pip shortfall would put the C terminal at.
After 5 waves down, the move up has triggered an extensive correction.
The light blue is the 1st post of the corrective structure (leg A).
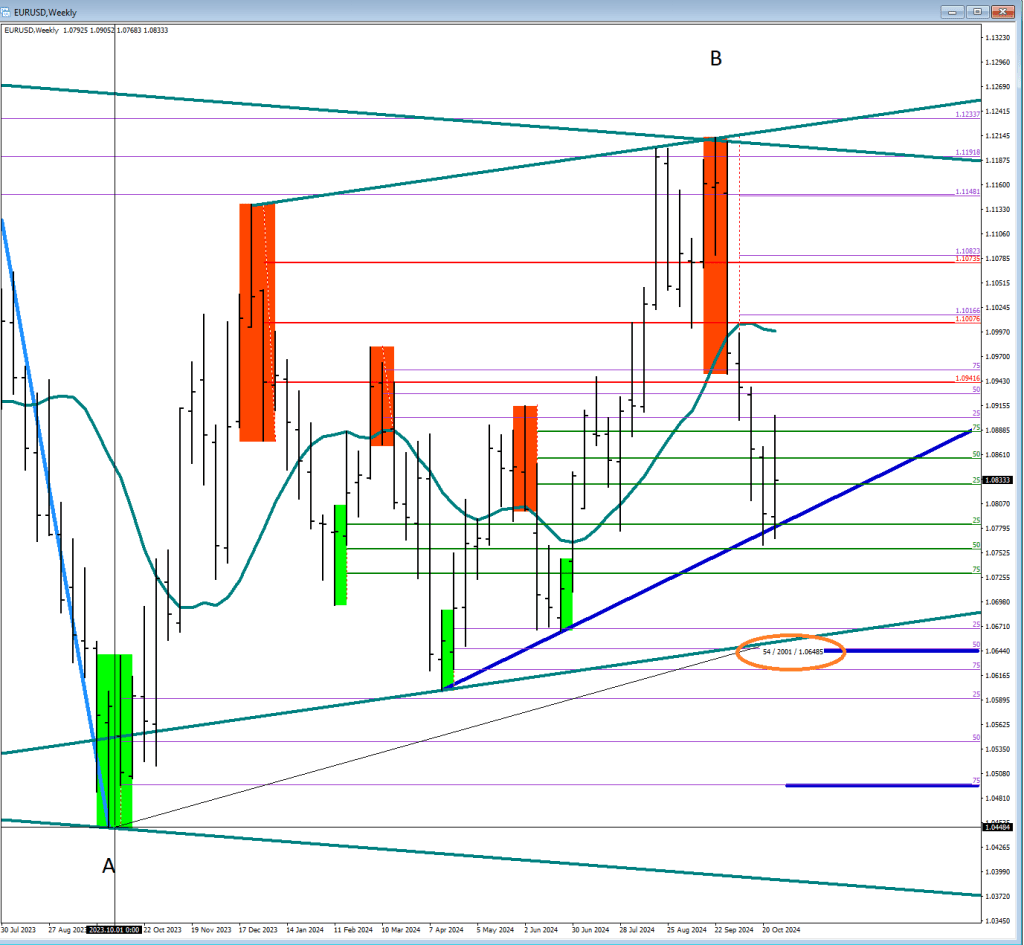
Currently in leg C. The 3 options that I think are plausible here: a contracting structure where the inner swing low holds in a parallel with the last two inner swing highs is the 1.0673-1.0640 area.
The second possibility is a contraction to a lesser degree where the outer swing low holds. That’s the second horizontal line at 1.0490 or so.
The third option for the Wave 5 finish of the C Leg would tag the teal trendline for a flat correction at the astonishing level of 1.0380 or lower.
I think tagging the 14 SMA option was an option a few weeks ago, but it isn’t now.