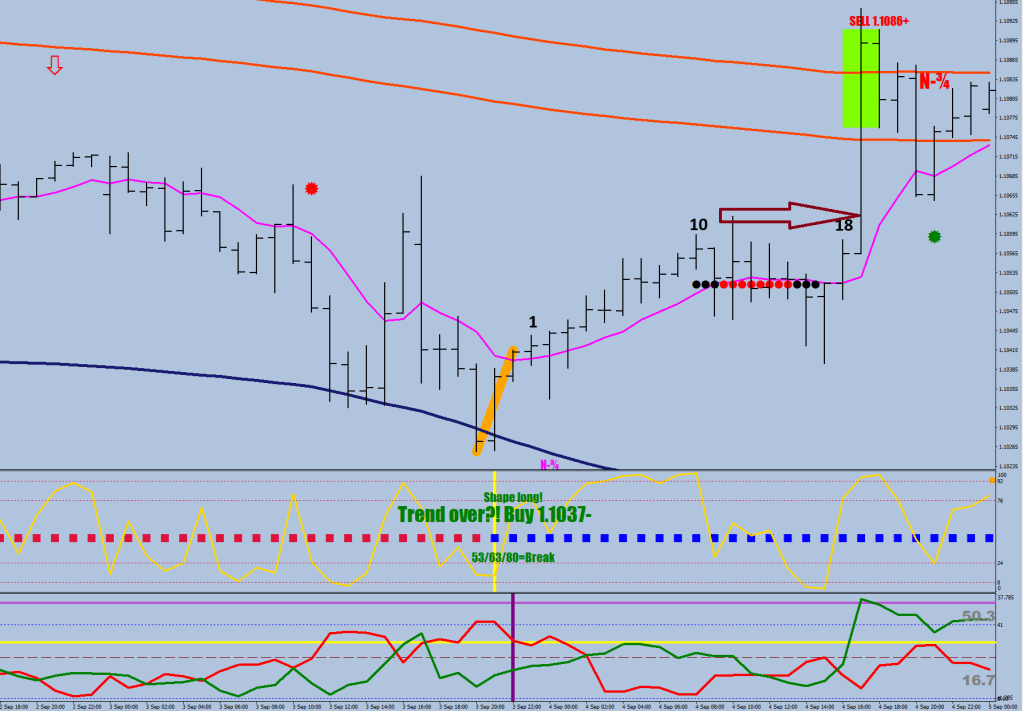
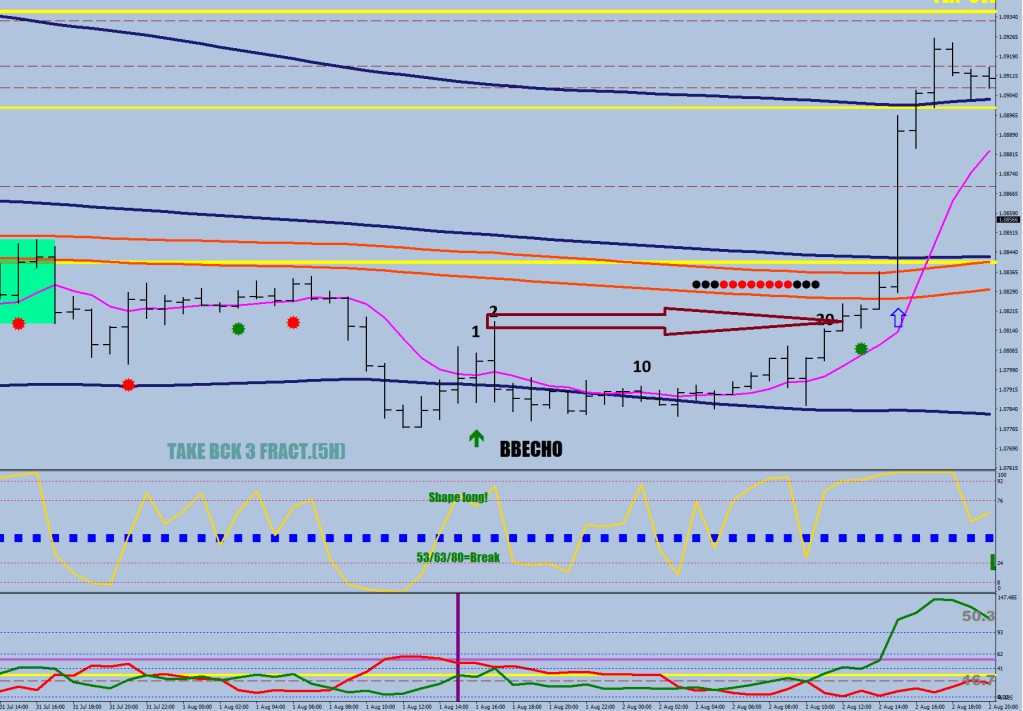
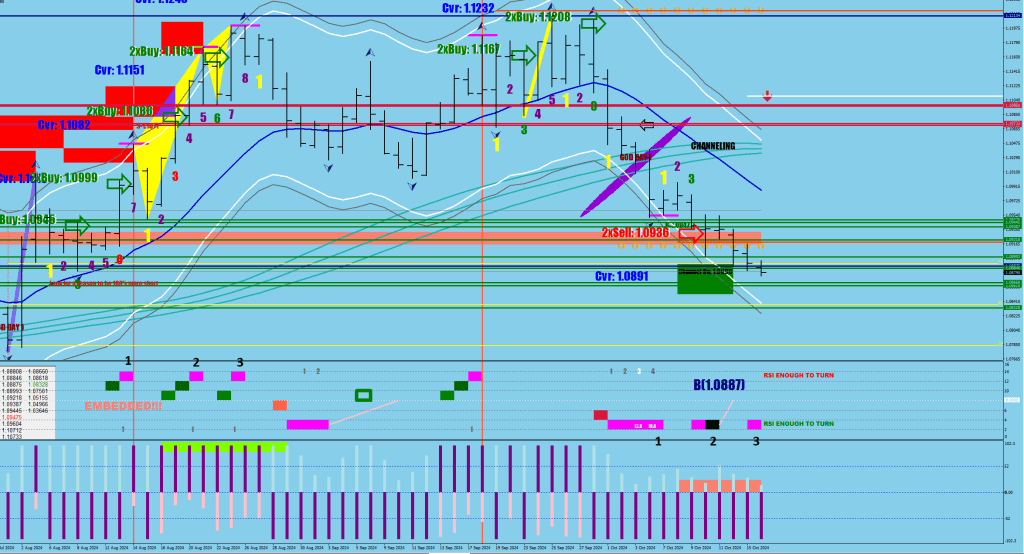
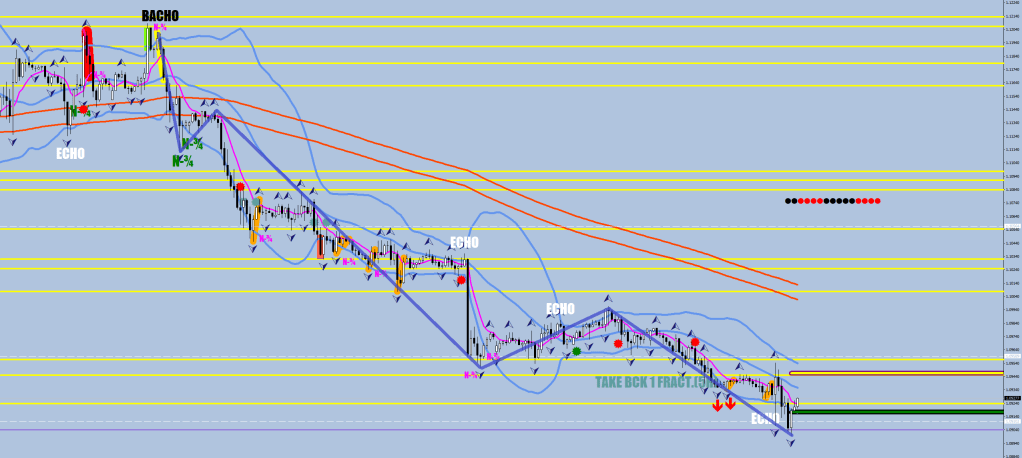
Here are the 3 Shapes that were printed at the lower 240 BB from the last 1600 samples.


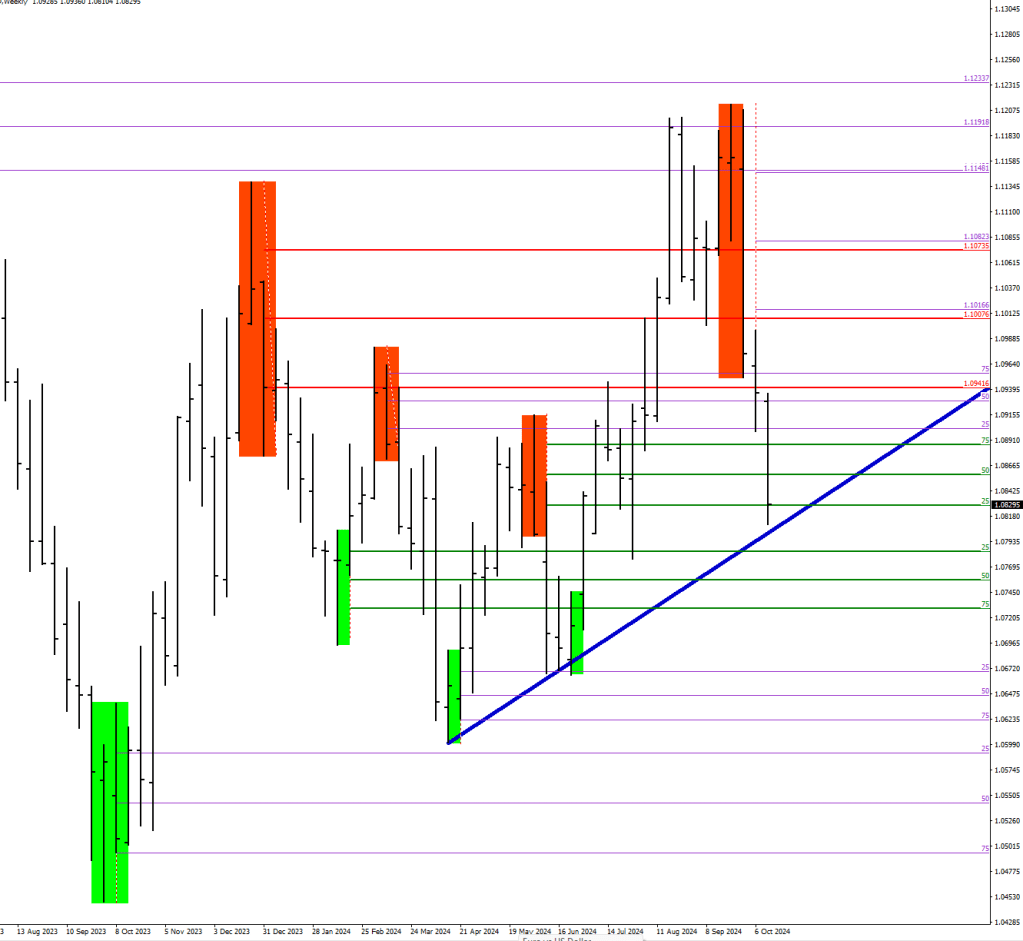
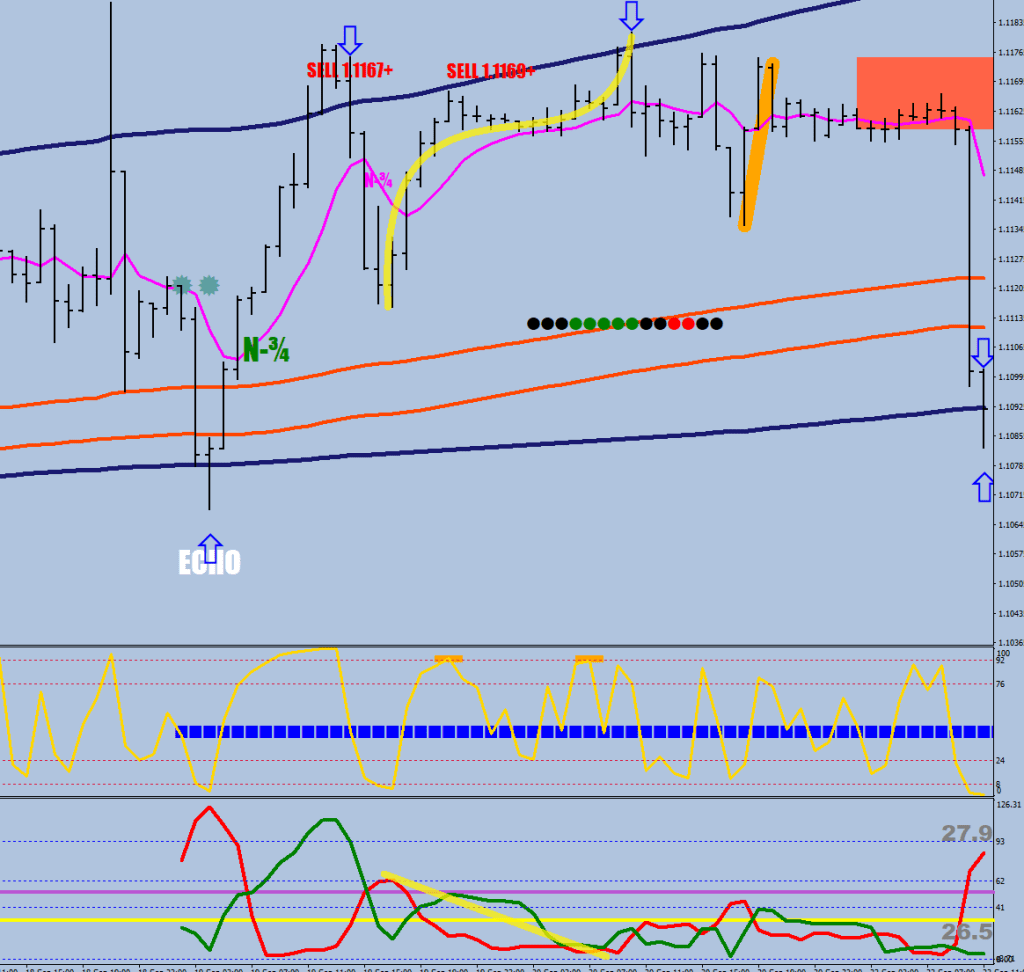
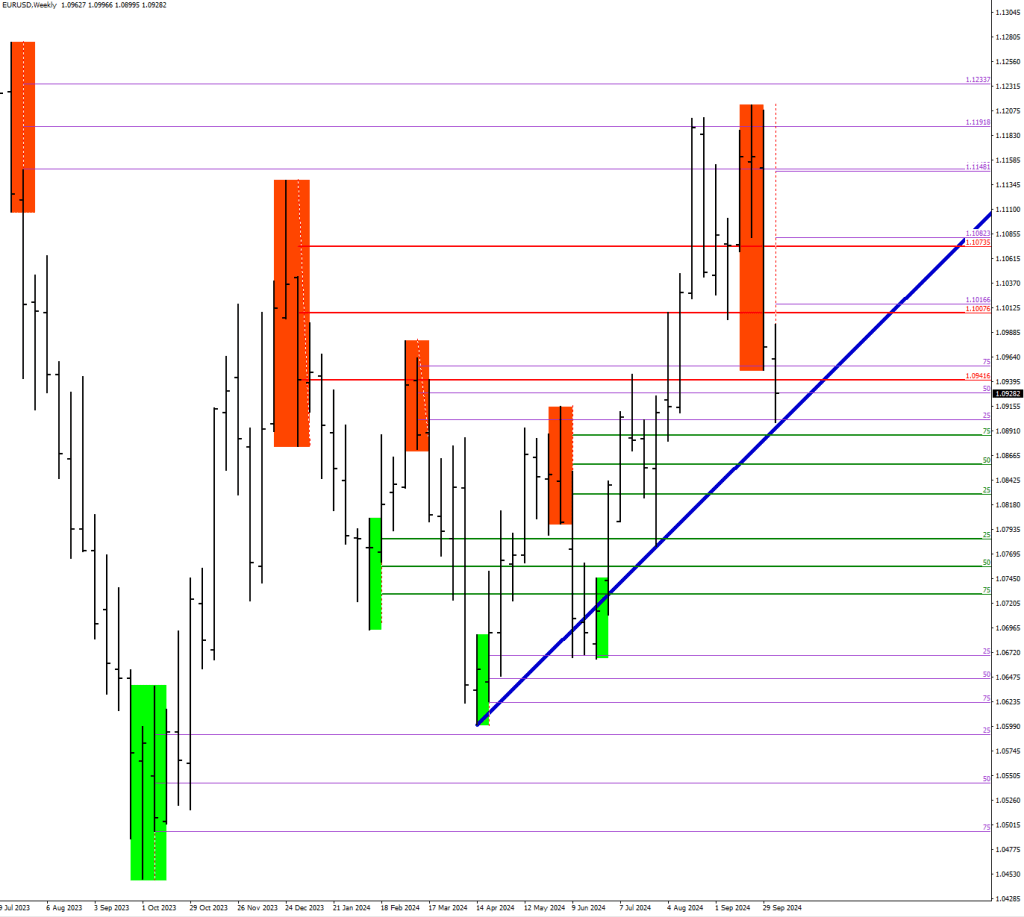
What do you notice about the location of the Municipal trench (Orange, daily E-9)?
80 pips from the low put the price over it every time.

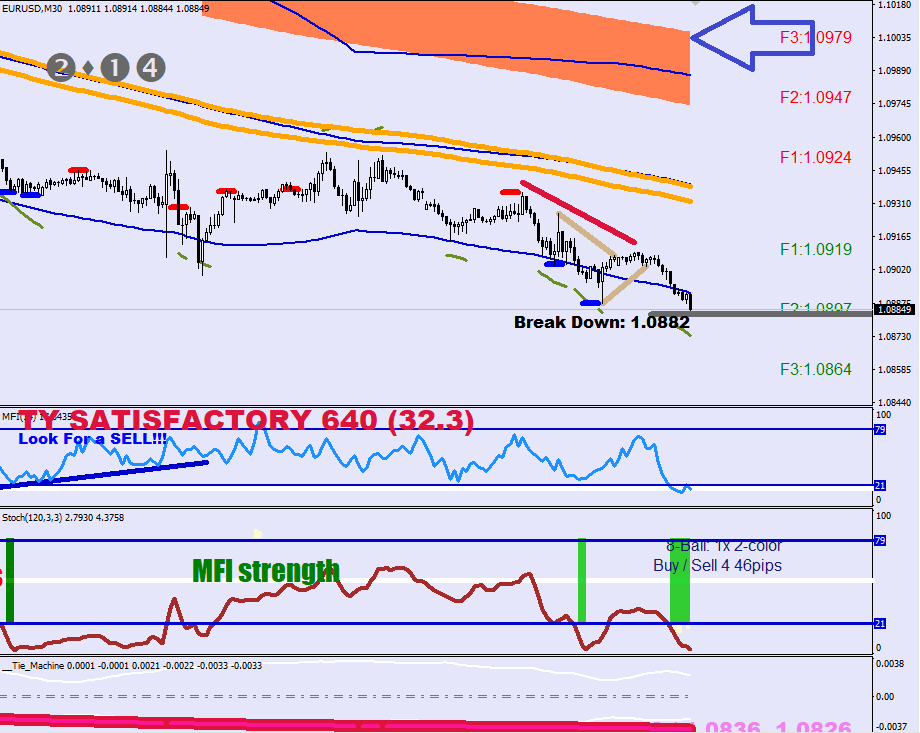
Currently, the E-9 is still too far (not within 80 pips for sure). The breakout did happen, but overall an inside day was made not getting to the previous day’s high. If the trendline was to get a backtest, that would mean the price going back to the lower Bollinger to mark time.
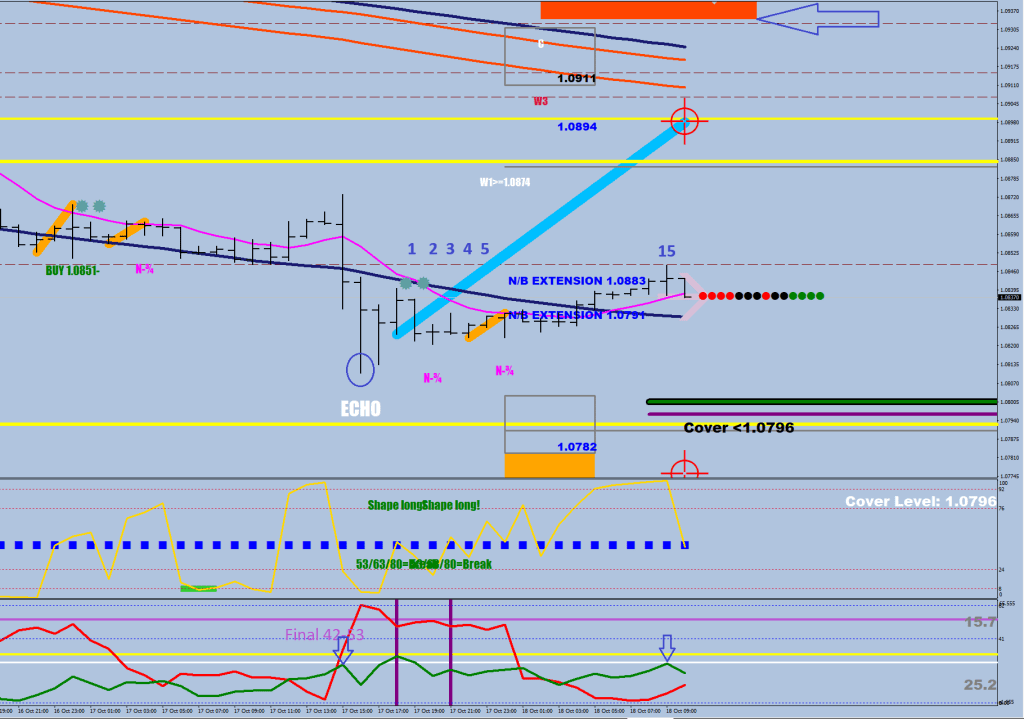
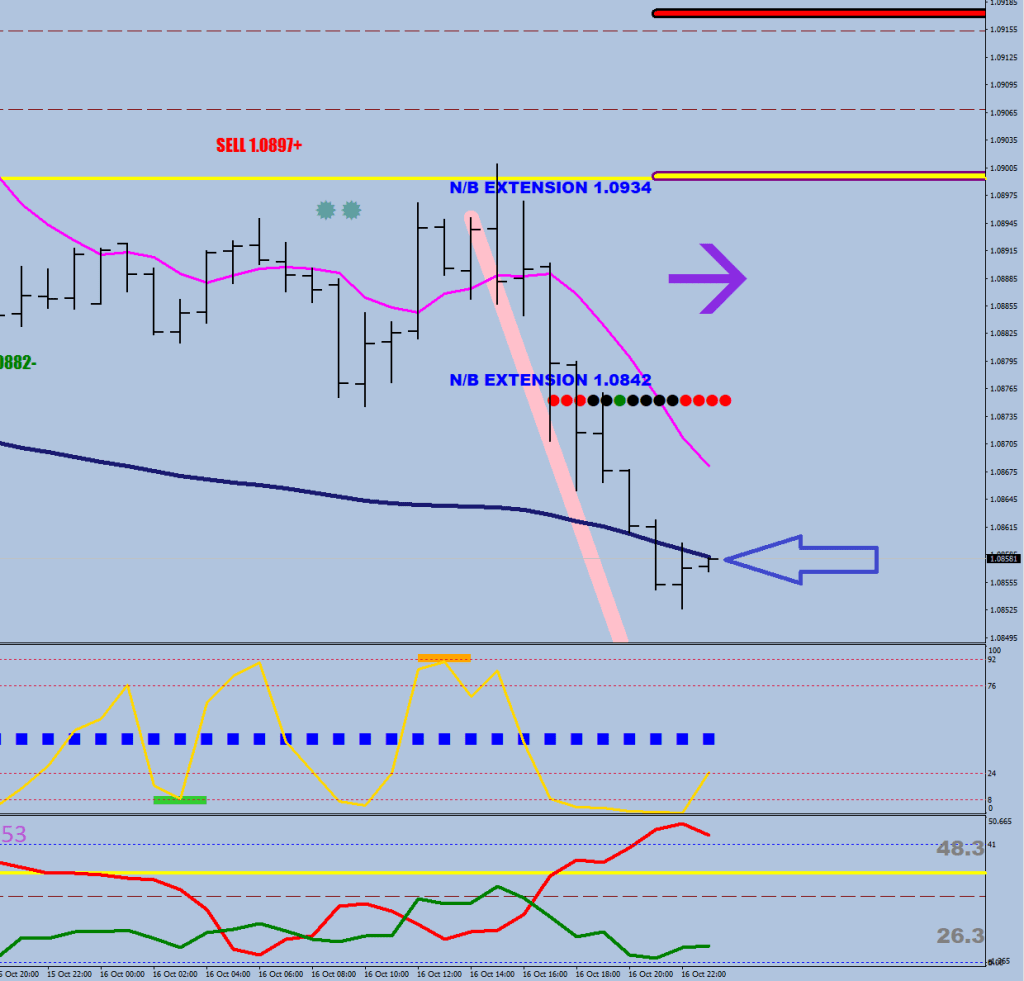
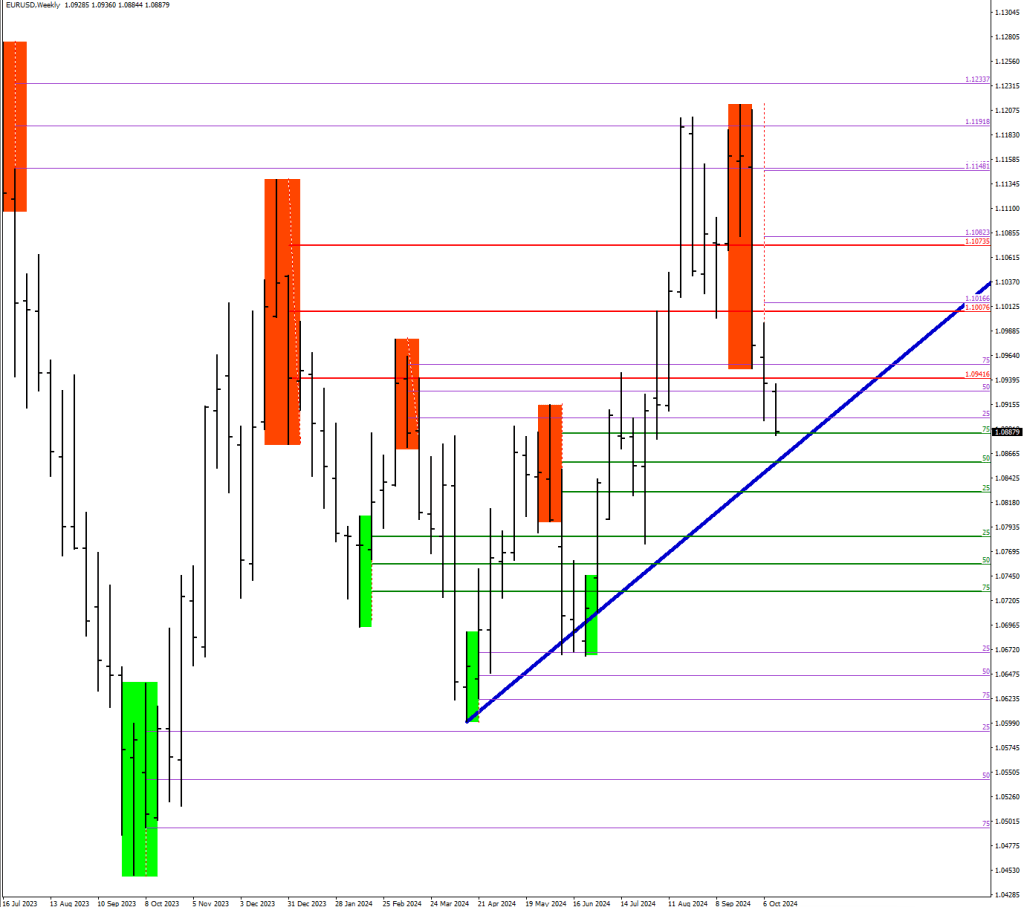
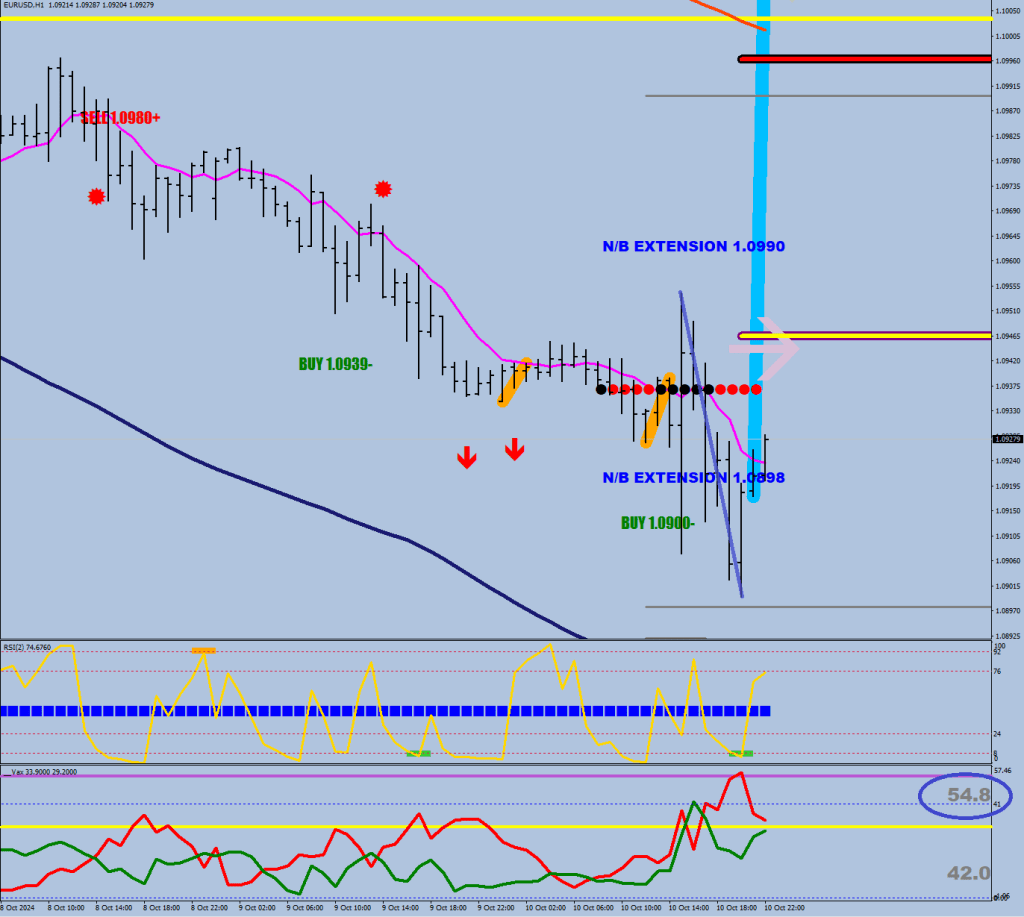
Lower low?
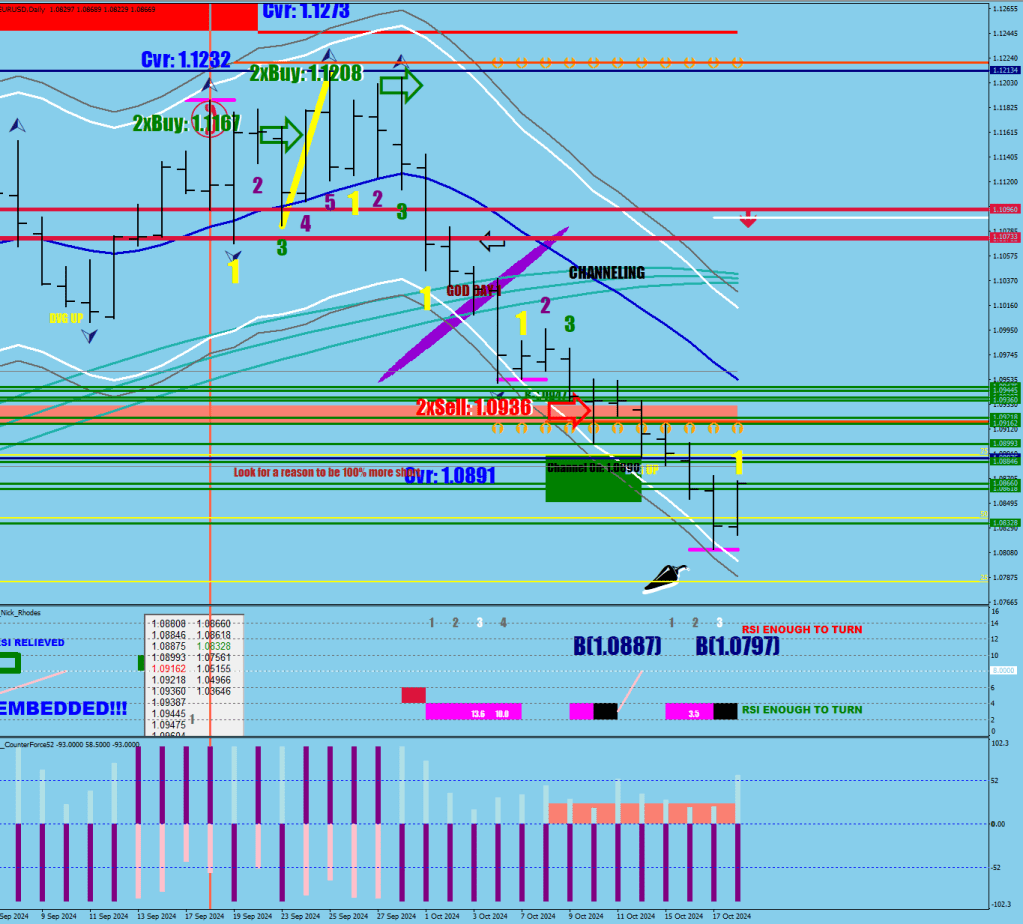
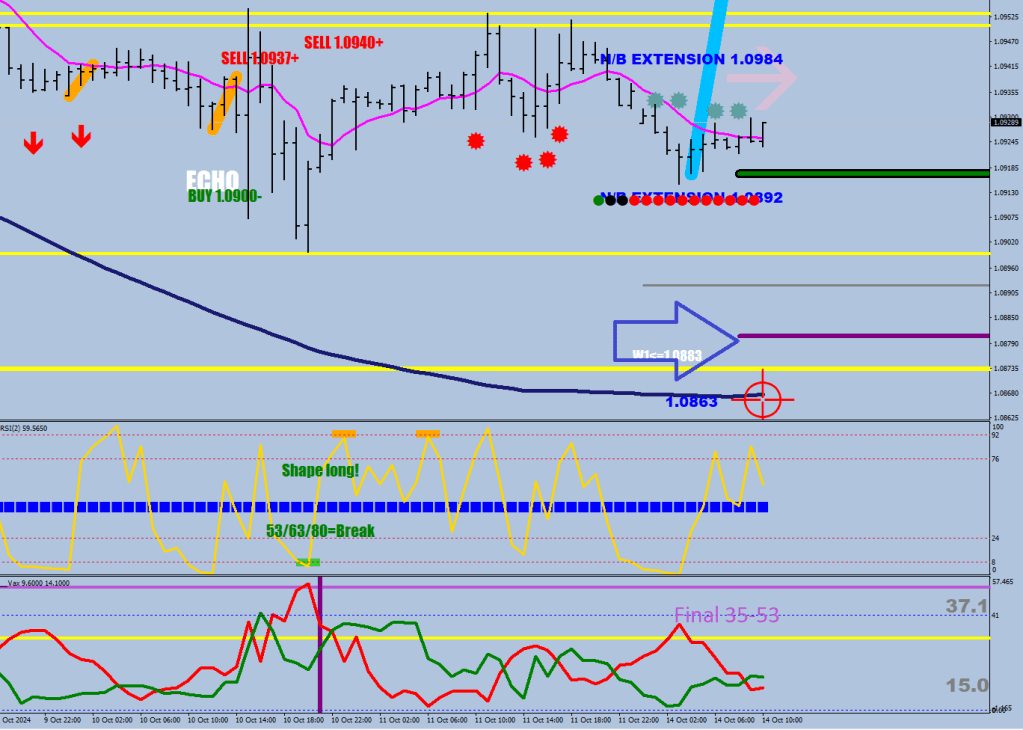
I have to say that 1.0797 is attainable now. At the same time, I do not have examples where a black print marked the end of a move.
RSI2[i+1]<5 && RSI2[i]>5 && RSI2[i+6]<5The RSI sequence seems incomplete. The bow back count started with that yellow 1 upon hitting 2.5x stretch.
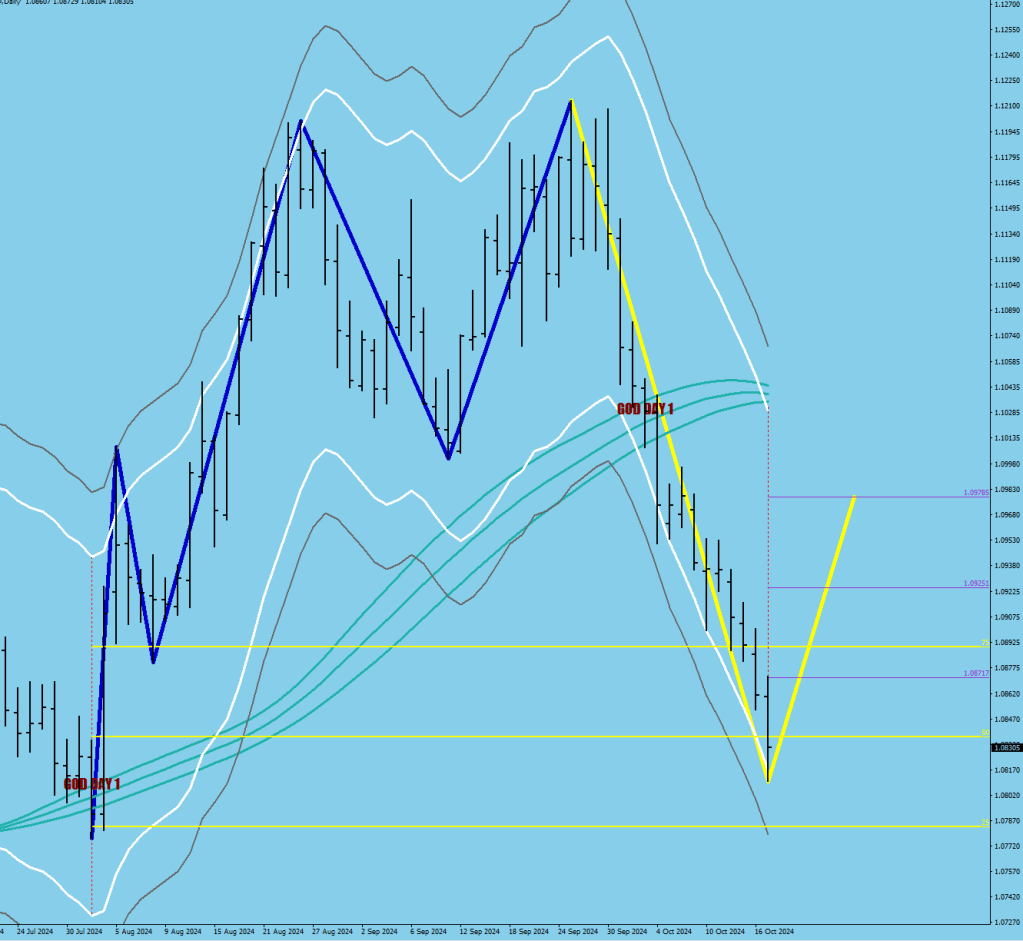
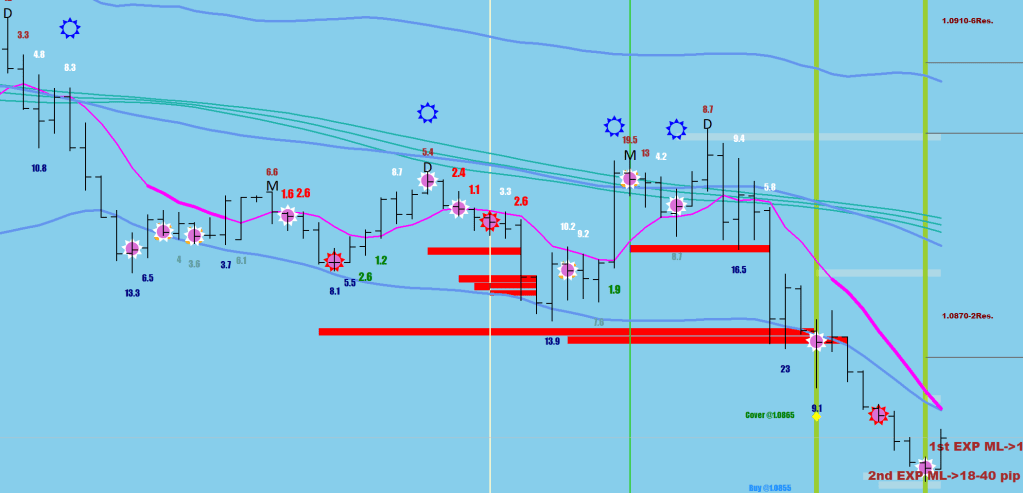
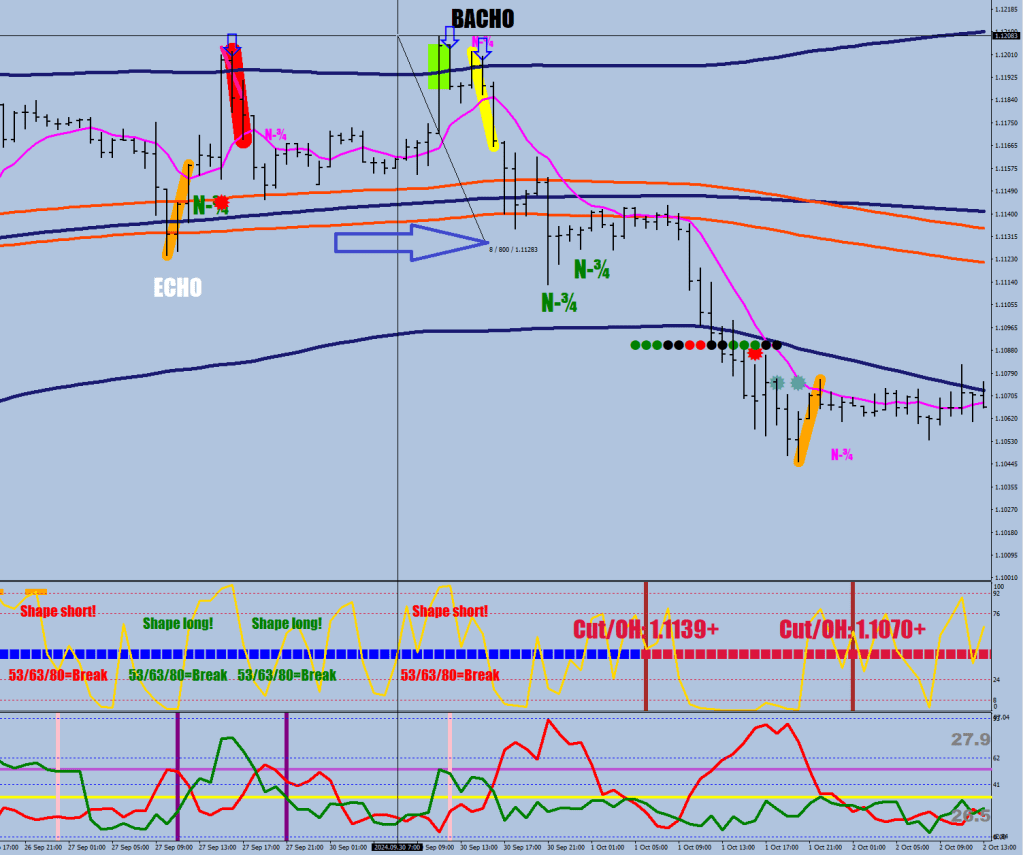
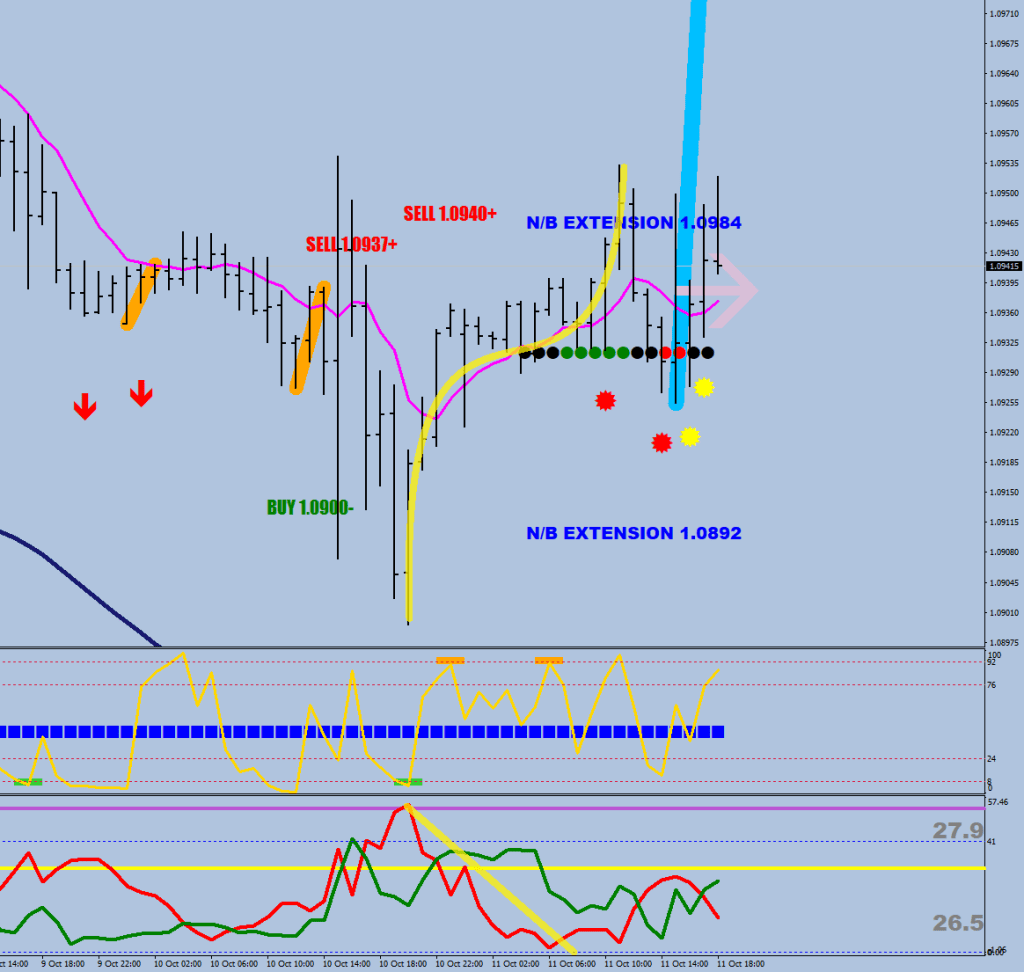
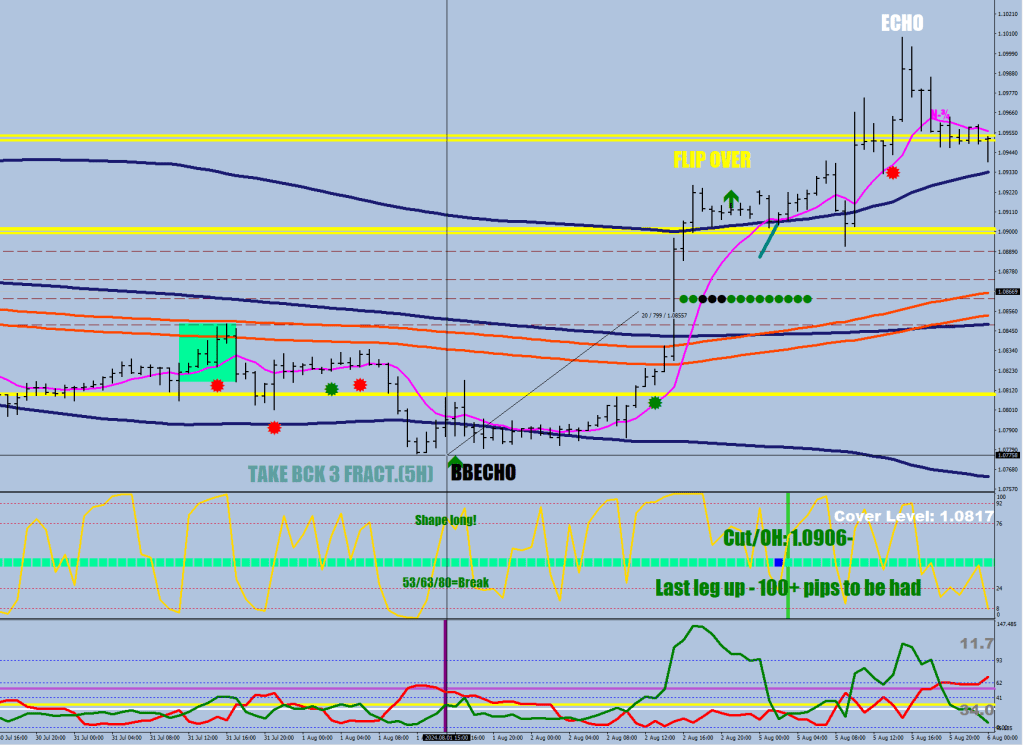
This is how the situation was handled on the upside when the 3rd magenta block took the price too far away from the E-9 (green V):
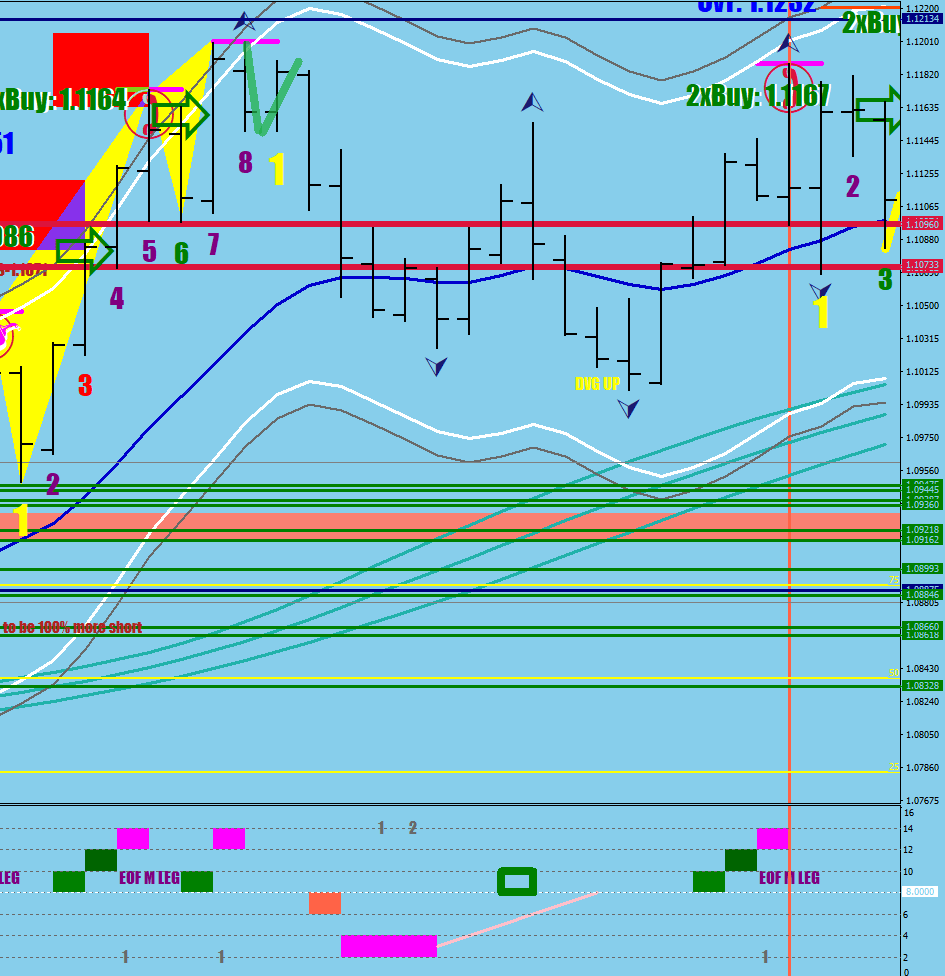
50 pips down then 40 back up. A mini bow back.
There was time burnt. The measuring point was brought closer by a pullback not reaching the swing high.
So both the E-9 got closer and the reference point (to measure from) as well.
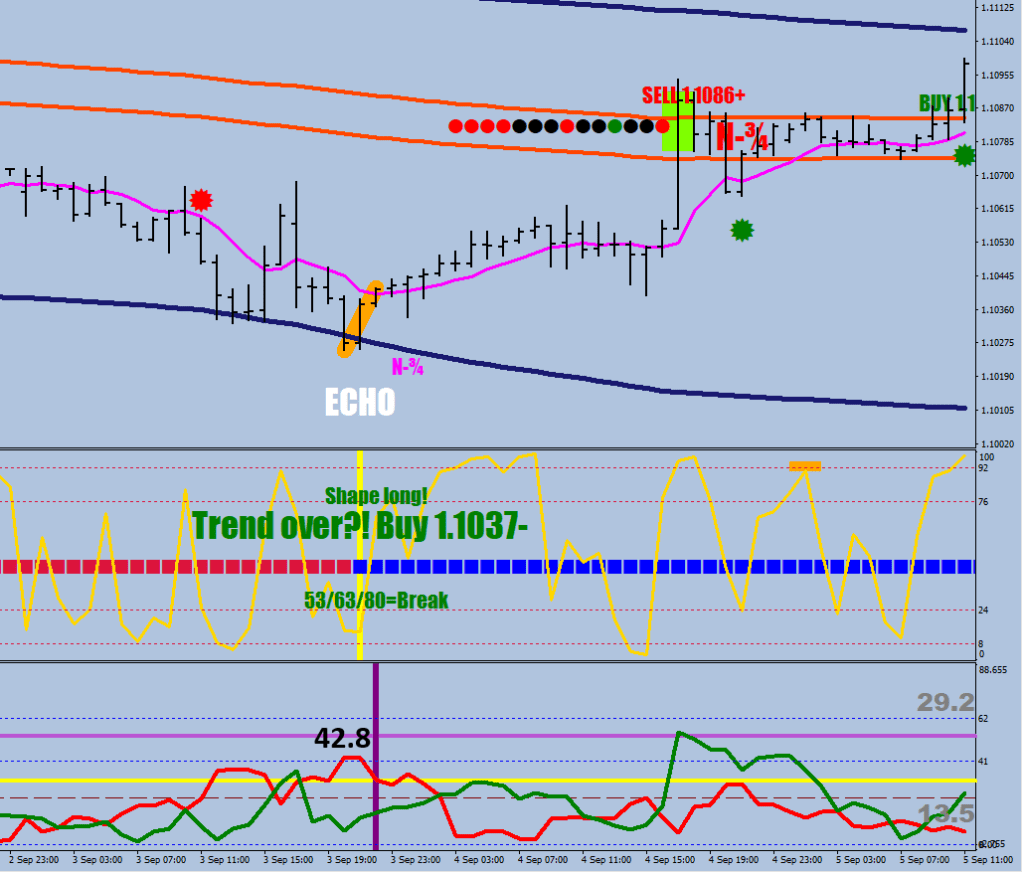
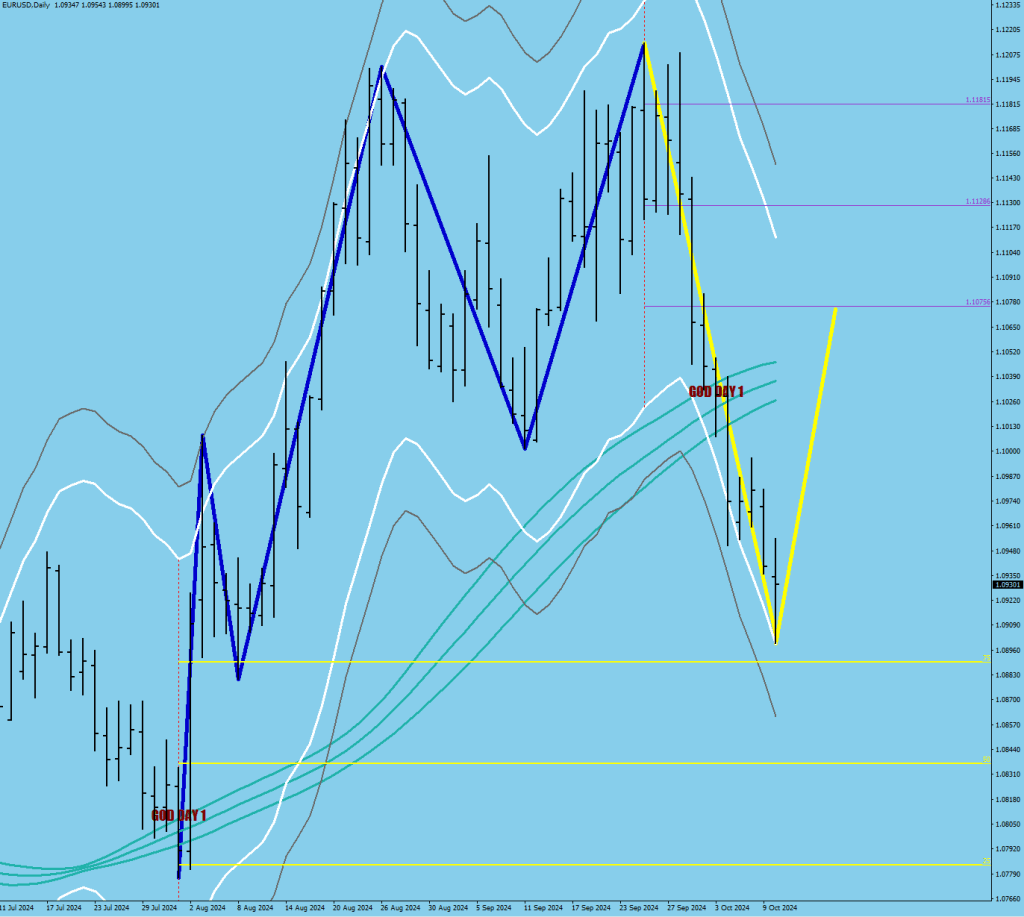
If somehow a lower low would end up being made, that would prolong the affair even further.
These are the two possibilities in my mind at the moment. A gap down would be wasting time, which is in need here.